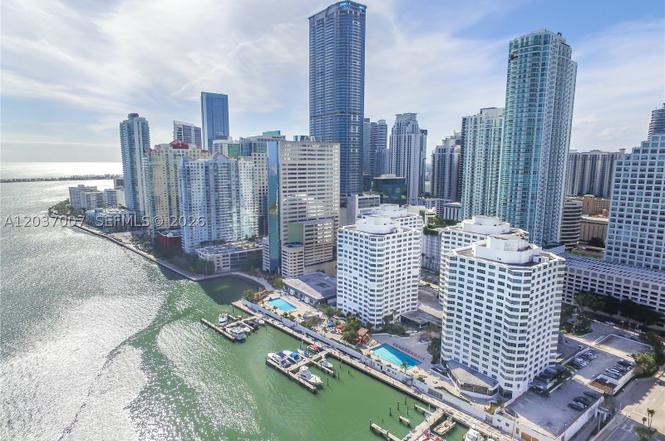
905 Brickell Bay Dr #623 · Miami, FL
Flood risk 10/10 · Severe
- FEMA flood zone
- VE
- Chance of flooding over 30 yrs
- 0.99%
- Est. flood insurance / yr
- $5,013 – $11,043
Fire risk 1/10 · Minimal
- Est. fire insurance / yr
- $947 – $1,759
Heat risk 10/10 · Severe
- Hot days now (above 103°F)
- 7 days/yr
- Hot days in 30 yrs
- 27 days/yr
Wind risk 10/10 · Severe
- Chance of severe wind over 30 yrs
- 99.0%
Air-quality risk 2/10 · Minimal
- Unhealthy air days now
- 1 days/yr
- Unhealthy air days in 30 yrs
- 1 days/yr
Risk factors via First Street. Map © Google.
Why this score? — see what drove the C+ grade
The composite is a weighted blend of 9 inputs, each scored 0–100. Each bar is that input's sub-score; the figure is the points it added to the 100-point composite (weight × sub-score).
- Cash flow +22.4/30.0
- 1% rule +8.2/10.0
- ARV discount +7.5/15.0
- DSCR +7.2/10.0
- Schools +5.0/10.0
- Appreciation +4.0/10.0
- Livability +3.9/5.0
- Rent growth +3.0/5.0
- Condition / age +2.5/5.0
$295,000
🖨 Deal sheet (PDF) 📄 Offer letter ✓ Due diligence
Listing remarks MLS
Fully renovated apartment in desirable Brickell area. Apartment converted from studio into spacious 1/1. Great investment, rents fast. Building on the bay with large pool, Jacuzzi, gym, stores, and restaurants. Prime location! HOA includes power & water. Brand new never used appliances. Includes shutters and additional storage unit.
Key facts
- Beauty salon
- Massage haven
- Pool bar
Tags
Property features AI
Finance
- Other: Waterfront property with Intracoastal access
- Financial info: Pets allowed
- HOA & community: Monthly association fee of $590; Association fees cover electricity, water, sewer, trash, and security; Community amenities include fitness center, barbecue, and picnic area
Exterior
- Parking: Detached 1-car garage; One covered parking space
- Security: Key card entry
- Utilities: Water service included with association; Sewer service included with association; Electric service included with association
- Home design: Attached property; Entry on level 6; Resale unit
- Construction: Block construction; 20-story building
- Exterior features: Barbecue; Intracoastal access (waterfront)
Interior
- Kitchen: Electric range; Refrigerator
- Bedrooms: Bedroom on main level
- Flooring: Laminate flooring
- Bathrooms: 1 full bathroom
- Heating & cooling: Central heating (electric); Central air conditioning (electric)
- Interior features: First-floor entry; Bedroom on main level
Neighborhood map
What this means for you Summary
Snapshot
- This is a 1-bed/1.0-bath condo listed at $295k.
Deal economics
- At list price, monthly cash flow is $-176 ($-2k/yr) — negative.
- To cash-flow at today's rent, offer at most $264k (10.5% below list).
- Meets the 1% rule at list price ($4k rent vs $295k).
- Recommended offer: $264k (10.5% below list) — sets the bar for cash-flow.
- Cap rate 8.3% vs local median 1.9% in Miami — top-decile yield for the area; either an underpriced asset or a hidden risk that comps aren't pricing in. Stress-test before assuming the spread holds.
Location & tenants
- Location reads 78/100 on livability (#177 in FL, #2,724 nationally) — a middle-class / working-renter tenant base. Strengths: amenities A+, commute A+, health & safety A+; Watch: employment C-, crime F, cost of living F.
- Zoned schools: Southside Preparatory Academy (math 54% / reading 61%, grade C+, #764 of 2,144 statewide, top 36%, 929 students, 39% FRL); Shenandoah Middle School (math 34% / reading 44%, grade F, #381 of 571 statewide, top 67%, 1,296 students, 72% FRL); Booker T. Washington Senior High (math 12% / reading 19%, grade F, #604 of 667 statewide, top 91%, 1,014 students, 60% FRL).
- Market conditions: Rents rising (+2.0%/yr); 1019 active listings in the ZIP; 1 comparable units currently listed for rent nearby; high-income renter base; 10,051 units permitted in Miami-Dade County in 2024 (7,758 in 5+ unit buildings).
- This rent runs 32% of the median local income ($144k/yr) — at the standard rent-burdened threshold; future hikes will face affordability resistance.
Forward outlook
- Local home prices are declining (-2.1%/yr); year-one equity from $2k of loan paydown is wiped out by about $6k of value loss. Plan a longer hold.
- Miami-Dade County population projected at +28% by 2050 — long-run rental-demand tailwind backs the buy-and-hold thesis.
Negotiation context
- Only 7 days on market — expect competitive offers; lowballing is unlikely to land.
- 4 sale attempts since 11y ago with the ask held roughly flat each time — persistent listings suggest the price (not the market) is what's stuck; bring a comps-based counter.
- Current owner paid $190k; list at $295k implies a 55% gain — meaningful room to come down on a strong offer.
Risks & watch-outs
- Watch-outs: flood insurance adds $669/mo.
- Climate carrying-cost: in FEMA flood zone VE (mandatory federal flood insurance); severe wind risk, 99% chance of damaging wind over 30y; extreme-heat days projected 7→27/yr by 2055 (HVAC capex compounding) — expect insurance premiums to compound above CPI over the hold.
Questions for the listing agent
- What do current leases actually rent for vs. the listed asking? Can we see a recent rent roll and the last 12 months of T-12 income?
- Built in 1968 — when were the roof, HVAC, electrical panel, plumbing, and water heater last replaced?
- What's the actual annual flood-insurance premium (NFIP or private), and is the property in a SFHA with mandatory coverage?
- What does the HOA fee cover, when was the last increase, and are there any pending special assessments or reserve-fund shortfalls?
- Any open or pending special assessments — roof, HVAC, plumbing, elevator, façade? What's the per-unit balance and payoff schedule, and is the seller paying it off at close or rolling it to the buyer?
- Is there a deadline driving the sale (1031 exchange, divorce, estate, relocation)? That informs how much negotiation room exists.
- Schools are B-rated — typically a magnet for longer-tenancy family renters. What's the average tenant stay here, and is there a school-zone premium baked into asking?
- Crime grade is F in this area — have there been break-ins, vandalism, or insurance claims at this property in the last 3 years? What carrier currently insures it and at what premium?
- What's the average days-on-market for RENTAL listings here right now (not sales)? A rising rental-DOM trend means longer vacancies and softer asking-rent achievability than the comps imply.
- What's the recent tenant-quality profile in this submarket — average credit score on applications, eviction rate, late-payment / NSF rate, and stable-employment percentage? A property-management company in the area should have these aggregated.
- How much new apartment / multifamily construction is in the pipeline within 1–3 miles? Heavy new supply (>2% of stock underway) typically softens rents 12–24 months out; light construction supports rent growth.
Investment metrics
- 1% rule
- 1.32% ✓
- Cap rate
- 8.30%
- Cash-on-cash
- 7.16%
- DSCR
- 1.32
- GRM
- 6.3
CMA / ARV
No comps found within radius.
Projected returns pro-forma
-2.09% appreciation · 2.04% rent growth · sell at horizon
- IRR
- -16.0%
- Equity multiple
- 0.39×
- Total profit
- $-50,599
- Equity at exit
- $56,031
- IRR
- -10.4%
- Equity multiple
- 0.27×
- Total profit
- $-60,149
- Equity at exit
- $46,686
Cash invested: $82,600 (down + closing). Projections, not guarantees.
Landlord ↔ Tenant lean methodology
- Overall (STATE)
- 87 Strongly Landlord-Friendly
- State Florida
- 87 Strongly Landlord-Friendly · R+3
- County
- — inherits STATE
- City
- — inherits STATE
ZIP-level market 33131
- Home prices YoY
- -0.7%
- Rents YoY
- 2.0%
- Active inventory
- 1019
- Price-to-rent
- 6.3×
Monthly cashflow live
- Estimated rent
- $3,886 medium interval (Pro) →
- Mortgage (P&I)
- −$1,547
- Tax from tax record
- −$317 /mo · $3,805/yr
- Insurance
- −$123
- Flood insurance flood zone
- −$669 /mo · $8,028/yr
- HOA
- −$590
- Vacancy / Maint / Mgmt
- −$816
- Net cashflow
- $-176
Break-even live
Sensitivity live
| Price | -10% $-9 | -5% $-92 | +0% $-176 | +5% $-259 | +10% $-343 |
|---|---|---|---|---|---|
| Rent | -10% $-483 | -5% $-329 | +0% $-176 | +5% $-22 | +10% $131 |
| Rate | -1.0pp $-27 | -0.5pp $-101 | base $-176 | +0.5pp $-252 | +1.0pp $-330 |
UW: 25.0% down · 7.5% · 30yr · 1.5% tax · 5.0% vac · 8.0% maint · 8.0% mgmt
Financing live
Cash to close
- Down payment
- $73,750
- Closing costs
- $8,850
- Reserves months
- —
- Total cash needed
- —
Loan-product check · same deal, 3 products live
Conventional
25% down · 7.5% · 30yr
- Down + closing
- —
- Monthly P&I
- —
- Monthly cashflow
- —
- DSCR
- —
- Eligible?
- —
Personal DTI + credit; lowest rate.
DSCR
20% down · 8.5% · 30yr
- Down + closing
- —
- Monthly P&I
- —
- Monthly cashflow
- —
- DSCR
- —
- Eligible?
- —
No personal income docs; deal must DSCR.
Hard money
10% down · 12.0% · 12mo
- Down + closing
- —
- Monthly P&I
- —
- Monthly cashflow
- —
- DSCR
- —
- Eligible?
- —
Short-term bridge; refi at stabilization.
Rent comps 1 comps
| Address | Beds | Baths | Sqft | Rent | $/sqft | DOM | Units | Dist |
|---|---|---|---|---|---|---|---|---|
| 601 NE 1st Ave Unit 1227496P Miami, FL | 3.0 | 1.0–3.0 | 904 | $8,354 | $9.24 | 0d | 4 | 1.16mi |
HOA detail condo
- Monthly dues
- $590 · $7,080/yr
- Likely covers
- waterpoolgym
- Assessments
- None detected in remarks — confirm with the listing agent.
Listing history 6 events
-
2026-06-21days on market $295,000 Active 7 DOM
-
2026-06-18days on market $295,000 Active 4 DOM
-
2026-06-17days on market $295,000 Active 3 DOM
-
2026-06-16days on market $295,000 Active 2 DOM
-
2026-06-15remarks 687-char remark
-
2026-06-15$295,000 Active 1 DOM
ⓘ Source: listings_history table (triggers on properties + properties_extension) + one-shot
backfill from property_details.listing_events for pre-trigger history.
Tax reassessment forecast FL · Resets to sale price
- Current annual tax
- $3,805 · $317/mo
- Projected year-2 tax
- $3,805 · $317/mo
- Expected delta
- $0/yr ($0/mo · 0.0%)
ⓘ Screening estimate from a state-policy table — verify with the county assessor before closing.
Climate risk First Street
- Flood 10/10 Extreme FEMA zone VE · 99% chance over 30 yrs
- Wildfire 1/10 Low
- Heat 10/10 Extreme 7 d/yr ≥103°F today · 27 d/yr by 30 yrs out
- Wind 10/10 Extreme 99% chance of damaging wind over 30 yrs
- Air quality 2/10 Low 1 unhealthy d/yr today · 1 by 30 yrs out
Nearby sold comps map
Loading sold comps map…
Walkable amenities ~0.75 mi
Loading nearby amenities…
Taxation est. · year 1
- Rental income
- $46,635
- − Mortgage interest
- −$16,525
- − Property taxes
- −$3,805
- − Insurance
- −$9,503
- − Repairs & maintenance
- −$3,731
- − Management
- −$3,731
- − HOA
- −$7,080
- − Depreciation
- −$8,582
- Taxable loss
- −$6,321
- Est. tax savings @ 24.0%
- +$1,517
- After-tax cash flow
- $-593/yr
For passive investors: Depreciation is non-cash, so a rental often shows a tax loss while cash-flowing — sheltering income. Rental losses are passive: they offset passive income freely, and up to $25,000/yr can offset ordinary (W-2) income if you actively participate and your MAGI is under $100k (phasing out to $0 by $150k); unused losses carry forward. On sale, claimed depreciation is recaptured at up to 25%, and gains may owe capital-gains tax (a 1031 exchange can defer both). Figures are a year-1 estimate at your 24.0% rate — not tax advice; consult a CPA.
Schools (NCES district)
No district data.
Livability — Miami
- Score
- 78/100
- State rank
- #177
- US rank
- #2724
Category grades
Schools grade is shown separately in the Schools card above.
Census & demographics
- Census place
- Miami, FL
- County
- Miami-Dade County · 2,697,751 people
- City population
- 827,308
- Metro
- Miami-Fort Lauderdale-Pompano Beach, FL
- Population (ZIP)
- 23,095
- Household income
- $144,138
- Rent vs Own
- Severe rent burden
- 1866.0
Population outlook (Miami-Dade County) Hauer SSP2
- Today (2025)
- 3,126,439 people
- By 2030
- 3,325,765 · +6.4%
- By 2040
- 3,697,561 · +18.3%
- By 2050
- 4,012,134 · +28.3%
- By 2075
- 4,605,612 · +47.3%
- By 2100
- 4,866,598 · +55.7%
Race, ethnicity, and origin ACS 2023
- Neighborhood character
- Diverse neighborhood (Simpson 0.61)
- Race & ethnicity
- Hispanic / Latino 52% Two or more races 35% White 33% Asian 4% Black 4%
- Hispanic origin (detail)
- Mexican 4% Puerto Rican 4% Cuban 8% Dominican 1% Salvadoran 3%
- Common ancestry
- Romanian 2% Scotch-Irish 2% Estonian 2%
- Foreign-born
- 54% · Canada, Jamaica, Dominican Republic
- Languages at home
- 30% English-only · Spanish 53% Other Indo-European 6% French/Haitian/Cajun 4%
Political lean MEDSL · Miami-Dade
- 2024 margin
- R (+11.4) · D 43.9% · R 55.4%
- 2008→2024 swing
- -27.6pp toward R · 2008: 16.1pp · 2024: -11.4pp
- All cycles
- 2024: R+11.4 2020: D+7.3 2016: D+29.6 2012: D+23.7 2008: D+16.1
Not yet ingested
- Civics
- —
Market trends
- HPI YoY
- ▼ -2.09%
- Current HPI
- 281.1156
- Rent YoY
- ▲ 2.04%
- Metro
- Miami-Fort Lauderdale-Pompano Beach, FL
- State GDP YoY
- ▲ 3.28%
- F500 in state
- 36
Industry mix (Fortune 500 HQ in FL)
| Industry | F500 HQs | Revenue |
|---|---|---|
| Industrial Technology | 2 | $29B |
|
||
| Insurance | 2 | $17B |
|
||
| Retail | 1 | $60B |
|
||
| Technology Distribution | 1 | $58B |
|
||
| Homebuilding | 1 | $35B |
|
||
| Technology Manufacturing | 1 | $35B |
|
||
Price history
+594.1% since first listed16 events — show timeline
- 2026-06-14 Listed $295,000 MARMLS
- 2023-12-20 Rental Removed — MARMLS
- 2023-11-16 Listed for Rent — MARMLS
- 2023-10-22 Rental Removed — MARMLS
- 2021-08-24 Sold (Public Records) $190,000 Public Records
- 2021-07-31 Listing Removed — MARMLS
- 2021-04-15 Listed $249,000 MARMLS
- 2015-03-06 Sold (Public Records) $190,000 Public Records
- 2015-02-26 Sold (MLS) $190,000 MARMLS
- 2015-02-19 Pending — MARMLS
- 2015-01-14 Listed $199,900 MARMLS
- 2008-07-03 Sold (Public Records) $117,000 Public Records
- 2008-07-01 Sold (MLS) $117,000 MARMLS
- 2004-05-25 Sold (Public Records) $115,000 Public Records
- 1998-03-06 Sold (Public Records) $48,000 Public Records
- 1990-11-30 Sold (Public Records) $42,500 Public Records
Property tax history
+8.3%/yrLatest (2025): $3,805 · +9.6% YoY. Source: county tax records.
Cash-flow waterfall
monthlySold comps — $/sqft
last 12 mo · ≤1 miLoading sold comps…