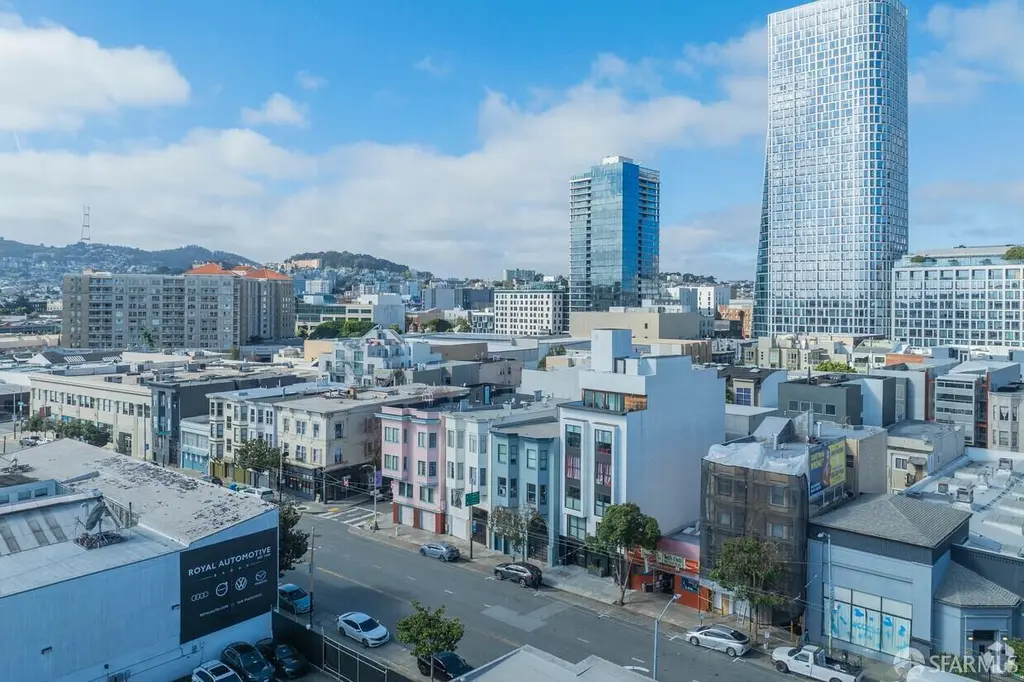
1532 Howard St · San Francisco, CA
Flood risk 4/10 · Minor
- FEMA flood zone
- X (unshaded)
- Chance of flooding over 30 yrs
- 0.22%
- Est. flood insurance / yr
- $507 – $1,088
Fire risk 1/10 · Minimal
- Est. fire insurance / yr
- $659 – $1,223
Heat risk 2/10 · Minimal
- Hot days now (above 78°F)
- 8 days/yr
- Hot days in 30 yrs
- 18 days/yr
Wind risk 1/10 · Minimal
- Chance of severe wind over 30 yrs
- —
Air-quality risk 8/10 · Major
- Unhealthy air days now
- 15 days/yr
- Unhealthy air days in 30 yrs
- 15 days/yr
Risk factors via First Street. Map © Google.
Why this score? — see what drove the D grade
The composite is a weighted blend of 9 inputs, each scored 0–100. Each bar is that input's sub-score; the figure is the points it added to the 100-point composite (weight × sub-score).
- ARV discount +15.0/15.0
- Appreciation +7.5/10.0
- Rent growth +5.0/5.0
- Schools +5.0/10.0
- Condition / age +4.8/5.0
- Livability +3.8/5.0
- Cash flow +0.0/30.0
- 1% rule +0.0/10.0
- DSCR +0.0/10.0
$4,498,000
🖨 Deal sheet 📄 Offer letter ✓ Due diligence
Listing remarks MLS
Rare opportunity to acquire a 15-unit, newly constructed multifamily property in San Francisco. Built in 2020, the six-story, 8,225 SF building features 15 studio condominiums, each with separate APNs, allowing flexibility to operate as apartments or sell units individually now or in the future. Each modern studio includes a full kitchen with dishwasher and microwave, in-unit washer/dryer, full bath, and walk-in closet. The contemporary design and abundant natural light appeal to today's renters, with strong upside potential as San Francisco rents continue to rise
Key facts
- Walk-in closet
- In-unit washer dryer
- Built 2019
Tags
Neighborhood map
What this means for you Summary
Snapshot
- This is a ?-bed/15.0-bath townhouse listed at $4.50M. Condition is rated excellent.
Deal economics
- At list price, monthly cash flow is $-29k ($-343k/yr) — negative.
- To cash-flow at today's rent, offer at most $410k (90.9% below list).
- To meet the 1% rule (rent ≥ 1% of price), the offer needs to be $359k (92.0% below list).
- Recommended offer: $359k (92.0% below list) — sets the bar for 1% rule.
- Cap rate -1.3% vs local median 2.1% in San Francisco — below-typical yield; the buyer is paying a premium for something (appreciation thesis, condition, location) that the cap rate doesn't capture.
Location & tenants
- Location reads 76/100 on livability (#90 in CA, #3,143 nationally) — a middle-class / working-renter tenant base. Strengths: amenities A+, commute A+, employment A+; Watch: crime F, cost of living F.
- San Francisco Unified (urban): math 50% / reading 56% proficiency, ranked #322 of 1,400 in CA (top 23%) — acceptable for families but not a draw, mixed tenant base, ~2y average lease.
- Market conditions: Rents rising fast (+15.5%/yr); 108 active listings in the ZIP; 1 comparable units currently listed for rent nearby; high-income renter base; 750 units permitted in San Francisco County in 2024 (688 in 5+ unit buildings).
- This rent runs 37% of the median local income ($116k/yr) — at the standard rent-burdened threshold; future hikes will face affordability resistance.
Forward outlook
- In year one you build about $254k of equity ($31k loan paydown + $223k appreciation (5.0% local appreciation)).
- San Francisco County population projected at +39% by 2050 — long-run rental-demand tailwind backs the buy-and-hold thesis.
- By year 2, paydown + projected appreciation supports a ~$408k cash-out refi (75% LTV) — recoverable capital for the next deal without selling this one.
Negotiation context
- It's been on market 125 days — a 12% lower offer ($3.96M) is reasonable based on typical stale-listing flexibility.
- 4 sale attempts; this cycle's ask is 173233% above the opening price — seller raised mid-cycle; expect resistance to lowballs.
Questions for the listing agent
- What do current leases actually rent for vs. the listed asking? Can we see a recent rent roll and the last 12 months of T-12 income?
- It's been on market 125 days. Have you received any prior offers? Is the seller open to a 92% concession, seller financing, or rate buy-down credit?
- Why hasn't it sold? Are there any deal-killer items the seller is aware of (foundation, flood, title, zoning, code violations)?
- Is there a deadline driving the sale (1031 exchange, divorce, estate, relocation)? That informs how much negotiation room exists.
- Schools are B-rated — typically a magnet for longer-tenancy family renters. What's the average tenant stay here, and is there a school-zone premium baked into asking?
- Crime grade is F in this area — have there been break-ins, vandalism, or insurance claims at this property in the last 3 years? What carrier currently insures it and at what premium?
- The area grade is low — what's the realistic commute time and amenity access for the typical tenant pool here? Any planned neighborhood developments (good or bad) we should know about?
- What's the average days-on-market for RENTAL listings here right now (not sales)? A rising rental-DOM trend means longer vacancies and softer asking-rent achievability than the comps imply.
- What's the recent tenant-quality profile in this submarket — average credit score on applications, eviction rate, late-payment / NSF rate, and stable-employment percentage? A property-management company in the area should have these aggregated.
- How much new for-sale + rental construction is in the pipeline within 1–3 miles? Heavy new supply typically softens prices + rents 12–24 months out; constrained supply supports both.
Investment metrics
- 1% rule
- 0.08% ✗
- Cap rate
- -1.33%
- Cash-on-cash
- -27.23%
- DSCR
- -0.21
- GRM
- 104.5
CMA / ARV
- ARV (median comp)
- $6,144,589
- List price
- $4,498,000
- Delta
- -26.80%
- Verdict
- UNDERPRICED
- Comps
- 4 within 2.0 mi
Projected returns pro-forma
4.96% appreciation · 8.0% rent growth · sell at horizon
- IRR
- -9.3%
- Equity multiple
- 0.39×
- Total profit
- $-773,793
- Equity at exit
- $2,538,715
- IRR
- -2.8%
- Equity multiple
- 0.43×
- Total profit
- $-714,166
- Equity at exit
- $4,373,031
Cash invested: $1,259,440 (down + closing). Projections, not guarantees.
Landlord ↔ Tenant lean methodology
- Overall (CITY)
- 0 Strongly Tenant-Friendly
- State California
- 18 Strongly Tenant-Friendly · D+13
- County
- — inherits STATE
- City San Francisco
- 0 Strongly Tenant-Friendly · D+57
ZIP-level market 94103
- Home prices YoY
- 2.9%
- Rents YoY
- 15.5%
- Active inventory
- 108
- Price-to-rent
- 104.5×
Monthly cashflow live
- Estimated rent
- $3,586 medium interval (Pro) →
- Mortgage (P&I)
- −$23,588
- Tax from tax record
- −$5,948 /mo · $71,375/yr
- Insurance
- −$1,874
- HOA
- −$0
- Vacancy / Maint / Mgmt
- −$753
- Net cashflow
- $-28,577
Break-even live
UW: 25.0% down · 7.5% · 30yr · 1.5% tax · 5.0% vac · 8.0% maint · 8.0% mgmt
Financing live
Cash to close
- Down payment
- $1,124,500
- Closing costs
- $134,940
- Reserves months
- —
- Total cash needed
- —
Loan-product check · same deal, 3 products live
Conventional
25% down · 7.5% · 30yr
- Down + closing
- —
- Monthly P&I
- —
- Monthly cashflow
- —
- DSCR
- —
- Eligible?
- —
Personal DTI + credit; lowest rate.
DSCR
20% down · 8.5% · 30yr
- Down + closing
- —
- Monthly P&I
- —
- Monthly cashflow
- —
- DSCR
- —
- Eligible?
- —
No personal income docs; deal must DSCR.
Hard money
10% down · 12.0% · 12mo
- Down + closing
- —
- Monthly P&I
- —
- Monthly cashflow
- —
- DSCR
- —
- Eligible?
- —
Short-term bridge; refi at stabilization.
Rent comps 1 comps
| Address | Beds | Baths | Sqft | Rent | $/sqft | DOM | Units | Dist |
|---|---|---|---|---|---|---|---|---|
| 14 Isis St Unit 4 San Francisco, CA | 1.0 | 1.0 | 5526 | $3,200 | $0.58 | 44d | 1 | 0.19mi |
Listing history 24 events
-
2026-06-18days on market $4,498,000 Active 125 DOM
-
2026-06-17days on market $4,498,000 Active 124 DOM
-
2026-06-16days on market $4,498,000 Active 123 DOM
-
2026-06-15days on market $4,498,000 Active 122 DOM
-
2026-06-13days on market $4,498,000 Active 120 DOM
-
2026-06-13days on market $4,498,000 Active 119 DOM
-
2026-06-09days on market $4,498,000 Active 116 DOM
-
2026-06-08days on market $4,498,000 Active 115 DOM
-
2026-06-07days on market $4,498,000 Active 114 DOM
-
2026-06-04days on market $4,498,000 Active 111 DOM
-
2026-06-03days on market $4,498,000 Active 110 DOM
-
2026-06-02days on market $4,498,000 Active 109 DOM
-
2026-06-01days on market $4,498,000 Active 108 DOM
-
2026-05-31days on market $4,498,000 Active 107 DOM
-
2026-05-17price $2,495
-
2026-05-11$2,595
-
2026-05-01historical $2,695
-
2026-04-20price $4,498,000 570-char remark
Show marketing remark (570 chars)
Rare opportunity to acquire a 15-unit, newly constructed multifamily property in San Francisco. Built in 2020, the six-story, 8,225 SF building features 15 studio condominiums, each with separate APNs, allowing flexibility to operate as apartments or sell units individually now or in the future. Each modern studio includes a full kitchen with dishwasher and microwave, in-unit washer/dryer, full bath, and walk-in closet. The contemporary design and abundant natural light appeal to today's renters, with strong upside potential as San Francisco rents continue to rise
-
2026-04-01$2,695
-
2026-03-31historical $2,495
-
2026-03-05$2,495
-
2026-02-13$4,895,000 Active 570-char remark
Show marketing remark (570 chars)
Rare opportunity to acquire a 15-unit, newly constructed multifamily property in San Francisco. Built in 2020, the six-story, 8,225 SF building features 15 studio condominiums, each with separate APNs, allowing flexibility to operate as apartments or sell units individually now or in the future. Each modern studio includes a full kitchen with dishwasher and microwave, in-unit washer/dryer, full bath, and walk-in closet. The contemporary design and abundant natural light appeal to today's renters, with strong upside potential as San Francisco rents continue to rise
-
2023-08-14historical $1,750
-
2023-07-30price $1,750
ⓘ Source: listings_history table (triggers on properties + properties_extension) + one-shot
backfill from property_details.listing_events for pre-trigger history.
Tax reassessment forecast CA · Resets to sale price
- Current annual tax
- $71,375 · $5,948/mo
- Projected year-2 tax
- $71,375 · $5,948/mo
- Expected delta
- $0/yr ($0/mo · 0.0%)
ⓘ Screening estimate from a state-policy table — verify with the county assessor before closing.
Climate risk First Street
- Flood 4/10 Moderate FEMA zone X (unshaded) · 22% chance over 30 yrs
- Wildfire 1/10 Low
- Heat 2/10 Low 8 d/yr ≥78°F today · 18 d/yr by 30 yrs out
- Wind 1/10 Low
- Air quality 8/10 Severe 15 unhealthy d/yr today · 15 by 30 yrs out
Nearby sold comps map
Loading sold comps map…
Walkable amenities ~0.75 mi
Loading nearby amenities…
Taxation est. · year 1
- Rental income
- $43,032
- − Mortgage interest
- −$251,958
- − Property taxes
- −$71,375
- − Insurance
- −$22,490
- − Repairs & maintenance
- −$3,443
- − Management
- −$3,443
- − Depreciation
- −$130,851
- Taxable loss
- −$440,527
- Est. tax savings @ 24.0%
- +$105,727
- After-tax cash flow
- $-237,199/yr
For passive investors: Depreciation is non-cash, so a rental often shows a tax loss while cash-flowing — sheltering income. Rental losses are passive: they offset passive income freely, and up to $25,000/yr can offset ordinary (W-2) income if you actively participate and your MAGI is under $100k (phasing out to $0 by $150k); unused losses carry forward. On sale, claimed depreciation is recaptured at up to 25%, and gains may owe capital-gains tax (a 1031 exchange can defer both). Figures are a year-1 estimate at your 24.0% rate — not tax advice; consult a CPA.
Condition & rehab AI · 13 photos
This property is in excellent condition with no visible repairs or maintenance needed. It is move-in ready and has a strong resale and rental value due to its location and modern design.
Value-add opportunities
- Both Painting the exterior and interior walls — Painting the exterior and interior walls can enhance the curb appeal and interior aesthetics, which can increase both resale and rental value.
- Both Landscaping improvements — Landscaping improvements can enhance the curb appeal and increase the property's value, making it more attractive to potential buyers and renters.
Renovation cost estimate screening
Value-add ROI direction
- Both Painting the exterior and interior walls — Painting the exterior and interior walls can enhance the curb appeal and interior aesthetics, which can increase both resale and rental value. ↑
- Both Landscaping improvements — Landscaping improvements can enhance the curb appeal and increase the property's value, making it more attractive to potential buyers and renters. ↑
ⓘ Cost ranges are severity-bucket heuristics (US national rule-of-thumb). Get contractor quotes + a written scope before underwriting a rehab budget.
Schools (NCES district)
- District
- San Francisco Unified
- NCES district ID
- 0634410
- Math proficiency
- 50% ▬ 0.00%
- Reading proficiency
- 56% ▲ 1.00%
- Median HH income
- $81,249
- Composite
- 50.14/100
- National rank
- #4088
- State rank
- #322 of 1400 in CA
Livability — San Francisco
- Score
- 76/100
- State rank
- #90
- US rank
- #3143
Category grades
Schools grade is shown separately in the Schools card above.
Census & demographics
- Census place
- San Francisco, CA
- County
- San Francisco County · 827,552 people
- City population
- 827,552
- Metro
- San Francisco-Oakland-Berkeley, CA
- Population (ZIP)
- 34,964
- Household income
- $116,438
- Rent vs Own
- Severe rent burden
- 2666.0
Population outlook (San Francisco County) Hauer SSP2
- Today (2025)
- 1,030,936 people
- By 2030
- 1,110,409 · +7.7%
- By 2040
- 1,270,010 · +23.2%
- By 2050
- 1,435,001 · +39.2%
- By 2075
- 1,779,074 · +72.6%
- By 2100
- 1,966,767 · +90.8%
Race, ethnicity, and origin ACS 2023
- Neighborhood character
- Highly diverse neighborhood (Simpson 0.75)
- Race & ethnicity
- White 32% Asian 31% Hispanic / Latino 20% Two or more races 11% Black 10% Native American 2%
- Hispanic origin (detail)
- Mexican 11%
- Common ancestry
- Lithuanian 2% Slovak 2% Romanian 2%
- Foreign-born
- 36% · Canada, China, Vietnam
- Languages at home
- 56% English-only · Spanish 16% Chinese 9% Tagalog/Filipino 6%
Political lean MEDSL · San Francisco
- 2024 margin
- Solid D (+64.8) · D 80.3% · R 15.5% · Other 4.1%
- 2008→2024 swing
- -5.7pp toward R · 2008: 70.5pp · 2024: 64.8pp
- All cycles
- 2024: D+64.8 2020: D+72.5 2016: D+76.1 2012: D+70.2 2008: D+70.5
Not yet ingested
- Civics
- —
Market trends
- HPI YoY
- ▲ 4.96%
- Current HPI
- 175.4945
- Rent YoY
- ▲ 15.50%
- Metro
- San Francisco-Oakland-Berkeley, CA
- State GDP YoY
- ▲ 3.21%
- F500 in state
- 116
Industry mix (Fortune 500 HQ in CA)
| Industry | F500 HQs | Revenue |
|---|---|---|
| Technology | 27 | $1,492B |
|
||
| Financial Services | 3 | $174B |
|
||
| Retail | 3 | $44B |
|
||
| Insurance | 3 | $26B |
|
||
| Media / Entertainment | 2 | $115B |
|
||
| Pharmaceuticals / Biotech | 2 | $62B |
|
||
Price history
+42.6% since first listed10 events — show timeline
- 2026-05-17 Price Changed $2,495 SHOWMOJO
- 2026-05-11 Listed for Rent $2,595 SHOWMOJO
- 2026-05-01 Rental Removed $2,695 SHOWMOJO
- 2026-04-20 Price Changed $4,498,000 San Francisco MLS
- 2026-04-01 Listed for Rent $2,695 SHOWMOJO
- 2026-03-31 Rental Removed $2,495 SHOWMOJO
- 2026-03-05 Listed for Rent $2,495 SHOWMOJO
- 2026-02-13 Listed $4,895,000 San Francisco MLS
- 2023-08-14 Rental Removed $1,750 APPFOLIO
- 2023-07-30 Price Changed $1,750 APPFOLIO
Property tax history
+9.8%/yrLatest (2025): $71,375 · +3.0% YoY. Source: county tax records.
Cash-flow waterfall
monthlySold comps — $/sqft
last 12 mo · ≤1 miLoading sold comps…