 🔨 Auction
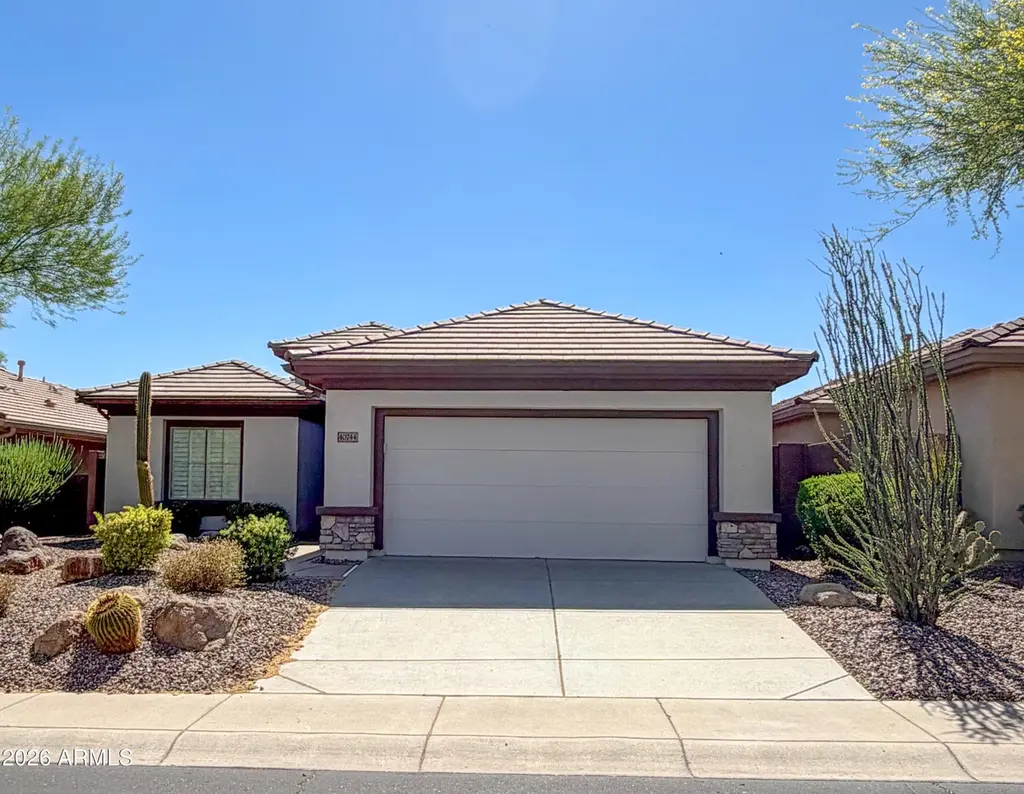
40744 N Noble Hawk Ct · Anthem, AZ
Flood risk 1/10 · Minimal
- FEMA flood zone
- X (shaded)
- Chance of flooding over 30 yrs
- 0.0%
- Est. flood insurance / yr
- $507 – $1,088
Fire risk 5/10 · Moderate
- Est. fire insurance / yr
- $610 – $1,132
Heat risk 8/10 · Major
- Hot days now (above 110°F)
- 6 days/yr
- Hot days in 30 yrs
- 15 days/yr
Wind risk 1/10 · Minimal
- Chance of severe wind over 30 yrs
- —
Air-quality risk 3/10 · Minor
- Unhealthy air days now
- 2 days/yr
- Unhealthy air days in 30 yrs
- 3 days/yr
Risk factors via First Street. Map © Google.
Why this score? — see what drove the F grade
The composite is a weighted blend of 9 inputs, each scored 0–100. Each bar is that input's sub-score; the figure is the points it added to the 100-point composite (weight × sub-score).
- ARV discount +7.5/15.0
- Schools +4.7/10.0
- Condition / age +3.8/5.0
- Cash flow +3.5/30.0
- Livability +3.2/5.0
- Rent growth +2.9/5.0
- 1% rule +1.3/10.0
- DSCR +0.0/10.0
- Appreciation +0.0/10.0
$1
🖨 Deal sheet 📄 Offer letter ✓ Due diligence
Listing remarks
The list price is not indicative of seller's final reserve amount. This property is part of an online bidding event. Inspections of this property and contact with occupants are strictly prohibited. Property is sold ''as is'' and no for sale sign allowed.
Key facts
- 5,750 sq ft lot
- 2 garage spots
- Community pool
Property features AI
Finance
- Other: Association fees include grounds and street maintenance
- HOA & community: HOA with quarterly and monthly fees (association maintains grounds and streets); No visible trucks/trailers/RVs/boats allowed; Community amenities include gated & guarded entry, pool, community spa (heated), golf, pickleball courts, tennis courts, playground, biking/walking paths, and fitness center
Exterior
- Parking: Attached garage with direct access; Garage door opener; Extended-length garage; Attached garage cabinets; 2 covered parking spaces (2-car garage)
- Security: Fire sprinkler system; Guarded entry / security guard
- Utilities: Private sewer; Private water company
- Home design: Single-family residence; Fee simple ownership
- Construction: Built with stucco and wood frame; Tile roof; Painted exterior
- Exterior features: Stucco and painted wood-frame construction; Tile roof; Block and wrought-iron fencing; Sprinklers front and rear with auto timers; Desert front and back landscaping; On golf course; Cul-de-sac lot; Private maintained road; Mountain views
Interior
- Kitchen: Kitchen island; Pantry; Breakfast bar; Granite counters
- Bedrooms: Up to 3 bedrooms
- Flooring: Tile flooring
- Bathrooms: 2 full bathrooms
- Heating & cooling: Natural gas heating; Central air conditioning; Ceiling fans
- Interior features: High-speed internet; Granite counters; Double vanity in bath; Breakfast bar; No interior steps; Kitchen island; Pantry; Primary suite with full bath; Separate shower and tub; Solar screens on windows; Dual-pane windows; Hard/low nap floors
- Laundry & utility: Laundry room inside
Neighborhood map
What this means for you Summary
Snapshot
- This is a 3-bed/3.0-bath single-family listed at $1. Condition is rated good.
Deal economics
- At list price, monthly cash flow is $-2k ($-19k/yr) — negative.
- The deal already cash-flows at list — no discount required.
- Meets the 1% rule at list price ($3k rent vs $1).
- Cap rate 2.7% vs local median 3.7% in Anthem — below-typical yield; the buyer is paying a premium for something (appreciation thesis, condition, location) that the cap rate doesn't capture.
Location & tenants
- Location reads 64/100 on livability (#98 in AZ) — a middle-class / working-renter tenant base. Strengths: employment A+, housing A+, crime A; Watch: amenities F, commute F, cost of living F.
- Deer Valley Unified District (4246) (urban): math 50% / reading 55% proficiency, ranked #33 of 249 in AZ (top 13%) — acceptable for families but not a draw, mixed tenant base, ~2y average lease.
- Zoned schools: Gavilan Peak School (math 54% / reading 59%, grade C+, #191 of 1,109 statewide, top 18%, 565 students, 13% FRL); Boulder Creek High School (math 45% / reading 48%, grade D-, #55 of 381 statewide, top 14%, 2,375 students, 13% FRL).
- Market conditions: Rents rising (+1.6%/yr); 381 active listings in the ZIP; 33 comparable units currently listed for rent nearby; rentals at typical pace (median 24d on market — plan ~3-4 weeks tenant-placement turnaround); high-income renter base; 36,011 units permitted in Maricopa County in 2024 (12,801 in 5+ unit buildings).
- This rent runs 32% of the median local income ($122k/yr) — at the standard rent-burdened threshold; future hikes will face affordability resistance.
Forward outlook
- Local home prices are declining (-3.0%/yr); year-one equity from $4k of loan paydown is wiped out by about $16k of value loss. Plan a longer hold.
- Maricopa County population projected at +38% by 2050 — long-run rental-demand tailwind backs the buy-and-hold thesis.
Negotiation context
- It's been on market 26 days — a 2% lower offer ($0) is reasonable based on typical stale-listing flexibility.
- 8 sale attempts since 22y ago with the ask held roughly flat each time — persistent listings suggest the price (not the market) is what's stuck; bring a comps-based counter.
Risks & watch-outs
- Watch-outs: property tax is 782925.0% of price.
- Climate carrying-cost: moderate wildfire risk; extreme-heat days projected 6→15/yr by 2055 (HVAC capex compounding) — expect insurance premiums to compound above CPI over the hold.
Questions for the listing agent
- What do current leases actually rent for vs. the listed asking? Can we see a recent rent roll and the last 12 months of T-12 income?
- Property tax is high relative to price — has the assessment been appealed recently, and will the sale trigger a re-assessment?
- What does the HOA fee cover, when was the last increase, and are there any pending special assessments or reserve-fund shortfalls?
- Is there a deadline driving the sale (1031 exchange, divorce, estate, relocation)? That informs how much negotiation room exists.
- Schools are A-rated — typically a magnet for longer-tenancy family renters. What's the average tenant stay here, and is there a school-zone premium baked into asking?
- The area grade is low — what's the realistic commute time and amenity access for the typical tenant pool here? Any planned neighborhood developments (good or bad) we should know about?
- What's the average days-on-market for RENTAL listings here right now (not sales)? A rising rental-DOM trend means longer vacancies and softer asking-rent achievability than the comps imply.
- What's the recent tenant-quality profile in this submarket — average credit score on applications, eviction rate, late-payment / NSF rate, and stable-employment percentage? A property-management company in the area should have these aggregated.
- How much new for-sale + rental construction is in the pipeline within 1–3 miles? Heavy new supply typically softens prices + rents 12–24 months out; constrained supply supports both.
Investment metrics
- 1% rule
- 0.63% ✗
- Cap rate
- 2.69%
- Cash-on-cash
- -12.87%
- DSCR
- 0.43
- GRM
- 13.3
CMA / ARV
- ARV (on-the-fly)
- $521,950
- Comps found
- 12
Show comp detail 12 sales within ~0.75 mi
| Address | Dist | Beds/Ba | Sqft | Sold | Price | $/sf | Match |
|---|---|---|---|---|---|---|---|
| 1788 W Dion Dr | 0.23mi | 3/2.0 | 1,970 (+4%) | 2mo | $688,000 | $349 | 78 |
| 1870 W Dion Dr | 0.14mi | 3/2.0 | 2,080 (+10%) | 2mo | $692,000 | $333 | 72 |
| 1704 W Dion Dr | 0.36mi | 3/3.0 | 2,041 (+8%) | 1mo | $600,000 | $294 | 70 |
| 1821 W Kuralt Dr | 0.61mi | 4/2.5 (+1) | 1,965 (+4%) | 2mo | $525,000 | $267 | 57 |
| 41017 N Prestancia Dr | 0.51mi | 4/2.0 (+1) | 2,082 (+10%) | 1mo | $649,999 | $312 | 50 |
| 2335 W Muirfield Dr | 0.67mi | 2/2.0 (-1) | 2,039 (+7%) | 1mo | $499,500 | $245 | 46 |
| 2030 W Clearview Trl | 0.55mi | 4/2.0 (+1) | 2,143 (+13%) | 2mo | $492,500 | $230 | 42 |
| 2413 W Lewis And Clark Trl | 0.66mi | 3/2.0 | 1,638 (-14%) | 1mo | $387,030 | $236 | 41 |
| 41333 N Belfair Way | 0.50mi | 2/2.0 (-1) | 1,616 (-15%) | 2mo | $472,500 | $292 | 41 |
| 2517 W Morse Dr | 0.75mi | 4/3.0 (+1) | 2,120 (+12%) | 0mo | $576,000 | $272 | 40 |
| 2452 W Warren Dr | 0.74mi | 3/2.0 | 1,638 (-14%) | 2mo | $450,500 | $275 | 37 |
| 2419 W Warren Dr | 0.71mi | 4/2.5 (+1) | 2,168 (+14%) | 1mo | $452,000 | $208 | 35 |
Match score weights: distance 35% · size 25% · config 20% · recency 20%. Top-matched comps best support the ARV.
Projected returns pro-forma
-3.0% appreciation · 1.62% rent growth · sell at horizon
- IRR
- -42.0%
- Equity multiple
- -0.29×
- Total profit
- $-188,499
- Equity at exit
- $77,824
- IRR
- -82.7%
- Equity multiple
- -1.11×
- Total profit
- $-309,029
- Equity at exit
- $45,129
Cash invested: $146,146 (down + closing). Projections, not guarantees.
Landlord ↔ Tenant lean methodology
- Overall (STATE)
- 87 Strongly Landlord-Friendly
- State Arizona
- 87 Strongly Landlord-Friendly · R+3
- County
- — inherits STATE
- City
- — inherits STATE
ZIP-level market 85086
- Home prices YoY
- -27.8%
- Rents YoY
- 1.6%
- Active inventory
- 381
Monthly cashflow live
- Estimated rent
- $3,282 high interval (Pro) →
- Mortgage (P&I)
- −$2,737
- Tax est. 1.5%
- −$652 /mo · $7,829/yr
- Insurance
- −$217
- HOA
- −$553
- Vacancy / Maint / Mgmt
- −$689
- Net cashflow
- $-1,567
Break-even live
UW: 25.0% down · 7.5% · 30yr · 1.5% tax · 5.0% vac · 8.0% maint · 8.0% mgmt
Financing live
Cash to close
- Down payment
- $130,488
- Closing costs
- $15,658
- Reserves months
- —
- Total cash needed
- —
Loan-product check · same deal, 3 products live
Conventional
25% down · 7.5% · 30yr
- Down + closing
- —
- Monthly P&I
- —
- Monthly cashflow
- —
- DSCR
- —
- Eligible?
- —
Personal DTI + credit; lowest rate.
DSCR
20% down · 8.5% · 30yr
- Down + closing
- —
- Monthly P&I
- —
- Monthly cashflow
- —
- DSCR
- —
- Eligible?
- —
No personal income docs; deal must DSCR.
Hard money
10% down · 12.0% · 12mo
- Down + closing
- —
- Monthly P&I
- —
- Monthly cashflow
- —
- DSCR
- —
- Eligible?
- —
Short-term bridge; refi at stabilization.
Rent comps 33 comps
| Address | Beds | Baths | Sqft | Rent | $/sqft | DOM | Units | Dist |
|---|---|---|---|---|---|---|---|---|
| 1891 W Dion Dr Phoenix, AZ | 2.0 | 2.0 | 1510 | $3,500 | $2.32 | 43d | 1 | 0.10mi |
| 1916 W Spirit Ct Anthem, AZ | 2.0 | 2.0 | 1759 | $4,000 | $2.27 | 43d | 1 | 0.11mi |
| 1788 W Dion Dr Phoenix, AZ | 3.0 | 2.0 | 1912 | $3,300 | $1.73 | 24d | 1 | 0.23mi |
| 1776 W Owens Way Anthem, AZ | 3.0 | 2.0 | 1454 | $3,500 | $2.41 | 43d | 1 | 0.37mi |
| 1653 W Ainsworth Dr Phoenix, AZ | 3.0 | 2.5 | 2391 | $4,000 | $1.67 | 24d | 1 | 0.38mi |
| 1726 W Medinah Ct Anthem, AZ | 2.0 | 2.0 | 1760 | $4,700 | $2.67 | 43d | 1 | 0.42mi |
| 40309 N Bell Meadow Trl Phoenix, AZ | 3.0 | 2.0 | 1490 | $3,500 | $2.35 | 20d | 1 | 0.43mi |
| 40838 N Prestancia Ct Phoenix, AZ | 3.0 | 2.0 | 2082 | $4,500 | $2.16 | 43d | 1 | 0.44mi |
| 1702 W Owens Way Anthem, AZ | 3.0 | 2.0 | 1264 | $2,400 | $1.90 | 18d | 1 | 0.44mi |
| 40130 N Thunder Hills Ct Phoenix, AZ | 3.0 | 2.0 | 1300 | $2,200 | $1.69 | 5d | 1 | 0.46mi |
| 40291 N La Cantera Dr Phoenix, AZ | 3.0 | 2.0 | 1454 | $2,195 | $1.51 | 20d | 1 | 0.46mi |
| 1537 W Spirit Dr Anthem, AZ | 3.0 | 2.5 | 2544 | $4,450 | $1.75 | 43d | 1 | 0.49mi |
| 41112 N Prestancia Dr Phoenix, AZ | 3.0 | 2.0 | 2082 | $5,000 | $2.40 | 43d | 1 | 0.51mi |
| 41520 N River Bend Ct Phoenix, AZ | 2.0 | 2.0 | 1728 | $3,850 | $2.23 | 24d | 1 | 0.51mi |
| 1836 W Kuralt Dr Anthem, AZ | 3.0 | 2.0 | 1432 | $2,199 | $1.54 | 12d | 1 | 0.60mi |
| 40936 N Citrus Canyon Trl Phoenix, AZ | 3.0 | 2.0 | 1431 | $2,100 | $1.47 | 43d | 1 | 0.66mi |
| 2106 W Hemingway Ct Phoenix, AZ | 4.0 | 3.0 | 2120 | $2,800 | $1.32 | 43d | 1 | 0.68mi |
| 39807 N Belfair Way Anthem, AZ | 3.0 | 2.0 | 2136 | $8,000 | $3.75 | 2d | 1 | 0.69mi |
| 2517 W Memorial Dr Phoenix, AZ | 4.0 | 4.0 | 1827 | $2,150 | $1.18 | 3d | 1 | 0.70mi |
| 2517 W Memorial Dr Phoenix, AZ | 4.0 | 2.0 | 1827 | $2,150 | $1.18 | 7d | 1 | 0.70mi |
| 39560 N Prairie Ln Anthem, AZ | 4.0 | 2.0 | 1827 | $2,445 | $1.34 | 4d | 1 | 0.79mi |
| 2023 W Shackleton Dr Phoenix, AZ | 4.0 | 2.5 | 2575 | $2,670 | $1.04 | 12d | 1 | 0.80mi |
| 2462 W Turtle Hill Dr Anthem, AZ | 2.0 | 2.0 | 1400 | $5,000 | $3.57 | 43d | 1 | 0.81mi |
| 2423 W Shadow Glen Ct Anthem, AZ | 2.0 | 2.0 | 1344 | $3,990 | $2.97 | 43d | 1 | 0.84mi |
| 2499 W Lewis and Clark Trl Phoenix, AZ | 4.0 | 2.0 | 1827 | $2,340 | $1.28 | 24d | 1 | 0.85mi |
| 2501 W Myopia Dr Unit 1546125P Anthem, AZ | 2.0 | 2.0 | 1485 | $2,419 | $1.63 | 15d | 1 | 0.89mi |
| 41831 N Mill Creek Way Anthem, AZ | 3.0 | 2.0 | 1741 | $2,400 | $1.38 | 21d | 1 | 0.95mi |
| 2579 W Lewis and Clark Trl Phoenix, AZ | 3.0 | 2.0 | 1230 | $2,450 | $1.99 | 24d | 1 | 0.95mi |
| 41708 N Cross Timbers Trl Unit 1545666P Anthem, AZ | 3.0 | 2.0 | 2249 | $2,993 | $1.33 | 16d | 1 | 1.08mi |
| 39746 N Cross Timbers Way Anthem, AZ | 3.0 | 2.0 | 1230 | $2,050 | $1.67 | 20d | 1 | 1.19mi |
| 2902 W Haley Dr Anthem, AZ | 4.0 | 3.0 | 2347 | $3,200 | $1.36 | 3d | 1 | 1.22mi |
| 41410 N Fairgreen Way Anthem, AZ | 2.0 | 2.0 | 1344 | $4,000 | $2.98 | 43d | 1 | 1.37mi |
| 41418 N Clear Crossing Rd Anthem, AZ | 2.0 | 2.0 | 2039 | $3,250 | $1.59 | 43d | 1 | 1.44mi |
HOA detail
- Monthly dues
- $553 · $6,636/yr
Listing history 41 events
-
2026-06-17status $1 Pending 26 DOM
-
2026-06-17days on market $1 Active 26 DOM
-
2026-06-16days on market $1 Active 25 DOM
-
2026-06-15days on market $1 Active 24 DOM
-
2026-06-13days on market $1 Active 22 DOM
-
2026-06-13days on market $1 Active 21 DOM
-
2026-06-09days on market $1 Active 18 DOM
-
2026-06-08days on market $1 Active 17 DOM
-
2026-06-07days on market $1 Active 16 DOM
-
2026-06-04days on market $1 Active 13 DOM
-
2026-06-03days on market $1 Active 12 DOM
-
2026-06-02days on market $1 Active 11 DOM
-
2026-06-01days on market $1 Active 10 DOM
-
2026-05-31days on market $1 Active 9 DOM
-
2026-05-19$1 Active
-
2025-12-09historical
-
2025-09-08$650,000 Active
-
2025-07-22historical
-
2025-05-08$660,000 Active
-
2023-01-31soldstatus $605,000
-
2023-01-31soldstatus $605,000 Closed
-
2022-12-31status Pending
-
2022-12-22historical Under Contract Accepting Backups
-
2022-11-26price $619,000
-
2022-11-26status Active
-
2022-11-19historical Under Contract Accepting Backups
-
2022-08-26$629,900 Active
-
2015-09-15soldstatus $310,000 Closed
-
2015-09-15soldstatus $310,000
-
2015-08-15status Pending
-
2015-08-07price $329,900
-
2015-07-21price $339,900
-
2015-07-06$349,900 Active
-
2011-06-13soldstatus $257,000 Closed
-
2011-06-13soldstatus $257,000
-
2011-05-10status Pending
-
2011-05-06$265,000 Active
-
2004-06-10soldstatus $329,800
-
2004-05-17soldstatus $329,800
-
2004-04-05historical
-
2004-03-24$329,800
ⓘ Source: listings_history table (triggers on properties + properties_extension) + one-shot
backfill from property_details.listing_events for pre-trigger history.
Climate risk First Street
- Flood 1/10 Low FEMA zone X (shaded) · 0% chance over 30 yrs
- Wildfire 5/10 Major
- Heat 8/10 Severe 6 d/yr ≥110°F today · 15 d/yr by 30 yrs out
- Wind 1/10 Low
- Air quality 3/10 Moderate 2 unhealthy d/yr today · 3 by 30 yrs out
Nearby sold comps map
Loading sold comps map…
Walkable amenities ~0.75 mi
Loading nearby amenities…
Taxation est. · year 1
- Rental income
- $39,386
- − Mortgage interest
- −$29,237
- − Property taxes
- −$7,829
- − Insurance
- −$2,610
- − Repairs & maintenance
- −$3,151
- − Management
- −$3,151
- − HOA
- −$6,636
- − Depreciation
- −$15,184
- Taxable loss
- −$28,412
- Est. tax savings @ 24.0%
- +$6,819
- After-tax cash flow
- $-11,987/yr
For passive investors: Depreciation is non-cash, so a rental often shows a tax loss while cash-flowing — sheltering income. Rental losses are passive: they offset passive income freely, and up to $25,000/yr can offset ordinary (W-2) income if you actively participate and your MAGI is under $100k (phasing out to $0 by $150k); unused losses carry forward. On sale, claimed depreciation is recaptured at up to 25%, and gains may owe capital-gains tax (a 1031 exchange can defer both). Figures are a year-1 estimate at your 24.0% rate — not tax advice; consult a CPA.
Condition & rehab AI · 2 photos
This single-family home is in good condition with a well-maintained exterior and interior. It has potential for minor cosmetic improvements to enhance its resale and rental value.
Value-add opportunities
- Both Painting the exterior — Fresh paint can enhance curb appeal and property value.
- Both Landscaping improvements — Enhanced landscaping can improve curb appeal and attract more potential buyers/tenants.
- Both Interior touch-ups — Fresh paint and minor touch-ups can make the interior more inviting and appealing to potential buyers/tenants.
Renovation cost estimate screening
Value-add ROI direction
- Both Painting the exterior — Fresh paint can enhance curb appeal and property value. ↑
- Both Landscaping improvements — Enhanced landscaping can improve curb appeal and attract more potential buyers/tenants. ↑
- Both Interior touch-ups — Fresh paint and minor touch-ups can make the interior more inviting and appealing to potential buyers/tenants. ↑
ⓘ Cost ranges are severity-bucket heuristics (US national rule-of-thumb). Get contractor quotes + a written scope before underwriting a rehab budget.
Schools (NCES district)
- District
- Deer Valley Unified District (4246)
- NCES district ID
- 0407750
- Math proficiency
- 50% ▼ -9.00%
- Reading proficiency
- 55% ▼ -6.00%
- Median HH income
- $72,516
- Composite
- 47.0/100
- National rank
- #2346
- State rank
- #33 of 249 in AZ
Livability — Anthem
- Score
- 64/100
- State rank
- #98
- US rank
- #14158
Category grades
Schools grade is shown separately in the Schools card above.
Census & demographics
- Census place
- Anthem, AZ
- County
- Maricopa County · 4,537,380 people
- City population
- 43,270
- Metro
- Phoenix-Mesa-Chandler, AZ
- Population (ZIP)
- 43,270
- Household income
- $121,676
- Rent vs Own
- Severe rent burden
- 724.0
Population outlook (Maricopa County) Hauer SSP2
- Today (2025)
- 4,979,203 people
- By 2030
- 5,378,229 · +8.0%
- By 2040
- 6,156,598 · +23.6%
- By 2050
- 6,872,376 · +38.0%
- By 2075
- 8,401,270 · +68.7%
- By 2100
- 9,247,439 · +85.7%
Race, ethnicity, and origin ACS 2023
- Neighborhood character
- Predominantly White (81%)
- Race & ethnicity
- White 81% Hispanic / Latino 11% Two or more races 6% Asian 2% Black 2%
- Hispanic origin (detail)
- Mexican 7%
- Common ancestry
- Portuguese 4% Romanian 4% Slovak 3%
- Foreign-born
- 6% · Canada, China, Vietnam
- Languages at home
- 92% English-only · Spanish 4% Vietnamese 1% Other Indo-European 1%
Political lean MEDSL · Maricopa
- 2024 margin
- Toss-up / Even · D 47.7% · R 51.2% · Other 1.1%
- 2008→2024 swing
- +7.1pp toward D · 2008: -10.6pp · 2024: -3.5pp
- All cycles
- 2024: R+3.5 2020: D+2.2 2016: R+3.5 2012: R+12.0 2008: R+10.6
Not yet ingested
- Civics
- —
Market trends
- HPI YoY
- ▼ -117.19%
- Current HPI
- 305.1539
- Rent YoY
- ▲ 1.62%
- Metro
- Phoenix-Mesa-Chandler, AZ
- State GDP YoY
- ▲ 4.54%
- F500 in state
- 20
Industry mix (Fortune 500 HQ in AZ)
| Industry | F500 HQs | Revenue |
|---|---|---|
| Technology | 2 | $13B |
|
||
| Mining / Metals | 1 | $23B |
|
||
| Environmental Services | 1 | $16B |
|
||
| Metals / Steel | 1 | $14B |
|
||
| Technology Distribution | 1 | $9B |
|
||
| Homebuilding | 1 | $8B |
|
||
Price history
+97.1% since first listed27 events — show timeline
- 2026-05-19 Listed $1 ARMLS
- 2025-12-09 Listing Removed — ARMLS
- 2025-09-08 Listed $650,000 ARMLS
- 2025-07-22 Listing Removed — ARMLS
- 2025-05-08 Listed $660,000 ARMLS
- 2023-01-31 Sold (Public Records) $605,000 Public Records
- 2023-01-31 Sold (MLS) $605,000 ARMLS
- 2022-12-31 Pending — ARMLS
- 2022-12-22 Contingent — ARMLS
- 2022-11-26 Price Changed $619,000 ARMLS
- 2022-11-26 Relisted — ARMLS
- 2022-11-19 Contingent — ARMLS
- 2022-08-26 Listed $629,900 ARMLS
- 2015-09-15 Sold (Public Records) $310,000 Public Records
- 2015-09-15 Sold (MLS) $310,000 ARMLS
- 2015-08-15 Pending — ARMLS
- 2015-08-07 Price Changed $329,900 ARMLS
- 2015-07-21 Price Changed $339,900 ARMLS
- 2015-07-06 Listed $349,900 ARMLS
- 2011-06-13 Sold (Public Records) $257,000 Public Records
- 2011-06-13 Sold (MLS) $257,000 ARMLS
- 2011-05-10 Pending — ARMLS
- 2011-05-06 Listed $265,000 ARMLS
- 2004-06-10 Sold (Public Records) $329,800 Public Records
- 2004-05-17 Sold (MLS) $329,800 ARMLS
- 2004-04-05 Listing Removed — ARMLS
- 2004-03-24 Listed $329,800 ARMLS
Property tax history
+1.8%/yrLatest (2025): $2,842 · -10.1% YoY. Source: county tax records.
Cash-flow waterfall
monthlySold comps — $/sqft
last 12 mo · ≤1 miLoading sold comps…