3 Hillberry Cir · Holtsville, NY
Flood risk 1/10 · Minimal
- FEMA flood zone
- X (unshaded)
- Chance of flooding over 30 yrs
- 0.0%
- Est. flood insurance / yr
- $507 – $1,088
Fire risk 1/10 · Minimal
- Est. fire insurance / yr
- $691 – $1,283
Heat risk 5/10 · Moderate
- Hot days now (above 94°F)
- 7 days/yr
- Hot days in 30 yrs
- 17 days/yr
Wind risk 6/10 · Moderate
- Chance of severe wind over 30 yrs
- 77.0%
Air-quality risk 4/10 · Minor
- Unhealthy air days now
- 4 days/yr
- Unhealthy air days in 30 yrs
- 6 days/yr
Risk factors via First Street. Map © Google.
Why this score? — see what drove the D grade
The composite is a weighted blend of 9 inputs, each scored 0–100. Each bar is that input's sub-score; the figure is the points it added to the 100-point composite (weight × sub-score).
- ARV discount +15.0/15.0
- Schools +6.6/10.0
- Cash flow +6.5/30.0
- Rent growth +4.3/5.0
- Livability +3.6/5.0
- Condition / age +2.5/5.0
- 1% rule +1.8/10.0
- DSCR +0.8/10.0
- Appreciation +0.0/10.0
$545,000
🖨 Deal sheet (PDF) 📄 Offer letter ✓ Due diligence
Listing remarks MLS
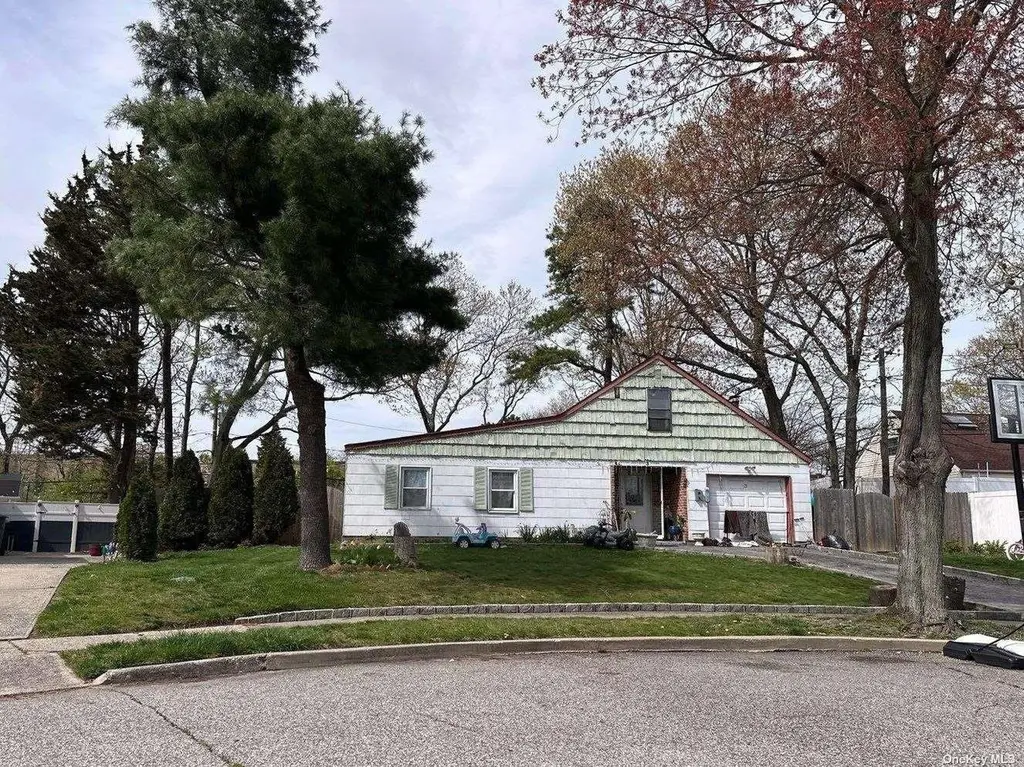
This Farm Ranch Style Home Features 3 Bedrooms, Full Bath, Formal Dining Room, Eat In Kitchen & 1 Car Garage. The information provided is estimated to the best of our abilities at this time.
Key facts
- Formal dining room
- Eat in kitchen
- 0.25 acre lot
Tags
Neighborhood map
What this means for you Summary
Snapshot
- This is a 3-bed/1.0-bath single-family listed at $545k.
Deal economics
- At list price, monthly cash flow is $-917 ($-11k/yr) — negative.
- To cash-flow at today's rent, offer at most $383k (29.7% below list).
- To meet the 1% rule (rent ≥ 1% of price), the offer needs to be $368k (32.5% below list).
- Recommended offer: $368k (32.5% below list) — sets the bar for 1% rule.
- Cap rate 4.3% vs local median 3.5% in Holtsville — meaningfully above typical; check what's discounted (condition, days-on-market, listing class) to confirm the premium yield is real.
Location & tenants
- Location reads 71/100 on livability (#414 in NY) — a middle-class / working-renter tenant base. Strengths: employment A+, housing A+, health & safety B; Watch: amenities F, commute F, cost of living F.
- Sachem Central School District (suburban): math 69% / reading 76% proficiency, ranked #86 of 590 in NY (top 15%) — strong family-tenant draw, lease renewals of 3-5y typical; only 15% free/reduced lunch — higher-income household profile.
- Zoned schools: Nokomis School (math 47% / reading 57%, grade C-, #988 of 2,108 statewide, top 49%, 527 students, 31% FRL); Seneca Middle School (math 62% / reading 62%, grade B+, #136 of 729 statewide, top 20%, 973 students, 22% FRL); Sachem High School North (math 96% / reading 95%, grade A+, #76 of 1,100 statewide, top 7%, 1,923 students, 25% FRL).
- Market conditions: Rents rising fast (+7.3%/yr); 95 active listings in the ZIP; 1 comparable units currently listed for rent nearby; high-income renter base; 1,366 units permitted in Suffolk County in 2024 (216 in 5+ unit buildings).
- This rent runs 31% of the median local income ($144k/yr) — at the standard rent-burdened threshold; future hikes will face affordability resistance.
Forward outlook
- Local home prices are declining (-3.0%/yr); year-one equity from $4k of loan paydown is wiped out by about $16k of value loss. Plan a longer hold.
- Suffolk County population projected to shrink 5% by 2050 — rents likely to lag national; underwrite the cash flow, not the appreciation.
Negotiation context
- It's been on market 744 days — a 12% lower offer ($480k) is reasonable based on typical stale-listing flexibility.
- 6 sale attempts since 11y ago; this cycle's ask is 9% above the opening price — seller raised mid-cycle; expect resistance to lowballs.
- Current owner paid $84k; list at $545k implies a 553% gain — meaningful room to come down on a strong offer.
Risks & watch-outs
- Climate carrying-cost: major wind risk, 77% chance of damaging wind over 30y; extreme-heat days projected 7→17/yr by 2055 (HVAC capex compounding) — expect insurance premiums to compound above CPI over the hold.
Questions for the listing agent
- What do current leases actually rent for vs. the listed asking? Can we see a recent rent roll and the last 12 months of T-12 income?
- It's been on market 744 days. Have you received any prior offers? Is the seller open to a 32% concession, seller financing, or rate buy-down credit?
- Built in 1966 — when were the roof, HVAC, electrical panel, plumbing, and water heater last replaced?
- Why hasn't it sold? Are there any deal-killer items the seller is aware of (foundation, flood, title, zoning, code violations)?
- Is there a deadline driving the sale (1031 exchange, divorce, estate, relocation)? That informs how much negotiation room exists.
- The area grade is low — what's the realistic commute time and amenity access for the typical tenant pool here? Any planned neighborhood developments (good or bad) we should know about?
- What's the average days-on-market for RENTAL listings here right now (not sales)? A rising rental-DOM trend means longer vacancies and softer asking-rent achievability than the comps imply.
- What's the recent tenant-quality profile in this submarket — average credit score on applications, eviction rate, late-payment / NSF rate, and stable-employment percentage? A property-management company in the area should have these aggregated.
- How much new for-sale + rental construction is in the pipeline within 1–3 miles? Heavy new supply typically softens prices + rents 12–24 months out; constrained supply supports both.
Investment metrics
- 1% rule
- 0.68% ✗
- Cap rate
- 4.27%
- Cash-on-cash
- -7.21%
- DSCR
- 0.68
- GRM
- 12.3
CMA / ARV
- ARV (median comp)
- $654,822
- List price
- $545,000
- Delta
- -16.77%
- Verdict
- UNDERPRICED
- Comps
- 20 within 1.0 mi
Show comp detail 12 sales within ~0.75 mi
| Address | Dist | Beds/Ba | Sqft | Sold | Price | $/sf | Match |
|---|---|---|---|---|---|---|---|
| 24 Avenue A | 0.17mi | 2/1.0 (-1) | 1,570 (-13%) | 2mo | $465,000 | $296 | 64 |
| 22 Avenue D | 0.62mi | 3/1.5 | 1,800 (0%) | 18mo | $615,000 | $342 | 54 |
| 110 Geery Ave | 0.61mi | 4/2.5 (+1) | 1,800 (0%) | 10mo | $750,000 | $417 | 52 |
| 149 Avenue C | 0.64mi | 4/1.5 (+1) | 1,703 (-5%) | 4mo | $610,000 | $358 | 51 |
| 1663 Claas Ave | 0.64mi | 4/2.0 (+1) | 1,698 (-6%) | 3mo | $735,000 | $433 | 49 |
| 2 Alan St | 0.69mi | 4/2.0 (+1) | 1,852 (+3%) | 6mo | $695,000 | $375 | 49 |
| 10 Elan Ln | 0.62mi | 4/3.0 (+1) | 1,848 (+3%) | 7mo | $745,000 | $403 | 48 |
| 100 Lexington Ave | 0.54mi | 4/2.5 (+1) | 1,971 (+10%) | 1mo | $735,000 | $373 | 47 |
| 142 Pond Rd | 0.68mi | 4/2.0 (+1) | 1,718 (-5%) | 14mo | $689,000 | $401 | 40 |
| 142 Smith Ave | 0.64mi | 4/2.0 (+1) | 1,729 (-4%) | 17mo | $610,000 | $353 | 40 |
| 7 All Points Ter | 0.70mi | 4/1.5 (+1) | 1,967 (+9%) | 16mo | $600,000 | $305 | 32 |
| 132 Smith Ave | 0.56mi | 4/3.0 (+1) | 1,600 (-11%) | 13mo | $580,000 | $363 | 31 |
Match score weights: distance 35% · size 25% · config 20% · recency 20%. Top-matched comps best support the ARV.
Projected returns pro-forma
-3.0% appreciation · 7.3% rent growth · sell at horizon
- IRR
- -24.1%
- Equity multiple
- 0.15×
- Total profit
- $-130,015
- Equity at exit
- $81,261
- IRR
- -10.4%
- Equity multiple
- 0.26×
- Total profit
- $-113,547
- Equity at exit
- $47,122
Cash invested: $152,600 (down + closing). Projections, not guarantees.
Landlord ↔ Tenant lean methodology
- Overall (STATE)
- 15 Strongly Tenant-Friendly
- State New York
- 15 Strongly Tenant-Friendly · D+10
- County
- — inherits STATE
- City
- — inherits STATE
ZIP-level market 11741
- Rents YoY
- 7.3%
- Active inventory
- 95
- Price-to-rent
- 12.3×
Monthly cashflow live
- Estimated rent
- $3,680 medium interval (Pro) →
- Mortgage (P&I)
- −$2,858
- Tax from tax record
- −$739 /mo · $8,874/yr
- Insurance
- −$227
- HOA
- −$0
- Vacancy / Maint / Mgmt
- −$773
- Net cashflow
- $-917
Break-even live
Sensitivity live
| Price | -10% $-609 | -5% $-763 | +0% $-917 | +5% $-1,071 | +10% $-1,226 |
|---|---|---|---|---|---|
| Rent | -10% $-1,208 | -5% $-1,062 | +0% $-917 | +5% $-772 | +10% $-626 |
| Rate | -1.0pp $-643 | -0.5pp $-778 | base $-917 | +0.5pp $-1,058 | +1.0pp $-1,202 |
UW: 25.0% down · 7.5% · 30yr · 1.5% tax · 5.0% vac · 8.0% maint · 8.0% mgmt
Financing live
Cash to close
- Down payment
- $136,250
- Closing costs
- $16,350
- Reserves months
- —
- Total cash needed
- —
Loan-product check · same deal, 3 products live
Conventional
25% down · 7.5% · 30yr
- Down + closing
- —
- Monthly P&I
- —
- Monthly cashflow
- —
- DSCR
- —
- Eligible?
- —
Personal DTI + credit; lowest rate.
DSCR
20% down · 8.5% · 30yr
- Down + closing
- —
- Monthly P&I
- —
- Monthly cashflow
- —
- DSCR
- —
- Eligible?
- —
No personal income docs; deal must DSCR.
Hard money
10% down · 12.0% · 12mo
- Down + closing
- —
- Monthly P&I
- —
- Monthly cashflow
- —
- DSCR
- —
- Eligible?
- —
Short-term bridge; refi at stabilization.
Rent comps 1 comps
| Address | Beds | Baths | Sqft | Rent | $/sqft | DOM | Units | Dist |
|---|---|---|---|---|---|---|---|---|
| 132 Fairfield Dr Holbrook, NY | 3.0 | 2.5 | 2200 | $4,200 | $1.91 | 26d | 1 | 0.97mi |
Listing history 29 events
-
2026-06-21days on market $545,000 Active 744 DOM
-
2026-06-18days on market $545,000 Active 741 DOM
-
2026-06-17days on market $545,000 Active 740 DOM
-
2026-06-16days on market $545,000 Active 739 DOM
-
2026-06-15days on market $545,000 Active 738 DOM
-
2026-06-13days on market $545,000 Active 736 DOM
-
2026-06-13days on market $545,000 Active 735 DOM
-
2026-06-09days on market $545,000 Active 732 DOM
-
2026-06-08days on market $545,000 Active 731 DOM
-
2026-06-07days on market $545,000 Active 730 DOM
-
2026-06-04days on market $545,000 Active 727 DOM
-
2026-06-03days on market $545,000 Active 726 DOM
-
2026-06-02days on market $545,000 Active 725 DOM
-
2026-06-01days on market $545,000 Active 724 DOM
-
2026-05-31days on market $545,000 Active 723 DOM
-
2026-05-19price $545,000 194-char remark
Show marketing remark (194 chars)
This Farm Ranch Style Home Features 3 Bedrooms, Full Bath, Formal Dining Room, Eat In Kitchen & 1 Car Garage. The information provided is estimated to the best of our abilities at this time.
-
2025-10-01status Active 194-char remark
Show marketing remark (194 chars)
This Farm Ranch Style Home Features 3 Bedrooms, Full Bath, Formal Dining Room, Eat In Kitchen & 1 Car Garage. The information provided is estimated to the best of our abilities at this time.
-
2025-10-01historical 194-char remark
Show marketing remark (194 chars)
This Farm Ranch Style Home Features 3 Bedrooms, Full Bath, Formal Dining Room, Eat In Kitchen & 1 Car Garage. The information provided is estimated to the best of our abilities at this time.
-
2024-10-07status Active 194-char remark
Show marketing remark (194 chars)
This Farm Ranch Style Home Features 3 Bedrooms, Full Bath, Formal Dining Room, Eat In Kitchen & 1 Car Garage. The information provided is estimated to the best of our abilities at this time.
-
2024-09-30historical 194-char remark
Show marketing remark (194 chars)
This Farm Ranch Style Home Features 3 Bedrooms, Full Bath, Formal Dining Room, Eat In Kitchen & 1 Car Garage. The information provided is estimated to the best of our abilities at this time.
-
2024-05-31$499,900 Active 194-char remark
Show marketing remark (194 chars)
This Farm Ranch Style Home Features 3 Bedrooms, Full Bath, Formal Dining Room, Eat In Kitchen & 1 Car Garage. The information provided is estimated to the best of our abilities at this time.
-
2018-02-08historical
-
2017-08-08price $210,000
-
2017-08-08status Back On Market
-
2016-10-04historical
-
2016-07-07$199,000 New
-
2015-12-11historical
-
2015-01-08$175,000
-
1989-10-05soldstatus $83,500
ⓘ Source: listings_history table (triggers on properties + properties_extension) + one-shot
backfill from property_details.listing_events for pre-trigger history.
Tax reassessment forecast NY · Partial reset (capped growth)
- Current annual tax
- $8,874 · $739/mo
- Projected year-2 tax
- $9,042 · $754/mo
- Expected delta
- +$168/yr (+$14/mo · 1.9%)
ⓘ Screening estimate from a state-policy table — verify with the county assessor before closing.
Climate risk First Street
- Flood 1/10 Low FEMA zone X (unshaded) · 0% chance over 30 yrs
- Wildfire 1/10 Low
- Heat 5/10 Major 7 d/yr ≥94°F today · 17 d/yr by 30 yrs out
- Wind 6/10 Major 77% chance of damaging wind over 30 yrs
- Air quality 4/10 Moderate 4 unhealthy d/yr today · 6 by 30 yrs out
Nearby sold comps map
Loading sold comps map…
Walkable amenities ~0.75 mi
Loading nearby amenities…
Taxation est. · year 1
- Rental income
- $44,166
- − Mortgage interest
- −$30,528
- − Property taxes
- −$8,874
- − Insurance
- −$2,725
- − Repairs & maintenance
- −$3,533
- − Management
- −$3,533
- − Depreciation
- −$15,855
- Taxable loss
- −$20,882
- Est. tax savings @ 24.0%
- +$5,012
- After-tax cash flow
- $-5,992/yr
For passive investors: Depreciation is non-cash, so a rental often shows a tax loss while cash-flowing — sheltering income. Rental losses are passive: they offset passive income freely, and up to $25,000/yr can offset ordinary (W-2) income if you actively participate and your MAGI is under $100k (phasing out to $0 by $150k); unused losses carry forward. On sale, claimed depreciation is recaptured at up to 25%, and gains may owe capital-gains tax (a 1031 exchange can defer both). Figures are a year-1 estimate at your 24.0% rate — not tax advice; consult a CPA.
Schools (NCES district)
- District
- Sachem Central School District
- NCES district ID
- 3625350
- Math proficiency
- 69% ▬ 0.00%
- Reading proficiency
- 76% ▲ 12.00%
- Median HH income
- $92,968
- Composite
- 65.53/100
- National rank
- #472
- State rank
- #86 of 590 in NY
Livability — Holtsville
- Score
- 71/100
- State rank
- #414
- US rank
- #7194
Category grades
Schools grade is shown separately in the Schools card above.
Census & demographics
- Census place
- Holtsville, NY
- County
- Suffolk County · 679,920 people
- City population
- 13,194
- Metro
- New York-Newark-Jersey City, NY-NJ-PA
- Population (ZIP)
- 26,667
- Household income
- $144,346
- Rent vs Own
- Severe rent burden
- 416.0
Population outlook (Suffolk County) Hauer SSP2
- Today (2025)
- 1,505,262 people
- By 2030
- 1,498,318 · -0.5%
- By 2040
- 1,471,101 · -2.3%
- By 2050
- 1,424,848 · -5.3%
- By 2075
- 1,337,157 · -11.2%
- By 2100
- 1,217,720 · -19.1%
Race, ethnicity, and origin ACS 2023
- Neighborhood character
- Predominantly White (75%)
- Race & ethnicity
- White 75% Hispanic / Latino 16% Two or more races 6% Asian 4% Black 3%
- Hispanic origin (detail)
- Puerto Rican 5%
- Common ancestry
- Romanian 6% Lithuanian 2% Scotch-Irish 1%
- Foreign-born
- 11% · Canada, China, Jamaica
- Languages at home
- 84% English-only · Spanish 9% Other Indo-European 2% Chinese 2%
Political lean MEDSL · Suffolk
- 2024 margin
- Lean R (+10.0) · D 45.0% · R 55.0%
- 2008→2024 swing
- -16.0pp toward R · 2008: 6.0pp · 2024: -10.0pp
- All cycles
- 2024: R+10.0 2020: R+0.0 2016: R+8.2 2012: D+2.9 2008: D+6.0
Not yet ingested
- Civics
- —
Market trends
- HPI YoY
- ▼ -682.71%
- Current HPI
- 328.9231
- Rent YoY
- ▲ 7.30%
- Metro
- New York-Newark-Jersey City, NY-NJ-PA
- State GDP YoY
- ▲ 2.60%
- F500 in state
- 92
Industry mix (Fortune 500 HQ in NY)
| Industry | F500 HQs | Revenue |
|---|---|---|
| Financial Services | 10 | $950B |
|
||
| Consumer Goods | 9 | $162B |
|
||
| Insurance | 4 | $225B |
|
||
| Telecommunications | 2 | $144B |
|
||
| Pharmaceuticals | 2 | $112B |
|
||
| Media / Entertainment | 2 | $69B |
|
||
Price history
+552.7% since first listed14 events — show timeline
- 2026-05-19 Price Changed $545,000 OneKey® MLS as Distributed by MLS Grid
- 2025-10-01 Relisted — OneKey® MLS as Distributed by MLS Grid
- 2025-10-01 Listing Removed — OneKey® MLS as Distributed by MLS Grid
- 2024-10-07 Relisted — OneKey® MLS as Distributed by MLS Grid
- 2024-09-30 Listing Removed — OneKey® MLS as Distributed by MLS Grid
- 2024-05-31 Listed $499,900 OneKey® MLS as Distributed by MLS Grid
- 2018-02-08 Listing Removed — OneKey® MLS as Distributed by MLS Grid
- 2017-08-08 Price Changed $210,000 OneKey® MLS as Distributed by MLS Grid
- 2017-08-08 Relisted — OneKey® MLS as Distributed by MLS Grid
- 2016-10-04 Listing Removed — OneKey® MLS as Distributed by MLS Grid
- 2016-07-07 Listed $199,000 OneKey® MLS as Distributed by MLS Grid
- 2015-12-11 Listing Removed — OneKey® MLS as Distributed by MLS Grid
- 2015-01-08 Listed $175,000 OneKey® MLS as Distributed by MLS Grid
- 1989-10-05 Sold (Public Records) $83,500 Public Records
Property tax history
+1.6%/yrLatest (2025): $8,874 · +0.0% YoY. Source: county tax records.
Cash-flow waterfall
monthlySold comps — $/sqft
last 12 mo · ≤1 miLoading sold comps…