 Duplex
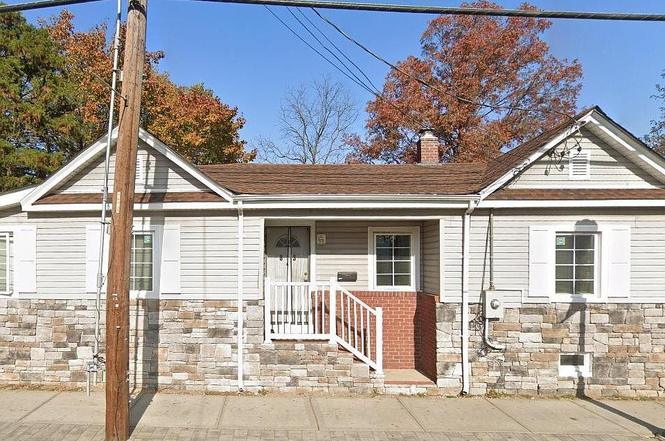
813 Prospect Ave · New Cassel, NY
Flood risk 1/10 · Minimal
- FEMA flood zone
- X (unshaded)
- Chance of flooding over 30 yrs
- 0.0%
- Est. flood insurance / yr
- $473 – $860
Fire risk 1/10 · Minimal
- Est. fire insurance / yr
- $691 – $1,283
Heat risk 6/10 · Moderate
- Hot days now (above 96°F)
- 7 days/yr
- Hot days in 30 yrs
- 16 days/yr
Wind risk 6/10 · Moderate
- Chance of severe wind over 30 yrs
- 54.0%
Air-quality risk 4/10 · Minor
- Unhealthy air days now
- 4 days/yr
- Unhealthy air days in 30 yrs
- 5 days/yr
Risk factors via First Street. Map © Google.
Why this score? — see what drove the C- grade
The composite is a weighted blend of 9 inputs, each scored 0–100. Each bar is that input's sub-score; the figure is the points it added to the 100-point composite (weight × sub-score).
- Cash flow +20.0/30.0
- ARV discount +7.5/15.0
- DSCR +6.3/10.0
- 1% rule +5.4/10.0
- Livability +3.7/5.0
- Schools +3.3/10.0
- Rent growth +2.5/5.0
- Condition / age +2.5/5.0
- Appreciation +0.0/10.0
$589,000
🖨 Deal sheet (PDF) 📄 Offer letter ✓ Due diligence
Multi-family units
County records classify this as Multi-Family (2-4 Unit). Listing-text estimate: 2 units. confirmed
Listing remarks
Duplex featuring a 1bdrm unit, and a 2bdrm unit for sale, gas heat, full basement w/ bilco doors, private parking driveway in back, close to all
Key facts
- Gas heat
- Full basement
- 6,525 sq ft lot
Tags
Neighborhood map
What this means for you Summary
Snapshot
- This is a 1×1bd/1.0ba + 1×2bd/1.0ba units multifamily listed at $589k.
Deal economics
- At list price, monthly cash flow is $718 ($9k/yr) — positive. Per door: $359/mo.
- The deal already cash-flows at list — no discount required.
- Meets the 1% rule at list price ($6k rent vs $589k).
- Recommended offer: $571k (3.0% below list) — sets the bar for market timing.
- Cap rate 7.8% vs local median 4.4% in New Cassel — top-decile yield for the area; either an underpriced asset or a hidden risk that comps aren't pricing in. Stress-test before assuming the spread holds.
Location & tenants
- Location reads 73/100 on livability (#311 in NY) — a middle-class / working-renter tenant base. Strengths: commute A+, employment A+, housing A+; Watch: amenities D, schools D-, cost of living F.
- Westbury Union Free School District (suburban): math 28% / reading 43% proficiency, ranked #531 of 590 in NY (top 90%) — families likely to look elsewhere, expect single-tenant / working-renter base with shorter leases; 75% free/reduced lunch — lower-income household profile, screen leases tightly.
- Market conditions: 183 active listings in the ZIP; 14 comparable units currently listed for rent nearby; rentals leasing fast (median 12d on market — plan ~1-2 weeks tenant-placement turnaround); high-income renter base; 824 units permitted in Nassau County in 2024 (153 in 5+ unit buildings).
- At $6,148/mo this rent would consume 48% of the median local household income ($153k/yr) (locally 730% of renters already pay >50% of income on rent) — very limited rent-growth headroom before tenants either downsize or default.
Forward outlook
- Local home prices are declining (-3.0%/yr); year-one equity from $4k of loan paydown is wiped out by about $18k of value loss. Plan a longer hold.
- Nassau County population projected at +7% by 2050 — modest demand growth; plan on rents tracking national, not racing it.
Negotiation context
- It's been on market 46 days — a 3% lower offer ($571k) is reasonable based on typical stale-listing flexibility.
- Current owner paid $77k; list at $589k implies a 664% gain — meaningful room to come down on a strong offer.
Risks & watch-outs
- Watch-outs: built in 1918 — expect roof / HVAC / electrical / plumbing capex.
- Climate carrying-cost: major wind risk, 54% chance of damaging wind over 30y; extreme-heat days projected 7→16/yr by 2055 (HVAC capex compounding) — expect insurance premiums to compound above CPI over the hold.
Questions for the listing agent
- It's been on market 46 days. Have you received any prior offers? Is the seller open to a 3% concession, seller financing, or rate buy-down credit?
- Can we see the unit-by-unit rent roll, current vacancy, and any below-market leases? What's the average tenancy length?
- What capital expenditures (roof, boiler, parking lot, exteriors) have been made in the last 5 years, and what's planned in the next 2?
- Built in 1918 — when were the roof, HVAC, electrical panel, plumbing, and water heater last replaced?
- Is there a deadline driving the sale (1031 exchange, divorce, estate, relocation)? That informs how much negotiation room exists.
- Schools are D-rated, which usually means shorter tenancies and higher turnover. Who's the typical renter profile here, and what's been the actual vacancy rate?
- What's the average days-on-market for RENTAL listings here right now (not sales)? A rising rental-DOM trend means longer vacancies and softer asking-rent achievability than the comps imply.
- What's the recent tenant-quality profile in this submarket — average credit score on applications, eviction rate, late-payment / NSF rate, and stable-employment percentage? A property-management company in the area should have these aggregated.
- How much new apartment / multifamily construction is in the pipeline within 1–3 miles? Heavy new supply (>2% of stock underway) typically softens rents 12–24 months out; light construction supports rent growth.
Investment metrics
- 1% rule
- 1.04% ✓
- Cap rate
- 7.76%
- Cash-on-cash
- 5.22%
- DSCR
- 1.23
- GRM
- 8.0
CMA / ARV
No comps found within radius.
Projected returns pro-forma
-3.0% appreciation · 3.0% rent growth · sell at horizon
- IRR
- -8.2%
- Equity multiple
- 0.70×
- Total profit
- $-49,599
- Equity at exit
- $87,822
- IRR
- 1.4%
- Equity multiple
- 1.10×
- Total profit
- $16,218
- Equity at exit
- $50,926
Cash invested: $164,920 (down + closing). Projections, not guarantees.
Landlord ↔ Tenant lean methodology
- Overall (STATE)
- 15 Strongly Tenant-Friendly
- State New York
- 15 Strongly Tenant-Friendly · D+10
- County
- — inherits STATE
- City
- — inherits STATE
ZIP-level market 11590
- Active inventory
- 183
- Price-to-rent
- 16.8×
Monthly cashflow live
- Estimated rent
- $6,148 high interval (Pro) →
- Mortgage (P&I)
- −$3,089
- Tax from tax record
- −$805 /mo · $9,660/yr
- Insurance
- −$245
- HOA
- −$0
- Vacancy / Maint / Mgmt
- −$1,291
- Net cashflow
- $718
Break-even live
Sensitivity live
| Price | -10% $1,051 | -5% $884 | +0% $718 | +5% $551 | +10% $384 |
|---|---|---|---|---|---|
| Rent | -10% $232 | -5% $475 | +0% $718 | +5% $961 | +10% $1,203 |
| Rate | -1.0pp $1,014 | -0.5pp $867 | base $718 | +0.5pp $565 | +1.0pp $410 |
2-unit breakdown (identical units grouped — click to expand)
| Units | Beds | Baths | Est. rent |
|---|---|---|---|
| 1× unit | 1 | 1 | $2,927 |
| 1× unit | 2 | 1 | $3,220 |
| Total (2 units) | $6,148 | ||
UW: 25.0% down · 7.5% · 30yr · 1.5% tax · 5.0% vac · 8.0% maint · 8.0% mgmt
Financing live
Cash to close
- Down payment
- $147,250
- Closing costs
- $17,670
- Reserves months
- —
- Total cash needed
- —
Loan-product check · same deal, 3 products live
Conventional
25% down · 7.5% · 30yr
- Down + closing
- —
- Monthly P&I
- —
- Monthly cashflow
- —
- DSCR
- —
- Eligible?
- —
Personal DTI + credit; lowest rate.
DSCR
20% down · 8.5% · 30yr
- Down + closing
- —
- Monthly P&I
- —
- Monthly cashflow
- —
- DSCR
- —
- Eligible?
- —
No personal income docs; deal must DSCR.
Hard money
10% down · 12.0% · 12mo
- Down + closing
- —
- Monthly P&I
- —
- Monthly cashflow
- —
- DSCR
- —
- Eligible?
- —
Short-term bridge; refi at stabilization.
Rent comps 14 comps
| Address | Beds | Baths | Sqft | Rent | $/sqft | DOM | Units | Dist |
|---|---|---|---|---|---|---|---|---|
| 261 Wilson Ave Unit 1ST Westbury, NY | 3.0 | 1.0 | 950 | $3,900 | $4.11 | 25d | 1 | 0.93mi |
| 248 Fulton St Westbury, NY | 4.0 | 2.5 | 1000 | $5,000 | $5.00 | 44d | 1 | 1.00mi |
| 35 Westwood Dr Unit 26 Westbury, NY | 3.0 | 2.0 | 1065 | $4,625 | $4.34 | 44d | 1 | 1.06mi |
| 10 Westwood Dr Unit 41 Westbury, NY | 3.0 | 2.0 | 1015 | $4,585 | $4.52 | 2d | 1 | 1.10mi |
| 7 Mindy Ln Westbury, NY | 4.0 | 2.0 | 1398 | $5,300 | $3.79 | 2d | 1 | 1.10mi |
| 65 Westwood Dr Unit 93 Westbury, NY | 3.0 | 2.0 | 1015 | $4,585 | $4.52 | 2d | 1 | 1.10mi |
| 75 Westwood Dr Unit 105 Westbury, NY | 3.0 | 2.0 | 1015 | $4,585 | $4.52 | 2d | 1 | 1.12mi |
| 40 Westwood Dr Unit 46 Westbury, NY | 3.0 | 2.0 | 1065 | $4,625 | $4.34 | 17d | 1 | 1.12mi |
| 865 Grand Blvd Westbury, NY | 4.0 | 2.0 | 1311 | $4,800 | $3.66 | 13d | 1 | 1.16mi |
| 105 Westwood Dr Unit 125 Westbury, NY | 3.0 | 2.0 | 1015 | $4,585 | $4.52 | 2d | 1 | 1.19mi |
| 115 Westwood Dr Unit 137 Westbury, NY | 3.0 | 2.0 | 1015 | $4,585 | $4.52 | 2d | 1 | 1.20mi |
| 80 Westwood Dr Unit 205 Westbury, NY | 3.0 | 2.0 | 1015 | $4,545 | $4.48 | 17d | 1 | 1.22mi |
| 100 Westwood Dr Westbury, NY | 1.0–3.0 | 1.5–2.0 | 865 | $4,665 | $5.39 | 2d | 1 | 1.25mi |
| 55 Acre Ln Hicksville, NY | 4.0 | 2.0 | 1114 | $4,595 | $4.12 | 12d | 1 | 1.48mi |
Listing history 5 events
-
2026-03-12status Pending
-
2026-01-24$589,000 Active
-
2022-11-12historical
-
1996-04-24soldstatus $77,073
-
1988-04-06soldstatus $110,000
ⓘ Source: listings_history table (triggers on properties + properties_extension) + one-shot
backfill from property_details.listing_events for pre-trigger history.
Tax reassessment forecast NY · Partial reset (capped growth)
- Current annual tax
- $9,660 · $805/mo
- Projected year-2 tax
- $9,807 · $817/mo
- Expected delta
- +$147/yr (+$12/mo · 1.5%)
ⓘ Screening estimate from a state-policy table — verify with the county assessor before closing.
Climate risk First Street
- Flood 1/10 Low FEMA zone X (unshaded) · 0% chance over 30 yrs
- Wildfire 1/10 Low
- Heat 6/10 Major 7 d/yr ≥96°F today · 16 d/yr by 30 yrs out
- Wind 6/10 Major 54% chance of damaging wind over 30 yrs
- Air quality 4/10 Moderate 4 unhealthy d/yr today · 5 by 30 yrs out
Nearby sold comps map
Loading sold comps map…
Walkable amenities ~0.75 mi
Loading nearby amenities…
Taxation est. · year 1
- Rental income
- $73,776
- − Mortgage interest
- −$32,993
- − Property taxes
- −$9,660
- − Insurance
- −$2,945
- − Repairs & maintenance
- −$5,902
- − Management
- −$5,902
- − Depreciation
- −$17,135
- Taxable loss
- −$761
- Est. tax savings @ 24.0%
- +$183
- After-tax cash flow
- $8,795/yr
For passive investors: Depreciation is non-cash, so a rental often shows a tax loss while cash-flowing — sheltering income. Rental losses are passive: they offset passive income freely, and up to $25,000/yr can offset ordinary (W-2) income if you actively participate and your MAGI is under $100k (phasing out to $0 by $150k); unused losses carry forward. On sale, claimed depreciation is recaptured at up to 25%, and gains may owe capital-gains tax (a 1031 exchange can defer both). Figures are a year-1 estimate at your 24.0% rate — not tax advice; consult a CPA.
Schools (NCES district)
- District
- Westbury Union Free School District
- NCES district ID
- 3630960
- Math proficiency
- 28% ▼ -11.00%
- Reading proficiency
- 43% ▼ -2.00%
- Median HH income
- $77,391
- Composite
- 33.33/100
- National rank
- #5498
- State rank
- #531 of 590 in NY
Livability — New Cassel
- Score
- 73/100
- State rank
- #311
- US rank
- #5155
Category grades
Schools grade is shown separately in the Schools card above.
Census & demographics
- Census place
- New Cassel, NY
- County
- Nassau County · 653,051 people
- City population
- 48,243
- Metro
- New York-Newark-Jersey City, NY-NJ-PA
- Population (ZIP)
- 47,599
- Household income
- $152,960
- Rent vs Own
- Severe rent burden
- 730.0
Population outlook (Nassau County) Hauer SSP2
- Today (2025)
- 1,409,302 people
- By 2030
- 1,431,482 · +1.6%
- By 2040
- 1,471,607 · +4.4%
- By 2050
- 1,502,845 · +6.6%
- By 2075
- 1,575,403 · +11.8%
- By 2100
- 1,554,356 · +10.3%
Race, ethnicity, and origin ACS 2023
- Neighborhood character
- Highly diverse neighborhood (Simpson 0.72)
- Race & ethnicity
- Hispanic / Latino 37% White 31% Two or more races 16% Black 15% Asian 12%
- Hispanic origin (detail)
- Mexican 9% Puerto Rican 3% Cuban 1% Dominican 3%
- Common ancestry
- Hispanic 4% Romanian 2% Scotch-Irish 2%
- Foreign-born
- 36% · Canada, China, South Korea
- Languages at home
- 48% English-only · Spanish 33% Other Indo-European 7% French/Haitian/Cajun 4%
Political lean MEDSL · Nassau
- 2024 margin
- Toss-up / Even · D 47.9% · R 52.1%
- 2008→2024 swing
- -12.6pp toward R · 2008: 8.4pp · 2024: -4.2pp
- All cycles
- 2024: R+4.2 2020: D+9.5 2016: D+5.3 2012: D+6.7 2008: D+8.4
Not yet ingested
- Civics
- —
Market trends
- HPI YoY
- ▼ -665.76%
- Current HPI
- 340.5834
- Rent YoY
- —
- Metro
- New York-Newark-Jersey City, NY-NJ-PA
- State GDP YoY
- ▲ 2.60%
- F500 in state
- 92
Industry mix (Fortune 500 HQ in NY)
| Industry | F500 HQs | Revenue |
|---|---|---|
| Financial Services | 10 | $950B |
|
||
| Consumer Goods | 9 | $162B |
|
||
| Insurance | 4 | $225B |
|
||
| Telecommunications | 2 | $144B |
|
||
| Pharmaceuticals | 2 | $112B |
|
||
| Media / Entertainment | 2 | $69B |
|
||
Price history
+435.5% since first listed5 events — show timeline
- 2026-03-12 Pending — OneKey® MLS as Distributed by MLS Grid
- 2026-01-24 Listed $589,000 OneKey® MLS as Distributed by MLS Grid
- 2022-11-12 Rental Removed — ONEKEY
- 1996-04-24 Sold (Public Records) $77,073 Public Records
- 1988-04-06 Sold (Public Records) $110,000 Public Records
Property tax history
+1.3%/yrLatest (2024): $9,660 · +0.9% YoY. Source: county tax records.
Cash-flow waterfall
monthlySold comps — $/sqft
last 12 mo · ≤1 miLoading sold comps…