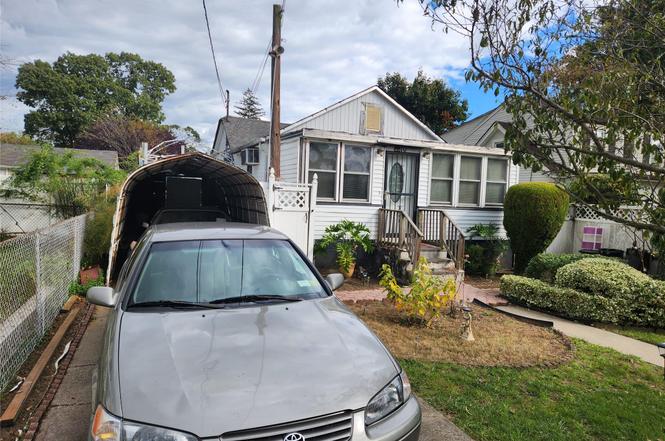
10 Sheridan Pl · Roosevelt, NY
Flood risk 1/10 · Minimal
- FEMA flood zone
- X (unshaded)
- Chance of flooding over 30 yrs
- 0.0%
- Est. flood insurance / yr
- $473 – $860
Fire risk 1/10 · Minimal
- Est. fire insurance / yr
- $691 – $1,283
Heat risk 6/10 · Moderate
- Hot days now (above 95°F)
- 7 days/yr
- Hot days in 30 yrs
- 16 days/yr
Wind risk 6/10 · Moderate
- Chance of severe wind over 30 yrs
- 53.0%
Air-quality risk 4/10 · Minor
- Unhealthy air days now
- 5 days/yr
- Unhealthy air days in 30 yrs
- 8 days/yr
Risk factors via First Street. Map © Google.
Why this score? — see what drove the C+ grade
The composite is a weighted blend of 9 inputs, each scored 0–100. Each bar is that input's sub-score; the figure is the points it added to the 100-point composite (weight × sub-score).
- Cash flow +30.0/30.0
- DSCR +10.0/10.0
- 1% rule +9.5/10.0
- Livability +3.7/5.0
- Schools +3.3/10.0
- Rent growth +2.5/5.0
- Condition / age +2.5/5.0
- ARV discount +1.9/15.0
- Appreciation +0.0/10.0
$390,000
🖨 Deal sheet (PDF) 📄 Offer letter ✓ Due diligence
Listing remarks
House will be delivered 100% vacant. House has various Building Violations and Open Permits. House is being sold 100% AS IS as far as condition and Open Permits
Key facts
- 4,000 sq ft lot
- Built 1926
- Listed 55 days
Neighborhood map
What this means for you Summary
Snapshot
- This is a 2-bed/1.0-bath single-family listed at $390k.
Deal economics
- At list price, monthly cash flow is $2k ($21k/yr) — positive.
- The deal already cash-flows at list — no discount required.
- Meets the 1% rule at list price ($6k rent vs $390k).
- Recommended offer: $378k (3.0% below list) — sets the bar for market timing.
- Cap rate 11.6% vs local median 4.0% in Roosevelt — top-decile yield for the area; either an underpriced asset or a hidden risk that comps aren't pricing in. Stress-test before assuming the spread holds.
Location & tenants
- Location reads 73/100 on livability (#307 in NY) — a middle-class / working-renter tenant base. Strengths: commute A+, employment A+, housing A+; Watch: crime D+, amenities F, cost of living F.
- Roosevelt Union Free School District (suburban): math 28% / reading 45% proficiency, ranked #529 of 590 in NY (top 90%) — families likely to look elsewhere, expect single-tenant / working-renter base with shorter leases.
- Zoned schools: Ulysses Byas Elementary School (math 22% / reading 47%, grade F, #1,577 of 2,108 statewide, top 77%, 444 students, 0% FRL); Roosevelt Middle School (math 12% / reading 27%, grade F, #685 of 729 statewide, top 94%, 455 students, 0% FRL); Roosevelt High School (math 65% / reading 78%, grade B+, #698 of 1,100 statewide, top 63%, 1,075 students, 59% FRL) — zoned schools average 20% FRL vs 58% district-wide (39 pts lower); this property's tenant base skews higher-income than the district average.
- Market conditions: 52 active listings in the ZIP; 3 comparable units currently listed for rent nearby; rentals at typical pace (median 19d on market — plan ~3-4 weeks tenant-placement turnaround); 824 units permitted in Nassau County in 2024 (153 in 5+ unit buildings).
Forward outlook
- Local home prices are declining (-3.0%/yr); year-one equity from $3k of loan paydown is wiped out by about $12k of value loss. Plan a longer hold.
- Nassau County population projected at +7% by 2050 — modest demand growth; plan on rents tracking national, not racing it.
- At projected returns (-3.0% appreciation + 3.0% rent growth), your $109k cash investment doubles in ~7 years — after that, you're playing with house money.
Negotiation context
- It's been on market 55 days — a 3% lower offer ($378k) is reasonable based on typical stale-listing flexibility.
- 8 sale attempts since 10y ago with the ask held roughly flat each time — persistent listings suggest the price (not the market) is what's stuck; bring a comps-based counter.
- Current owner paid $210k; list at $390k implies a 86% gain — meaningful room to come down on a strong offer.
Risks & watch-outs
- Watch-outs: built in 1926 — expect roof / HVAC / electrical / plumbing capex.
- Climate carrying-cost: major wind risk, 53% chance of damaging wind over 30y; extreme-heat days projected 7→16/yr by 2055 (HVAC capex compounding) — expect insurance premiums to compound above CPI over the hold.
Questions for the listing agent
- It's been on market 55 days. Have you received any prior offers? Is the seller open to a 3% concession, seller financing, or rate buy-down credit?
- Built in 1926 — when were the roof, HVAC, electrical panel, plumbing, and water heater last replaced?
- Is there a deadline driving the sale (1031 exchange, divorce, estate, relocation)? That informs how much negotiation room exists.
- Crime grade is D in this area — have there been break-ins, vandalism, or insurance claims at this property in the last 3 years? What carrier currently insures it and at what premium?
- What's the average days-on-market for RENTAL listings here right now (not sales)? A rising rental-DOM trend means longer vacancies and softer asking-rent achievability than the comps imply.
- What's the recent tenant-quality profile in this submarket — average credit score on applications, eviction rate, late-payment / NSF rate, and stable-employment percentage? A property-management company in the area should have these aggregated.
- How much new for-sale + rental construction is in the pipeline within 1–3 miles? Heavy new supply typically softens prices + rents 12–24 months out; constrained supply supports both.
Investment metrics
- 1% rule
- 1.45% ✓
- Cap rate
- 11.57%
- Cash-on-cash
- 18.83%
- DSCR
- 1.84
- GRM
- 5.7
CMA / ARV
- ARV (on-the-fly)
- $346,904
- Comps found
- 1
Show comp detail 1 sale within ~0.75 mi
| Address | Dist | Beds/Ba | Sqft | Sold | Price | $/sf | Match |
|---|---|---|---|---|---|---|---|
| 451 Babylon Tpke | 0.72mi | 2/1.0 | 772 (-6%) | 6mo | $325,000 | $421 | 51 |
Match score weights: distance 35% · size 25% · config 20% · recency 20%. Top-matched comps best support the ARV.
Projected returns pro-forma
-3.0% appreciation · 3.0% rent growth · sell at horizon
- IRR
- 10.7%
- Equity multiple
- 1.42×
- Total profit
- $46,072
- Equity at exit
- $58,150
- IRR
- 19.7%
- Equity multiple
- 2.66×
- Total profit
- $181,156
- Equity at exit
- $33,720
Cash invested: $109,200 (down + closing). Projections, not guarantees.
Landlord ↔ Tenant lean methodology
- Overall (STATE)
- 15 Strongly Tenant-Friendly
- State New York
- 15 Strongly Tenant-Friendly · D+10
- County
- — inherits STATE
- City
- — inherits STATE
ZIP-level market 11575
- Active inventory
- 52
- Price-to-rent
- 5.7×
Monthly cashflow live
- Estimated rent
- $5,655 medium interval (Pro) →
- Mortgage (P&I)
- −$2,045
- Tax from tax record
- −$546 /mo · $6,552/yr
- Insurance
- −$162
- HOA
- −$0
- Vacancy / Maint / Mgmt
- −$1,188
- Net cashflow
- $1,714
Break-even live
Sensitivity live
| Price | -10% $1,934 | -5% $1,824 | +0% $1,714 | +5% $1,603 | +10% $1,493 |
|---|---|---|---|---|---|
| Rent | -10% $1,267 | -5% $1,490 | +0% $1,714 | +5% $1,937 | +10% $2,160 |
| Rate | -1.0pp $1,910 | -0.5pp $1,813 | base $1,714 | +0.5pp $1,613 | +1.0pp $1,510 |
UW: 25.0% down · 7.5% · 30yr · 1.5% tax · 5.0% vac · 8.0% maint · 8.0% mgmt
Financing live
Cash to close
- Down payment
- $97,500
- Closing costs
- $11,700
- Reserves months
- —
- Total cash needed
- —
Loan-product check · same deal, 3 products live
Conventional
25% down · 7.5% · 30yr
- Down + closing
- —
- Monthly P&I
- —
- Monthly cashflow
- —
- DSCR
- —
- Eligible?
- —
Personal DTI + credit; lowest rate.
DSCR
20% down · 8.5% · 30yr
- Down + closing
- —
- Monthly P&I
- —
- Monthly cashflow
- —
- DSCR
- —
- Eligible?
- —
No personal income docs; deal must DSCR.
Hard money
10% down · 12.0% · 12mo
- Down + closing
- —
- Monthly P&I
- —
- Monthly cashflow
- —
- DSCR
- —
- Eligible?
- —
Short-term bridge; refi at stabilization.
Rent comps 3 comps
| Address | Beds | Baths | Sqft | Rent | $/sqft | DOM | Units | Dist |
|---|---|---|---|---|---|---|---|---|
| 196 E Seaman Ave Freeport, NY | 3.0 | 2.5 | 1062 | $8,500 | $8.00 | 19d | 1 | 0.88mi |
| 74 Broadway Unit 3B Freeport, NY | 1.0 | 1.0 | 525 | $2,700 | $5.14 | 45d | 1 | 1.39mi |
| 1000 Brix Pl Uniondale, NY | 1.0–2.0 | 1.0–2.0 | 710 | $3,662 | $5.16 | 0d | 13 | 1.48mi |
Listing history 21 events
-
2025-11-18status Pending
-
2025-10-08status Active
-
2025-10-07status Pending
-
2025-09-23$390,000 Active
-
2025-09-23historical
-
2025-09-10price $390,000
-
2025-09-10status Active
-
2024-09-19status Pending
-
2024-07-19$360,000 Active
-
2023-12-05status Pending
-
2023-12-05historical
-
2023-11-06price $349,900
-
2023-10-18$375,000 Active
-
2017-03-16soldstatus $210,000
-
2017-02-24soldstatus $205,000
-
2017-02-24soldstatus $205,000 Closed
-
2017-02-16status Under Contract
-
2017-01-13status Back On Market
-
2016-09-19status Under Contract
-
2016-08-09$229,000 New
-
2016-08-09$229,000
ⓘ Source: listings_history table (triggers on properties + properties_extension) + one-shot
backfill from property_details.listing_events for pre-trigger history.
Tax reassessment forecast NY · Partial reset (capped growth)
- Current annual tax
- $6,552 · $546/mo
- Projected year-2 tax
- $6,572 · $548/mo
- Expected delta
- +$19/yr (+$2/mo · 0.3%)
ⓘ Screening estimate from a state-policy table — verify with the county assessor before closing.
Climate risk First Street
- Flood 1/10 Low FEMA zone X (unshaded) · 0% chance over 30 yrs
- Wildfire 1/10 Low
- Heat 6/10 Major 7 d/yr ≥95°F today · 16 d/yr by 30 yrs out
- Wind 6/10 Major 53% chance of damaging wind over 30 yrs
- Air quality 4/10 Moderate 5 unhealthy d/yr today · 8 by 30 yrs out
Nearby sold comps map
Loading sold comps map…
Walkable amenities ~0.75 mi
Loading nearby amenities…
Taxation est. · year 1
- Rental income
- $67,860
- − Mortgage interest
- −$21,846
- − Property taxes
- −$6,552
- − Insurance
- −$1,950
- − Repairs & maintenance
- −$5,429
- − Management
- −$5,429
- − Depreciation
- −$11,345
- Taxable income
- $15,308
- Est. tax owed @ 24.0%
- −$3,674
- After-tax cash flow
- $16,891/yr
For passive investors: Depreciation is non-cash, so a rental often shows a tax loss while cash-flowing — sheltering income. Rental losses are passive: they offset passive income freely, and up to $25,000/yr can offset ordinary (W-2) income if you actively participate and your MAGI is under $100k (phasing out to $0 by $150k); unused losses carry forward. On sale, claimed depreciation is recaptured at up to 25%, and gains may owe capital-gains tax (a 1031 exchange can defer both). Figures are a year-1 estimate at your 24.0% rate — not tax advice; consult a CPA.
Schools (NCES district)
- District
- Roosevelt Union Free School District
- NCES district ID
- 3624990
- Math proficiency
- 28% ▼ -4.00%
- Reading proficiency
- 45% ▲ 6.00%
- Median HH income
- $69,717
- Composite
- 33.41/100
- National rank
- #5472
- State rank
- #529 of 590 in NY
Livability — Roosevelt
- Score
- 73/100
- State rank
- #307
- US rank
- #5074
Category grades
Schools grade is shown separately in the Schools card above.
Census & demographics
- Census place
- Roosevelt, NY
- City population
- 19,430
- Population (ZIP)
- 19,430
Population outlook (Nassau County) Hauer SSP2
- Today (2025)
- 1,409,302 people
- By 2030
- 1,431,482 · +1.6%
- By 2040
- 1,471,607 · +4.4%
- By 2050
- 1,502,845 · +6.6%
- By 2075
- 1,575,403 · +11.8%
- By 2100
- 1,554,356 · +10.3%
Race, ethnicity, and origin ACS 2023
- Neighborhood character
- Diverse neighborhood (Simpson 0.55)
- Race & ethnicity
- Black 53% Hispanic / Latino 41% Two or more races 7% Asian 2% White 1%
- Hispanic origin (detail)
- Puerto Rican 6% Dominican 4%
- Common ancestry
- Hispanic 4%
- Foreign-born
- 36% · Canada, Jamaica, South Korea
- Languages at home
- 60% English-only · Spanish 34% French/Haitian/Cajun 4% Other Indo-European 2%
Political lean MEDSL · Nassau
- 2024 margin
- Toss-up / Even · D 47.9% · R 52.1%
- 2008→2024 swing
- -12.6pp toward R · 2008: 8.4pp · 2024: -4.2pp
- All cycles
- 2024: R+4.2 2020: D+9.5 2016: D+5.3 2012: D+6.7 2008: D+8.4
Not yet ingested
- Civics
- —
Market trends
- HPI YoY
- ▼ -368.53%
- Current HPI
- 364.7467
- Rent YoY
- —
- Metro
- —
- State GDP YoY
- ▲ 2.60%
- F500 in state
- 92
Industry mix (Fortune 500 HQ in NY)
| Industry | F500 HQs | Revenue |
|---|---|---|
| Financial Services | 10 | $950B |
|
||
| Consumer Goods | 9 | $162B |
|
||
| Insurance | 4 | $225B |
|
||
| Telecommunications | 2 | $144B |
|
||
| Pharmaceuticals | 2 | $112B |
|
||
| Media / Entertainment | 2 | $69B |
|
||
Price history
+70.3% since first listed21 events — show timeline
- 2025-11-18 Pending — OneKey® MLS as Distributed by MLS Grid
- 2025-10-08 Relisted — OneKey® MLS as Distributed by MLS Grid
- 2025-10-07 Pending — OneKey® MLS as Distributed by MLS Grid
- 2025-09-23 Listing Removed — OneKey® MLS as Distributed by MLS Grid
- 2025-09-23 Listed $390,000 OneKey® MLS as Distributed by MLS Grid
- 2025-09-10 Price Changed $390,000 OneKey® MLS as Distributed by MLS Grid
- 2025-09-10 Relisted — OneKey® MLS as Distributed by MLS Grid
- 2024-09-19 Pending — OneKey® MLS as Distributed by MLS Grid
- 2024-07-19 Listed $360,000 OneKey® MLS as Distributed by MLS Grid
- 2023-12-05 Pending — OneKey® MLS as Distributed by MLS Grid
- 2023-12-05 Listing Removed — OneKey® MLS as Distributed by MLS Grid
- 2023-11-06 Price Changed $349,900 OneKey® MLS as Distributed by MLS Grid
- 2023-10-18 Listed $375,000 OneKey® MLS as Distributed by MLS Grid
- 2017-03-16 Sold (Public Records) $210,000 Public Records
- 2017-02-24 Sold (MLS) $205,000 OneKey® MLS as Distributed by MLS Grid
- 2017-02-24 Sold (MLS) $205,000 MLSLI
- 2017-02-16 Pending — MLSLI
- 2017-01-13 Relisted — MLSLI
- 2016-09-19 Pending — MLSLI
- 2016-08-09 Listed $229,000 MLSLI
- 2016-08-09 Listed $229,000 OneKey® MLS as Distributed by MLS Grid
Property tax history
+3.4%/yrLatest (2024): $6,552 · -1.0% YoY. Source: county tax records.
Cash-flow waterfall
monthlySold comps — $/sqft
last 12 mo · ≤1 miLoading sold comps…