1016 Rodeo Rd · Del Monte Forest, CA
Flood risk 1/10 · Minimal
- FEMA flood zone
- X (unshaded)
- Chance of flooding over 30 yrs
- 0.0%
- Est. flood insurance / yr
- $507 – $1,088
Fire risk 4/10 · Minor
- Est. fire insurance / yr
- $659 – $1,223
Heat risk 1/10 · Minimal
- Hot days now (above 75°F)
- 8 days/yr
- Hot days in 30 yrs
- 18 days/yr
Wind risk 1/10 · Minimal
- Chance of severe wind over 30 yrs
- —
Air-quality risk 5/10 · Moderate
- Unhealthy air days now
- 7 days/yr
- Unhealthy air days in 30 yrs
- 7 days/yr
Risk factors via First Street. Map © Google.
Why this score? — see what drove the D grade
The composite is a weighted blend of 9 inputs, each scored 0–100. Each bar is that input's sub-score; the figure is the points it added to the 100-point composite (weight × sub-score).
- Cash flow +9.4/30.0
- ARV discount +7.5/15.0
- Schools +6.4/10.0
- Appreciation +5.6/10.0
- Livability +3.4/5.0
- 1% rule +2.8/10.0
- DSCR +2.6/10.0
- Rent growth +2.5/5.0
- Condition / age +2.5/5.0
$1,075,000
🖨 Deal sheet 📄 Offer letter ✓ Due diligence
Listing remarks MLS
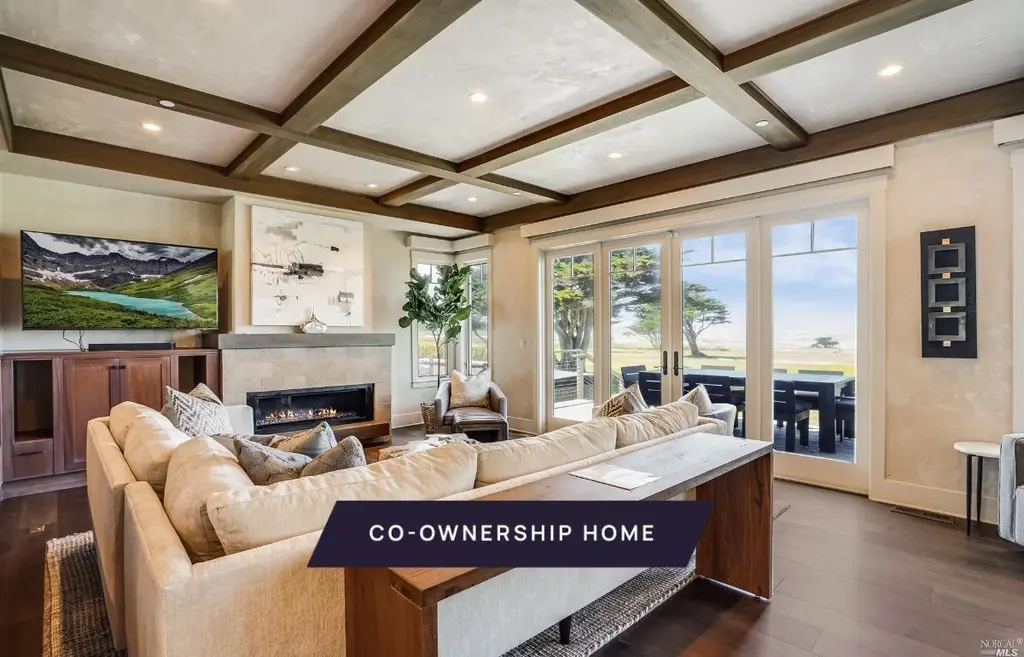
New co-ownership opportunity by Pacaso: Own one-eighth of Rodeo, a professionally managed, turnkey home. With unobstructed ocean views, this 4-bedroom, 3.5-bath home on Monterey Peninsula Country Club is the ultimate Pacific Coast getaway. With warm wood floors, ceiling beams and custom shelving, the sunken living room is an oasis of calm with a sleek, modern fireplace and glass doors leading to the patio. Step up to an elegant dining room with ocean views and sliding doors to an outdoor dining table. The gourmet kitchen is as lovely as it is efficient, with stainless steel appliances, stone counters, a breakfast bar and a huge pantry. The spacious main-floor primary suite has doors to its own west-facing deck, an en suite bathroom with soaking tub, tiled shower and vanity with double sinks, and a large closet. Upstairs, three more bedrooms and two bathrooms provide plenty of space for family and friends, and a covered deck is the perfect place to relax before bed. Rodeo is within a five minute drive to world class golf at Pebble Beach, Spyglass, Poppy Hills and Spanish Bay. The home comes fully furnished and professionally decorated.
Key facts
- Elegant dining room
- Modern fireplace
- Sunken living room
Tags
Neighborhood map
What this means for you Summary
Snapshot
- This is a 4-bed/3.5-bath single-family listed at $1.07M.
Deal economics
- At list price, monthly cash flow is $-763 ($-9k/yr) — negative.
- To cash-flow at today's rent, offer at most $965k (10.3% below list).
- To meet the 1% rule (rent ≥ 1% of price), the offer needs to be $844k (21.5% below list).
- Recommended offer: $844k (21.5% below list) — sets the bar for 1% rule.
- Cap rate 5.4% vs local median 0.4% in Del Monte Forest — top-decile yield for the area; either an underpriced asset or a hidden risk that comps aren't pricing in. Stress-test before assuming the spread holds.
Location & tenants
- Location reads 68/100 on livability (#278 in CA) — a middle-class / working-renter tenant base. Strengths: crime A+, employment A+, health & safety A+; Watch: amenities F, commute F, cost of living F.
- Pacific Grove Unified (suburban): math 65% / reading 78% proficiency, ranked #95 of 1,400 in CA (top 7%) — strong family-tenant draw, lease renewals of 3-5y typical; only 14% free/reduced lunch — higher-income household profile.
- Market conditions: 47 active listings in the ZIP; 4 comparable units currently listed for rent nearby; rentals lingering (median 44d on market — plan ~5-8 weeks vacancy on turnover, expect pricing pressure); 50% of comp listings sitting > 30 days — soft ceiling on asking rent; high-income renter base; 530 units permitted in Monterey County in 2024 (50 in 5+ unit buildings).
- At $8,438/mo this rent would consume 71% of the median local household income ($143k/yr) (locally 51% of renters already pay >50% of income on rent) — very limited rent-growth headroom before tenants either downsize or default.
Forward outlook
- In year one you build about $21k of equity ($7k loan paydown + $14k appreciation (1.3% local appreciation)).
- Monterey County population projected at +10% by 2050 — modest demand growth; plan on rents tracking national, not racing it.
- By year 4, paydown + projected appreciation supports a ~$76k cash-out refi (75% LTV) — recoverable capital for the next deal without selling this one.
Negotiation context
- It's been on market 70 days — a 6% lower offer ($1.01M) is reasonable based on typical stale-listing flexibility.
- 13 sale attempts since 26y ago with the ask held roughly flat each time — persistent listings suggest the price (not the market) is what's stuck; bring a comps-based counter.
Questions for the listing agent
- What do current leases actually rent for vs. the listed asking? Can we see a recent rent roll and the last 12 months of T-12 income?
- It's been on market 70 days. Have you received any prior offers? Is the seller open to a 22% concession, seller financing, or rate buy-down credit?
- Why hasn't it sold? Are there any deal-killer items the seller is aware of (foundation, flood, title, zoning, code violations)?
- Is there a deadline driving the sale (1031 exchange, divorce, estate, relocation)? That informs how much negotiation room exists.
- Schools are B-rated — typically a magnet for longer-tenancy family renters. What's the average tenant stay here, and is there a school-zone premium baked into asking?
- The area grade is low — what's the realistic commute time and amenity access for the typical tenant pool here? Any planned neighborhood developments (good or bad) we should know about?
- What's the average days-on-market for RENTAL listings here right now (not sales)? A rising rental-DOM trend means longer vacancies and softer asking-rent achievability than the comps imply.
- What's the recent tenant-quality profile in this submarket — average credit score on applications, eviction rate, late-payment / NSF rate, and stable-employment percentage? A property-management company in the area should have these aggregated.
- How much new for-sale + rental construction is in the pipeline within 1–3 miles? Heavy new supply typically softens prices + rents 12–24 months out; constrained supply supports both.
Investment metrics
- 1% rule
- 0.78% ✗
- Cap rate
- 5.44%
- Cash-on-cash
- -3.04%
- DSCR
- 0.86
- GRM
- 10.6
CMA / ARV
- ARV (median comp)
- $3,308,624
- List price
- $1,075,000
- Delta
- -67.51%
- Verdict
- UNDERPRICED
- Comps
- 20 within 1.0 mi
Show comp detail 12 sales within ~0.75 mi
| Address | Dist | Beds/Ba | Sqft | Sold | Price | $/sf | Match |
|---|---|---|---|---|---|---|---|
| 3125 Bird Rock Rd | 0.38mi | 4/3.0 | 2,611 (0%) | 5mo | $3,100,000 | $1,187 | 76 |
| 999 Customs Rd | 0.36mi | 4/3.5 | 2,640 (+1%) | 8mo | $3,000,000 | $1,136 | 74 |
| 1030 Vaquero Rd | 0.09mi | 4/2.5 | 2,840 (+9%) | 8mo | $2,600,000 | $915 | 71 |
| 3071 Sloat Rd | 0.59mi | 3/4.0 (-1) | 2,613 (+0%) | 2mo | $1,850,000 | $708 | 64 |
| 3141 Hacienda Dr | 0.36mi | 4/3.0 | 2,330 (-11%) | 1mo | $2,885,000 | $1,238 | 62 |
| 1029 Rodeo Rd | 0.12mi | 3/3.5 (-1) | 2,965 (+14%) | 6mo | $3,300,000 | $1,113 | 62 |
| 1057 Broncho Rd | 0.51mi | 3/3.0 (-1) | 2,799 (+7%) | 1mo | $3,800,000 | $1,358 | 56 |
| 1056 Indian Village Rd | 0.50mi | 3/2.5 (-1) | 2,707 (+4%) | 10mo | $4,525,000 | $1,672 | 54 |
| 1105 Wildcat Canyon Rd | 0.65mi | 3/3.5 (-1) | 2,876 (+10%) | 0mo | $3,400,000 | $1,182 | 48 |
| 3020 Sloat Rd | 0.59mi | 3/2.5 (-1) | 2,259 (-13%) | 6mo | $2,550,000 | $1,129 | 36 |
| 3037 Strawberry Hill Rd | 0.66mi | 3/2.5 (-1) | 2,931 (+12%) | 8mo | $2,200,000 | $751 | 33 |
| 1121 Circle Rd | 0.69mi | 3/2.5 (-1) | 2,219 (-15%) | 1mo | $2,500,000 | $1,127 | 33 |
Match score weights: distance 35% · size 25% · config 20% · recency 20%. Top-matched comps best support the ARV.
Projected returns pro-forma
1.3% appreciation · 3.0% rent growth · sell at horizon
- IRR
- -0.8%
- Equity multiple
- 0.96×
- Total profit
- $-12,756
- Equity at exit
- $383,591
- IRR
- 3.9%
- Equity multiple
- 1.49×
- Total profit
- $148,165
- Equity at exit
- $522,851
Cash invested: $301,000 (down + closing). Projections, not guarantees.
Landlord ↔ Tenant lean methodology
- Overall (STATE)
- 18 Strongly Tenant-Friendly
- State California
- 18 Strongly Tenant-Friendly · D+13
- County
- — inherits STATE
- City
- — inherits STATE
ZIP-level market 93953
- Home prices YoY
- 0.5%
- Active inventory
- 47
- Price-to-rent
- 10.6×
Monthly cashflow live
- Estimated rent
- $8,438 medium interval (Pro) →
- Mortgage (P&I)
- −$5,637
- Tax est. 1.5%
- −$1,344 /mo · $16,125/yr
- Insurance
- −$448
- HOA
- −$0
- Vacancy / Maint / Mgmt
- −$1,772
- Net cashflow
- $-763
Break-even live
UW: 25.0% down · 7.5% · 30yr · 1.5% tax · 5.0% vac · 8.0% maint · 8.0% mgmt
Financing live
Cash to close
- Down payment
- $268,750
- Closing costs
- $32,250
- Reserves months
- —
- Total cash needed
- —
Loan-product check · same deal, 3 products live
Conventional
25% down · 7.5% · 30yr
- Down + closing
- —
- Monthly P&I
- —
- Monthly cashflow
- —
- DSCR
- —
- Eligible?
- —
Personal DTI + credit; lowest rate.
DSCR
20% down · 8.5% · 30yr
- Down + closing
- —
- Monthly P&I
- —
- Monthly cashflow
- —
- DSCR
- —
- Eligible?
- —
No personal income docs; deal must DSCR.
Hard money
10% down · 12.0% · 12mo
- Down + closing
- —
- Monthly P&I
- —
- Monthly cashflow
- —
- DSCR
- —
- Eligible?
- —
Short-term bridge; refi at stabilization.
Rent comps 4 comps
| Address | Beds | Baths | Sqft | Rent | $/sqft | DOM | Units | Dist |
|---|---|---|---|---|---|---|---|---|
| 2869 17 Mile Dr Pebble Beach, CA | 3.0 | 2.0 | 2080 | $6,500 | $3.12 | 13d | 1 | 1.03mi |
| 1154 Chaparral Rd Pebble Beach, CA | 4.0 | 3.0 | 2318 | $5,250 | $2.26 | 43d | 1 | 1.10mi |
| 1043 Ortega Rd Pebble Beach, CA | 3.0 | 2.0 | 1836 | $5,195 | $2.83 | 43d | 1 | 1.17mi |
| 1403 Cantera Ct Pebble Beach, CA | 4.0 | 2.5 | 3113 | $15,000 | $4.82 | 13d | 1 | 1.43mi |
Listing history 40 events
-
2026-06-02days on market $1,075,000 Active 70 DOM
-
2026-06-01days on market $1,075,000 Active 69 DOM
-
2026-05-31days on market $1,075,000 Active 68 DOM
-
2026-05-30days on market $1,075,000 Active 67 DOM
-
2026-03-24$1,075,000 Active 1152-char remark
Show marketing remark (1152 chars)
New co-ownership opportunity by Pacaso: Own one-eighth of Rodeo, a professionally managed, turnkey home. With unobstructed ocean views, this 4-bedroom, 3.5-bath home on Monterey Peninsula Country Club is the ultimate Pacific Coast getaway. With warm wood floors, ceiling beams and custom shelving, the sunken living room is an oasis of calm with a sleek, modern fireplace and glass doors leading to the patio. Step up to an elegant dining room with ocean views and sliding doors to an outdoor dining table. The gourmet kitchen is as lovely as it is efficient, with stainless steel appliances, stone counters, a breakfast bar and a huge pantry. The spacious main-floor primary suite has doors to its own west-facing deck, an en suite bathroom with soaking tub, tiled shower and vanity with double sinks, and a large closet. Upstairs, three more bedrooms and two bathrooms provide plenty of space for family and friends, and a covered deck is the perfect place to relax before bed. Rodeo is within a five minute drive to world class golf at Pebble Beach, Spyglass, Poppy Hills and Spanish Bay. The home comes fully furnished and professionally decorated.
-
2025-12-03$1,100,000 Active
-
2025-10-03status Pending
-
2025-07-16price $1,150,000
-
2025-05-09price $1,200,000
-
2025-01-17$1,250,000 Active
-
2024-08-12status Pending
-
2024-07-09$1,099,000 Active
-
2023-12-11$1,099,000 Active
-
2023-08-29historical
-
2023-05-25price $1,099,000
-
2023-05-25$1,199,000 Active
-
2022-10-19price $1,199,000
-
2022-09-20$1,299,000 Active
-
2022-07-29status Pending (Do Not Show)
-
2022-07-29soldstatus $9,008,000 Sold
-
2022-07-29soldstatus $9,008,000
-
2022-02-03price $9,008,000
-
2022-01-26$7,500,000 Active
-
2022-01-26$9,008,000
-
2022-01-25soldstatus $7,500,000
-
2022-01-25soldstatus $7,500,000
-
2022-01-25soldstatus $6,400,000
-
2022-01-24$7,500,000
-
2022-01-24$7,500,000
-
2009-02-19historical
-
2009-02-19soldstatus $3,200,000 Sold
-
2009-02-09historical
-
2008-11-17price $4,195,000
-
2008-09-22$4,995,000
-
2001-03-02historical
-
2001-03-02soldstatus $2,605,000
-
2001-02-15soldstatus $2,605,000
-
2000-11-10$2,500,000
-
1990-04-23soldstatus $1,100,000
-
1979-10-08soldstatus $325,000
ⓘ Source: listings_history table (triggers on properties + properties_extension) + one-shot
backfill from property_details.listing_events for pre-trigger history.
Climate risk First Street
- Flood 1/10 Low FEMA zone X (unshaded) · 0% chance over 30 yrs
- Wildfire 4/10 Moderate
- Heat 1/10 Low 8 d/yr ≥75°F today · 18 d/yr by 30 yrs out
- Wind 1/10 Low
- Air quality 5/10 Major 7 unhealthy d/yr today · 7 by 30 yrs out
Nearby sold comps map
Loading sold comps map…
Walkable amenities ~0.75 mi
Loading nearby amenities…
Taxation est. · year 1
- Rental income
- $101,257
- − Mortgage interest
- −$60,217
- − Property taxes
- −$16,125
- − Insurance
- −$5,375
- − Repairs & maintenance
- −$8,101
- − Management
- −$8,101
- − Depreciation
- −$31,273
- Taxable loss
- −$27,933
- Est. tax savings @ 24.0%
- +$6,704
- After-tax cash flow
- $-2,452/yr
For passive investors: Depreciation is non-cash, so a rental often shows a tax loss while cash-flowing — sheltering income. Rental losses are passive: they offset passive income freely, and up to $25,000/yr can offset ordinary (W-2) income if you actively participate and your MAGI is under $100k (phasing out to $0 by $150k); unused losses carry forward. On sale, claimed depreciation is recaptured at up to 25%, and gains may owe capital-gains tax (a 1031 exchange can defer both). Figures are a year-1 estimate at your 24.0% rate — not tax advice; consult a CPA.
Schools (NCES district)
- District
- Pacific Grove Unified
- NCES district ID
- 0629370
- Math proficiency
- 65% ▼ -1.00%
- Reading proficiency
- 78% ▲ 2.00%
- Median HH income
- $77,560
- Composite
- 64.35/100
- National rank
- #1153
- State rank
- #95 of 1400 in CA
Livability — Del Monte Forest
- Score
- 68/100
- State rank
- #278
- US rank
- #9319
Category grades
Schools grade is shown separately in the Schools card above.
Census & demographics
- Census place
- Del Monte Forest, CA
- County
- Monterey County · 241,191 people
- City population
- 3,613
- Metro
- Salinas, CA
- Population (ZIP)
- 3,613
- Household income
- $142,763
- Rent vs Own
- Severe rent burden
- 51.0
Population outlook (Monterey County) Hauer SSP2
- Today (2025)
- 458,436 people
- By 2030
- 469,418 · +2.4%
- By 2040
- 489,615 · +6.8%
- By 2050
- 506,696 · +10.5%
- By 2075
- 531,048 · +15.8%
- By 2100
- 519,153 · +13.2%
Race, ethnicity, and origin ACS 2023
- Neighborhood character
- Predominantly White (84%)
- Race & ethnicity
- White 84% Asian 9% Two or more races 4% Hispanic / Latino 4%
- Common ancestry
- Lithuanian 5% Romanian 5% Slovak 4%
- Foreign-born
- 11% · South Korea, China, Canada
- Languages at home
- 88% English-only · Korean 2% Arabic 2% Other Indo-European 2%
Political lean MEDSL · Monterey
- 2024 margin
- Strong D (+29.9) · D 63.4% · R 33.5% · Other 3.0%
- 2008→2024 swing
- -8.4pp toward R · 2008: 38.3pp · 2024: 29.9pp
- All cycles
- 2024: D+29.9 2020: D+41.3 2016: D+39.7 2012: D+33.9 2008: D+38.3
Not yet ingested
- Civics
- —
Market trends
- HPI YoY
- ▲ 1.30%
- Current HPI
- 250.1488
- Rent YoY
- —
- Metro
- Salinas, CA
- State GDP YoY
- ▲ 3.21%
- F500 in state
- 116
Industry mix (Fortune 500 HQ in CA)
| Industry | F500 HQs | Revenue |
|---|---|---|
| Technology | 27 | $1,492B |
|
||
| Financial Services | 3 | $174B |
|
||
| Retail | 3 | $44B |
|
||
| Insurance | 3 | $26B |
|
||
| Media / Entertainment | 2 | $115B |
|
||
| Pharmaceuticals / Biotech | 2 | $62B |
|
||
Price history
+230.8% since first listed36 events — show timeline
- 2026-03-24 Listed $1,075,000 BAREIS
- 2025-12-03 Listed $1,100,000 BAREIS
- 2025-10-03 Pending — BAREIS
- 2025-07-16 Price Changed $1,150,000 BAREIS
- 2025-05-09 Price Changed $1,200,000 BAREIS
- 2025-01-17 Listed $1,250,000 BAREIS
- 2024-08-12 Pending — BAREIS
- 2024-07-09 Listed $1,099,000 BAREIS
- 2023-12-11 Listed $1,099,000 BAREIS
- 2023-08-29 Delisted — BAREIS
- 2023-05-25 Price Changed $1,099,000 BAREIS
- 2023-05-25 Listed $1,199,000 BAREIS
- 2022-10-19 Price Changed $1,199,000 BAREIS
- 2022-09-20 Listed $1,299,000 BAREIS
- 2022-07-29 Pending — MLSListings
- 2022-07-29 Sold (MLS) $9,008,000 San Francisco MLS
- 2022-07-29 Sold (MLS) $9,008,000 MLSListings
- 2022-02-03 Price Changed $9,008,000 MLSListings
- 2022-01-26 Listed $9,008,000 San Francisco MLS
- 2022-01-26 Listed $7,500,000 MLSListings
- 2022-01-25 Sold (Public Records) $6,400,000 Public Records
- 2022-01-25 Sold (MLS) $7,500,000 bridgeMLS, Bay East AOR, or Contra Costa AOR
- 2022-01-25 Sold (MLS) $7,500,000 MLSListings
- 2022-01-24 Listed $7,500,000 bridgeMLS, Bay East AOR, or Contra Costa AOR
- 2022-01-24 Listed $7,500,000 MLSListings
- 2009-02-19 Listing Removed — MLSListings
- 2009-02-19 Sold (MLS) $3,200,000 MLSListings
- 2009-02-09 Contingent — MLSListings
- 2008-11-17 Price Changed $4,195,000 MLSListings
- 2008-09-22 Listed $4,995,000 MLSListings
- 2001-03-02 Sold (Public Records) $2,605,000 Public Records
- 2001-03-02 Listing Removed — MLSListings
- 2001-02-15 Sold (MLS) $2,605,000 MLSListings
- 2000-11-10 Listed $2,500,000 MLSListings
- 1990-04-23 Sold (Public Records) $1,100,000 Public Records
- 1979-10-08 Sold (Public Records) $325,000 Public Records
Property tax history
+5.1%/yrLatest (2025): $75,367 · +5.1% YoY. Source: county tax records.
Cash-flow waterfall
monthlySold comps — $/sqft
last 12 mo · ≤1 miLoading sold comps…