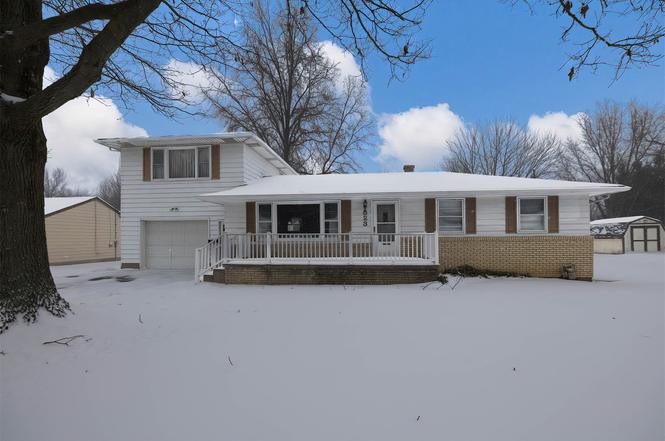
823 Walbridge Rd · Northwest Harborcreek, PA
Flood risk 3/10 · Minor
- FEMA flood zone
- X (unshaded)
- Chance of flooding over 30 yrs
- 0.1%
- Est. flood insurance / yr
- $473 – $860
Fire risk 1/10 · Minimal
- Est. fire insurance / yr
- $511 – $949
Heat risk 2/10 · Minimal
- Hot days now (above 90°F)
- 7 days/yr
- Hot days in 30 yrs
- 17 days/yr
Wind risk 1/10 · Minimal
- Chance of severe wind over 30 yrs
- —
Air-quality risk 3/10 · Minor
- Unhealthy air days now
- 4 days/yr
- Unhealthy air days in 30 yrs
- 4 days/yr
Risk factors via First Street. Map © Google.
Why this score? — see what drove the D+ grade
The composite is a weighted blend of 9 inputs, each scored 0–100. Each bar is that input's sub-score; the figure is the points it added to the 100-point composite (weight × sub-score).
- ARV discount +15.0/15.0
- Cash flow +12.3/30.0
- Schools +5.5/10.0
- Livability +4.5/5.0
- 1% rule +3.8/10.0
- DSCR +3.7/10.0
- Rent growth +2.5/5.0
- Condition / age +2.5/5.0
- Appreciation +0.0/10.0
$200,000
🖨 Deal sheet (PDF) 📄 Offer letter ✓ Due diligence
Listing remarks
Discover this well maintained mid century ranch ideally situated on almost 1/2-acre lot. The Upper-level apartment, accessible exclusively from lower level, perfect for guests or family members. Embrace the spacious back yard for gardening or outdoor activities. Key Features include one yr. old Hot water tank /walkin shower & Plus HSA warranty included for peace of mind.
Key facts
- Back yard space
- 1/2 acre lot
- Own kitchen
Tags
Property features AI
Exterior
- Parking: Attached garage; Total of 4 parking spaces (1 garage space)
- Utilities: Public water; Public sewer
- Home design: Single-family residence; One level; Residential property
- Construction: Vinyl siding; Home warranty included
- Exterior features: Composition roof; Paved road access; Private maintained road; Private road frontage; R-1 zoning
Interior
- Flooring: Carpet; Hardwood; Vinyl
- Bathrooms: 2 full bathrooms
- Heating & cooling: Forced air heating; Central air conditioning
- Interior features: Carpet, hardwood and vinyl flooring; Full basement
Neighborhood map
What this means for you Summary
Snapshot
- This is a 4-bed/1.5-bath single-family listed at $200k.
Deal economics
- At list price, monthly cash flow is $-36 ($-428/yr) — negative.
- To cash-flow at today's rent, offer at most $194k (3.2% below list).
- To meet the 1% rule (rent ≥ 1% of price), the offer needs to be $176k (11.8% below list).
- Recommended offer: $176k (11.8% below list) — sets the bar for 1% rule.
Location & tenants
- Location reads 89/100 on livability (#25 in PA, #149 nationally) — a professional / high-income tenant draw. Strengths: amenities A+, commute A+, cost of living A+.
- Harbor Creek SD (suburban): math 54% / reading 73% proficiency, ranked #53 of 539 in PA (top 10%) — acceptable for families but not a draw, mixed tenant base, ~2y average lease.
- Zoned schools: Klein El Sch (math 67% / reading 79%, grade A, #118 of 1,518 statewide, top 8%, 306 students, 43% FRL); Harbor Creek Junior Hs (math 33% / reading 64%, grade C-, #146 of 512 statewide, top 30%, 388 students, 36% FRL); Harbor Creek Senior Hs (math 92%, 614 students, 31% FRL).
- Market conditions: 49 active listings in the ZIP; 364 units permitted in Erie County in 2024 (188 in 5+ unit buildings).
Forward outlook
- Local home prices are declining (-3.0%/yr); year-one equity from $1k of loan paydown is wiped out by about $6k of value loss. Plan a longer hold.
- Erie County population projected at -14% by 2050 — secular population decline; favor cash flow + early exit over multi-decade hold.
Negotiation context
- It's been on market 96 days — a 9% lower offer ($182k) is reasonable based on typical stale-listing flexibility.
- 2 sale attempts; this cycle's ask has dropped $45k (18%) from the opening price — seller is motivated, your offer sets the floor, not the list.
Questions for the listing agent
- What do current leases actually rent for vs. the listed asking? Can we see a recent rent roll and the last 12 months of T-12 income?
- It's been on market 96 days. Have you received any prior offers? Is the seller open to a 12% concession, seller financing, or rate buy-down credit?
- Built in 1962 — when were the roof, HVAC, electrical panel, plumbing, and water heater last replaced?
- Why hasn't it sold? Are there any deal-killer items the seller is aware of (foundation, flood, title, zoning, code violations)?
- Is there a deadline driving the sale (1031 exchange, divorce, estate, relocation)? That informs how much negotiation room exists.
- Schools are D-rated, which usually means shorter tenancies and higher turnover. Who's the typical renter profile here, and what's been the actual vacancy rate?
- The area grade is low — what's the realistic commute time and amenity access for the typical tenant pool here? Any planned neighborhood developments (good or bad) we should know about?
- What's the average days-on-market for RENTAL listings here right now (not sales)? A rising rental-DOM trend means longer vacancies and softer asking-rent achievability than the comps imply.
- What's the recent tenant-quality profile in this submarket — average credit score on applications, eviction rate, late-payment / NSF rate, and stable-employment percentage? A property-management company in the area should have these aggregated.
- How much new for-sale + rental construction is in the pipeline within 1–3 miles? Heavy new supply typically softens prices + rents 12–24 months out; constrained supply supports both.
Investment metrics
- 1% rule
- 0.88% ✗
- Cap rate
- 6.08%
- Cash-on-cash
- -0.76%
- DSCR
- 0.97
- GRM
- 9.4
CMA / ARV
- ARV (on-the-fly)
- $253,398
- Comps found
- 10
Show comp detail 10 sales within ~0.75 mi
| Address | Dist | Beds/Ba | Sqft | Sold | Price | $/sf | Match |
|---|---|---|---|---|---|---|---|
| 732 Walbridge Rd | 0.07mi | 3/2.5 (-1) | 1,560 (-3%) | 10mo | $369,732 | $237 | 74 |
| 510 Parkside Dr | 0.30mi | 3/2.0 (-1) | 1,608 (-0%) | 15mo | $251,900 | $157 | 66 |
| 530 Baker Ave | 0.37mi | 4/1.0 | 1,786 (+11%) | 12mo | $218,000 | $122 | 53 |
| 731 Eldred St | 0.58mi | 3/1.0 (-1) | 1,712 (+6%) | 4mo | $250,000 | $146 | 53 |
| 323 Fair Ave | 0.56mi | 4/2.0 | 1,704 (+6%) | 11mo | $285,000 | $167 | 53 |
| 518 Bonnie Brae Rd | 0.40mi | 3/2.0 (-1) | 1,760 (+9%) | 15mo | $244,500 | $139 | 47 |
| 590 Walbridge Rd | 0.20mi | 3/2.5 (-1) | 1,822 (+13%) | 21mo | $362,000 | $199 | 42 |
| 5222 East Lake Rd | 0.70mi | 3/2.0 (-1) | 1,424 (-12%) | 1mo | $266,750 | $187 | 40 |
| 807 Eldred St | 0.58mi | 3/1.5 (-1) | 1,390 (-14%) | 10mo | $188,000 | $135 | 37 |
| 402 Bonnie Brae | 0.48mi | 3/1.5 (-1) | 1,832 (+14%) | 23mo | $282,000 | $154 | 31 |
Match score weights: distance 35% · size 25% · config 20% · recency 20%. Top-matched comps best support the ARV.
Projected returns pro-forma
-3.0% appreciation · 3.0% rent growth · sell at horizon
- IRR
- -17.5%
- Equity multiple
- 0.38×
- Total profit
- $-34,625
- Equity at exit
- $29,821
- IRR
- -9.5%
- Equity multiple
- 0.41×
- Total profit
- $-32,850
- Equity at exit
- $17,292
Cash invested: $56,000 (down + closing). Projections, not guarantees.
Landlord ↔ Tenant lean methodology
- Overall (STATE)
- 62 Landlord-Friendly
- State Pennsylvania
- 62 Landlord-Friendly · EVEN
- County
- — inherits STATE
- City
- — inherits STATE
ZIP-level market 16511
- Home prices YoY
- -24.9%
- Active inventory
- 49
- Price-to-rent
- 9.4×
Monthly cashflow live
- Estimated rent
- $1,764 medium interval (Pro) →
- Mortgage (P&I)
- −$1,049
- Tax from tax record
- −$297 /mo · $3,568/yr
- Insurance
- −$83
- HOA
- −$0
- Vacancy / Maint / Mgmt
- −$371
- Net cashflow
- $-36
Break-even live
Sensitivity live
| Price | -10% $78 | -5% $21 | +0% $-36 | +5% $-92 | +10% $-149 |
|---|---|---|---|---|---|
| Rent | -10% $-175 | -5% $-105 | +0% $-36 | +5% $34 | +10% $104 |
| Rate | -1.0pp $65 | -0.5pp $15 | base $-36 | +0.5pp $-88 | +1.0pp $-140 |
UW: 25.0% down · 7.5% · 30yr · 1.5% tax · 5.0% vac · 8.0% maint · 8.0% mgmt
Financing live
Cash to close
- Down payment
- $50,000
- Closing costs
- $6,000
- Reserves months
- —
- Total cash needed
- —
Loan-product check · same deal, 3 products live
Conventional
25% down · 7.5% · 30yr
- Down + closing
- —
- Monthly P&I
- —
- Monthly cashflow
- —
- DSCR
- —
- Eligible?
- —
Personal DTI + credit; lowest rate.
DSCR
20% down · 8.5% · 30yr
- Down + closing
- —
- Monthly P&I
- —
- Monthly cashflow
- —
- DSCR
- —
- Eligible?
- —
No personal income docs; deal must DSCR.
Hard money
10% down · 12.0% · 12mo
- Down + closing
- —
- Monthly P&I
- —
- Monthly cashflow
- —
- DSCR
- —
- Eligible?
- —
Short-term bridge; refi at stabilization.
Listing history 16 events
-
2026-06-14statusdays on market $200,000 Pending 96 DOM
-
2026-06-13days on market $200,000 Active 95 DOM
-
2026-06-10days on market $200,000 Active 93 DOM
-
2026-06-09days on market $200,000 Active 92 DOM
-
2026-06-08days on market $200,000 Active 91 DOM
-
2026-06-07days on market $200,000 Active 90 DOM
-
2026-06-05days on market $200,000 Active 87 DOM
-
2026-06-02days on market $200,000 Active 85 DOM
-
2026-06-01days on market $200,000 Active 84 DOM
-
2026-05-31days on market $200,000 Active 83 DOM
-
2026-05-30days on market $200,000 Active 82 DOM
-
2026-05-20price $200,000
-
2026-05-19status Active
-
2026-04-12status Pending
-
2026-03-25price $235,000
-
2026-01-31$245,000 Active
ⓘ Source: listings_history table (triggers on properties + properties_extension) + one-shot
backfill from property_details.listing_events for pre-trigger history.
Tax reassessment forecast PA · Partial reset (capped growth)
- Current annual tax
- $3,568 · $297/mo
- Projected year-2 tax
- $3,568 · $297/mo
- Expected delta
- $0/yr ($0/mo · 0.0%)
ⓘ Screening estimate from a state-policy table — verify with the county assessor before closing.
Climate risk First Street
- Flood 3/10 Moderate FEMA zone X (unshaded) · 10% chance over 30 yrs
- Wildfire 1/10 Low
- Heat 2/10 Low 7 d/yr ≥90°F today · 17 d/yr by 30 yrs out
- Wind 1/10 Low
- Air quality 3/10 Moderate 4 unhealthy d/yr today · 4 by 30 yrs out
Nearby sold comps map
Loading sold comps map…
Walkable amenities ~0.75 mi
Loading nearby amenities…
Taxation est. · year 1
- Rental income
- $21,172
- − Mortgage interest
- −$11,203
- − Property taxes
- −$3,568
- − Insurance
- −$1,000
- − Repairs & maintenance
- −$1,694
- − Management
- −$1,694
- − Depreciation
- −$5,818
- Taxable loss
- −$3,805
- Est. tax savings @ 24.0%
- +$913
- After-tax cash flow
- $485/yr
For passive investors: Depreciation is non-cash, so a rental often shows a tax loss while cash-flowing — sheltering income. Rental losses are passive: they offset passive income freely, and up to $25,000/yr can offset ordinary (W-2) income if you actively participate and your MAGI is under $100k (phasing out to $0 by $150k); unused losses carry forward. On sale, claimed depreciation is recaptured at up to 25%, and gains may owe capital-gains tax (a 1031 exchange can defer both). Figures are a year-1 estimate at your 24.0% rate — not tax advice; consult a CPA.
Schools (NCES district)
- District
- Harbor Creek SD
- NCES district ID
- 4211490
- Math proficiency
- 54% ▼ -13.00%
- Reading proficiency
- 73% ▼ -8.00%
- Median HH income
- $60,141
- Composite
- 54.87/100
- National rank
- #1312
- State rank
- #53 of 539 in PA
Livability — Northwest Harborcreek
- Score
- 89/100
- State rank
- #25
- US rank
- #149
Category grades
Schools grade is shown separately in the Schools card above.
Census & demographics
- Census place
- Northwest Harborcreek, PA
- City population
- 11,709
- Population (ZIP)
- 11,709
Population outlook (Erie County) Hauer SSP2
- Today (2025)
- 272,159 people
- By 2030
- 266,299 · -2.2%
- By 2040
- 250,987 · -7.8%
- By 2050
- 234,925 · -13.7%
- By 2075
- 199,164 · -26.8%
- By 2100
- 162,985 · -40.1%
Race, ethnicity, and origin ACS 2023
- Neighborhood character
- Predominantly White (80%)
- Race & ethnicity
- White 80% Black 10% Hispanic / Latino 6% Two or more races 3% Asian 1%
- Hispanic origin (detail)
- Puerto Rican 5%
- Common ancestry
- Romanian 11% Lithuanian 3% Scotch-Irish 2%
- Foreign-born
- 4% · Canada
- Languages at home
- 94% English-only · Spanish 3% Russian/Polish/Slavic 2%
Political lean MEDSL · Erie
- 2024 margin
- Toss-up / Even · D 49.0% · R 50.0%
- 2008→2024 swing
- -20.9pp toward R · 2008: 19.9pp · 2024: -1.0pp
- All cycles
- 2024: R+1.0 2020: D+1.0 2016: R+2.0 2012: D+16.9 2008: D+19.9
Not yet ingested
- Civics
- —
Market trends
- HPI YoY
- ▼ -85.06%
- Current HPI
- 256.8088
- Rent YoY
- —
- Metro
- —
- State GDP YoY
- ▲ 1.68%
- F500 in state
- 34
Industry mix (Fortune 500 HQ in PA)
| Industry | F500 HQs | Revenue |
|---|---|---|
| Healthcare | 2 | $309B |
|
||
| Insurance | 2 | $27B |
|
||
| Telecommunications / Media | 1 | $124B |
|
||
| Industrial Distribution | 1 | $22B |
|
||
| Financial Services | 1 | $20B |
|
||
| Chemicals / Materials | 1 | $18B |
|
||
Price history
-18.4% since first listed5 events — show timeline
- 2026-05-20 Price Changed $200,000 GEBOR
- 2026-05-19 Relisted — GEBOR
- 2026-04-12 Pending — GEBOR
- 2026-03-25 Price Changed $235,000 GEBOR
- 2026-01-31 Listed $245,000 GEBOR
Property tax history
+3.1%/yrLatest (2026): $3,568 · +4.5% YoY. Source: county tax records.
Cash-flow waterfall
monthlySold comps — $/sqft
last 12 mo · ≤1 miLoading sold comps…