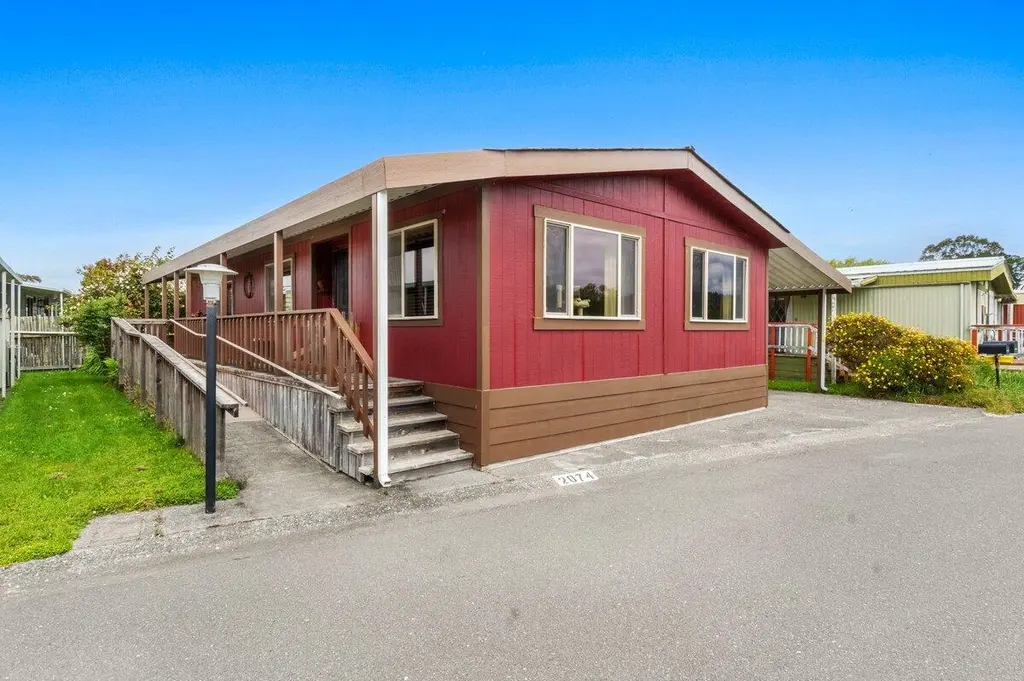
2074 Mustang Ln · Arcata, CA
Flood risk 7/10 · Major
- FEMA flood zone
- X (shaded)
- Chance of flooding over 30 yrs
- 0.99%
- Est. flood insurance / yr
- $507 – $1,088
Fire risk 3/10 · Minor
- Est. fire insurance / yr
- $659 – $1,223
Heat risk 2/10 · Minimal
- Hot days now (above 72°F)
- 8 days/yr
- Hot days in 30 yrs
- 21 days/yr
Wind risk 1/10 · Minimal
- Chance of severe wind over 30 yrs
- —
Air-quality risk 6/10 · Moderate
- Unhealthy air days now
- 9 days/yr
- Unhealthy air days in 30 yrs
- 9 days/yr
Risk factors via First Street. Map © Google.
Why this score? — see what drove the C- grade
The composite is a weighted blend of 9 inputs, each scored 0–100. Each bar is that input's sub-score; the figure is the points it added to the 100-point composite (weight × sub-score).
- Cash flow +20.8/30.0
- ARV discount +7.5/15.0
- DSCR +6.6/10.0
- 1% rule +5.5/10.0
- Rent growth +4.5/5.0
- Schools +4.1/10.0
- Livability +3.4/5.0
- Condition / age +2.2/5.0
- Appreciation +0.0/10.0
$156,000
🖨 Deal sheet 📄 Offer letter ✓ Due diligence
Listing remarks MLS
Well maintained double wide located in Lazy J Ranch Park across from duck pond. Clean and spacious 2 bedrm/ 2 bath with built in china cabinet. comes with refridge and stove; has shed; Carport with covered awning; Vaulted ceilings; Handicap ramp. Newer roof; Laminate, Carpet, Windows, screens; window coverings and paint.
Key facts
- Marsh views
- Duck pond
- Formal dining room
Tags
Property features AI
Exterior
- Parking: 1-car garage
- Utilities: Public water; Public sewer; Electricity connected (circuit breakers); Natural gas connected/available; Phone available
- Home design: Residential single-family residence; Located in a mobile home park (Lazy J Ranch); Mobile home make: Skyline; Zoned for multi-family
- Construction: Shingle roof; Pillar/post/pier foundation; Built as a mobile home
- Exterior features: Deck; Partial fencing; Outbuilding; Accessible entrance; Has a view; Level lot; Concrete and paved road access
Interior
- Kitchen: Dishwasher; Disposal; Range; Refrigerator; Range hood
- Flooring: Carpet; Laminate
- Heating & cooling: Central air conditioning; Forced air heating; Natural gas heating
- Interior features: Built-in features; Cathedral ceilings; Vaulted ceilings; Breakfast bar
- Laundry & utility: Washer hookup
Neighborhood map
What this means for you Summary
Snapshot
- This is a 2-bed/2.0-bath manufactured listed at $156k. Condition is rated fair.
Deal economics
- At list price, monthly cash flow is $147 ($2k/yr) — positive.
- The deal already cash-flows at list — no discount required.
- Meets the 1% rule at list price ($2k rent vs $156k).
- Recommended offer: $151k (3.0% below list) — sets the bar for market timing.
- Cap rate 7.9% vs local median 1.9% in Arcata — top-decile yield for the area; either an underpriced asset or a hidden risk that comps aren't pricing in. Stress-test before assuming the spread holds.
Location & tenants
- Location reads 68/100 on livability (#275 in CA) — a middle-class / working-renter tenant base. Strengths: amenities A+, health & safety A+, schools A-; Watch: housing C-, crime D-, commute F.
- Pacific Union Elementary (town): math 40% / reading 53% proficiency, ranked #560 of 1,400 in CA (top 40%) — families likely to look elsewhere, expect single-tenant / working-renter base with shorter leases.
- Market conditions: Rents rising fast (+8.1%/yr); 82 active listings in the ZIP; 188 units permitted in Humboldt County in 2024 (17 in 5+ unit buildings).
- This rent runs 37% of the median local income ($53k/yr) — at the standard rent-burdened threshold; future hikes will face affordability resistance.
Forward outlook
- Local home prices are declining (-3.0%/yr); year-one equity from $1k of loan paydown is wiped out by about $5k of value loss. Plan a longer hold.
- Humboldt County population projected to shrink 4% by 2050 — rents likely to lag national; underwrite the cash flow, not the appreciation.
- At projected returns (-3.0% appreciation + 8.0% rent growth), your $44k cash investment doubles in ~10 years — after that, you're playing with house money.
Negotiation context
- It's been on market 39 days — a 3% lower offer ($151k) is reasonable based on typical stale-listing flexibility.
- 2 sale attempts since 8y ago with the ask held roughly flat each time — persistent listings suggest the price (not the market) is what's stuck; bring a comps-based counter.
- Current owner paid $68k; list at $156k implies a 129% gain — meaningful room to come down on a strong offer.
Risks & watch-outs
- Watch-outs: flood insurance adds $66/mo.
- Climate carrying-cost: major flood risk — expect insurance premiums to compound above CPI over the hold.
Questions for the listing agent
- It's been on market 39 days. Have you received any prior offers? Is the seller open to a 3% concession, seller financing, or rate buy-down credit?
- Have any recent inspections been done? Can we get a copy of the seller's disclosures and any deferred-maintenance estimates?
- What's the actual annual flood-insurance premium (NFIP or private), and is the property in a SFHA with mandatory coverage?
- Is there a deadline driving the sale (1031 exchange, divorce, estate, relocation)? That informs how much negotiation room exists.
- Schools are A-rated — typically a magnet for longer-tenancy family renters. What's the average tenant stay here, and is there a school-zone premium baked into asking?
- Crime grade is D in this area — have there been break-ins, vandalism, or insurance claims at this property in the last 3 years? What carrier currently insures it and at what premium?
- What's the average days-on-market for RENTAL listings here right now (not sales)? A rising rental-DOM trend means longer vacancies and softer asking-rent achievability than the comps imply.
- What's the recent tenant-quality profile in this submarket — average credit score on applications, eviction rate, late-payment / NSF rate, and stable-employment percentage? A property-management company in the area should have these aggregated.
- How much new for-sale + rental construction is in the pipeline within 1–3 miles? Heavy new supply typically softens prices + rents 12–24 months out; constrained supply supports both.
Investment metrics
- 1% rule
- 1.05% ✓
- Cap rate
- 7.94%
- Cash-on-cash
- 5.87%
- DSCR
- 1.26
- GRM
- 7.9
CMA / ARV
No comps found within radius.
Projected returns pro-forma
-3.0% appreciation · 8.0% rent growth · sell at horizon
- IRR
- -4.2%
- Equity multiple
- 0.84×
- Total profit
- $-7,184
- Equity at exit
- $23,260
- IRR
- 10.8%
- Equity multiple
- 2.04×
- Total profit
- $45,432
- Equity at exit
- $13,488
Cash invested: $43,680 (down + closing). Projections, not guarantees.
Landlord ↔ Tenant lean methodology
- Overall (STATE)
- 18 Strongly Tenant-Friendly
- State California
- 18 Strongly Tenant-Friendly · D+13
- County
- — inherits STATE
- City
- — inherits STATE
ZIP-level market 95521
- Rents YoY
- 8.1%
- Active inventory
- 82
- Price-to-rent
- 7.9×
Monthly cashflow live
- Estimated rent
- $1,635 medium interval (Pro) →
- Mortgage (P&I)
- −$818
- Tax est. 1.5%
- −$195 /mo · $2,340/yr
- Insurance
- −$65
- Flood insurance flood zone
- −$66 /mo · $798/yr
- HOA
- −$0
- Vacancy / Maint / Mgmt
- −$343
- Net cashflow
- $147
Break-even live
UW: 25.0% down · 7.5% · 30yr · 1.5% tax · 5.0% vac · 8.0% maint · 8.0% mgmt
Financing live
Cash to close
- Down payment
- $39,000
- Closing costs
- $4,680
- Reserves months
- —
- Total cash needed
- —
Loan-product check · same deal, 3 products live
Conventional
25% down · 7.5% · 30yr
- Down + closing
- —
- Monthly P&I
- —
- Monthly cashflow
- —
- DSCR
- —
- Eligible?
- —
Personal DTI + credit; lowest rate.
DSCR
20% down · 8.5% · 30yr
- Down + closing
- —
- Monthly P&I
- —
- Monthly cashflow
- —
- DSCR
- —
- Eligible?
- —
No personal income docs; deal must DSCR.
Hard money
10% down · 12.0% · 12mo
- Down + closing
- —
- Monthly P&I
- —
- Monthly cashflow
- —
- DSCR
- —
- Eligible?
- —
Short-term bridge; refi at stabilization.
Listing history 20 events
-
2026-06-19days on market $156,000 Active 39 DOM
-
2026-06-18days on market $156,000 Active 38 DOM
-
2026-06-17days on market $156,000 Active 37 DOM
-
2026-06-16days on market $156,000 Active 36 DOM
-
2026-06-15days on market $156,000 Active 35 DOM
-
2026-06-14days on market $156,000 Active 33 DOM
-
2026-06-13days on market $156,000 Active 32 DOM
-
2026-06-10days on market $156,000 Active 30 DOM
-
2026-06-09days on market $156,000 Active 29 DOM
-
2026-06-08days on market $156,000 Active 28 DOM
-
2026-06-07days on market $156,000 Active 27 DOM
-
2026-06-05days on market $156,000 Active 24 DOM
-
2026-06-03days on market $156,000 Active 23 DOM
-
2026-06-02days on market $156,000 Active 22 DOM
-
2026-06-01days on market $156,000 Active 21 DOM
-
2026-05-31days on market $156,000 Active 20 DOM
-
2026-05-30days on market $156,000 Active 19 DOM
-
2026-05-11$156,000 Active
-
2018-07-16soldstatus $68,000 322-char remark
Show marketing remark (322 chars)
Well maintained double wide located in Lazy J Ranch Park across from duck pond. Clean and spacious 2 bedrm/ 2 bath with built in china cabinet. comes with refridge and stove; has shed; Carport with covered awning; Vaulted ceilings; Handicap ramp. Newer roof; Laminate, Carpet, Windows, screens; window coverings and paint.
-
2018-06-10$72,500 322-char remark
Show marketing remark (322 chars)
Well maintained double wide located in Lazy J Ranch Park across from duck pond. Clean and spacious 2 bedrm/ 2 bath with built in china cabinet. comes with refridge and stove; has shed; Carport with covered awning; Vaulted ceilings; Handicap ramp. Newer roof; Laminate, Carpet, Windows, screens; window coverings and paint.
ⓘ Source: listings_history table (triggers on properties + properties_extension) + one-shot
backfill from property_details.listing_events for pre-trigger history.
Climate risk First Street
- Flood 7/10 Severe FEMA zone X (shaded) · 99% chance over 30 yrs
- Wildfire 3/10 Moderate
- Heat 2/10 Low 8 d/yr ≥72°F today · 21 d/yr by 30 yrs out
- Wind 1/10 Low
- Air quality 6/10 Major 9 unhealthy d/yr today · 9 by 30 yrs out
Nearby sold comps map
Loading sold comps map…
Walkable amenities ~0.75 mi
Loading nearby amenities…
Taxation est. · year 1
- Rental income
- $19,624
- − Mortgage interest
- −$8,738
- − Property taxes
- −$2,340
- − Insurance
- −$1,577
- − Repairs & maintenance
- −$1,570
- − Management
- −$1,570
- − Depreciation
- −$4,538
- Taxable loss
- −$710
- Est. tax savings @ 24.0%
- +$170
- After-tax cash flow
- $1,939/yr
For passive investors: Depreciation is non-cash, so a rental often shows a tax loss while cash-flowing — sheltering income. Rental losses are passive: they offset passive income freely, and up to $25,000/yr can offset ordinary (W-2) income if you actively participate and your MAGI is under $100k (phasing out to $0 by $150k); unused losses carry forward. On sale, claimed depreciation is recaptured at up to 25%, and gains may owe capital-gains tax (a 1031 exchange can defer both). Figures are a year-1 estimate at your 24.0% rate — not tax advice; consult a CPA.
Condition & rehab AI · 12 photos
This doublewide mobile home requires moderate renovations to update dated cabinets and walls, but is otherwise in good condition with a good exterior and yard. Updates to the kitchen and bathroom would significantly increase its resale and rental value.
Repairs flagged
- Major kitchen cabinets — dated and worn
- Major bathroom cabinets — dated and worn
- Major interior walls — floral wallpaper and paneling
Value-add opportunities
- Resale update kitchen cabinets — modernizing kitchen
- Resale update bathroom cabinets — modernizing bathroom
- Both paint interior walls — enhances interior aesthetics
- Both replace carpet — improves comfort and appearance
Renovation cost estimate screening
| Repair item | Severity | Est. cost |
|---|---|---|
| kitchen cabinets · dated and worn | Major | $15,000–50,000 |
| bathroom cabinets · dated and worn | Major | $15,000–50,000 |
| interior walls · floral wallpaper and paneling | Major | $15,000–50,000 |
| Total estimated repair cost · 3 items | $45,000–150,000 |
Value-add ROI direction
- Resale update kitchen cabinets — modernizing kitchen ↑
- Resale update bathroom cabinets — modernizing bathroom ↑
- Both paint interior walls — enhances interior aesthetics ↑
- Both replace carpet — improves comfort and appearance ↑
ⓘ Cost ranges are severity-bucket heuristics (US national rule-of-thumb). Get contractor quotes + a written scope before underwriting a rehab budget.
Schools (NCES district)
- District
- Pacific Union Elementary
- NCES district ID
- 0629430
- Math proficiency
- 40% ▼ -2.00%
- Reading proficiency
- 53% ▲ 5.00%
- Median HH income
- $40,146
- Composite
- 41.08/100
- National rank
- #7442
- State rank
- #560 of 1400 in CA
Livability — Arcata
- Score
- 68/100
- State rank
- #275
- US rank
- #9258
Category grades
Schools grade is shown separately in the Schools card above.
Census & demographics
- Census place
- Arcata, CA
- County
- Humboldt County · 88,652 people
- City population
- 21,980
- Metro
- Eureka-Arcata, CA
- Population (ZIP)
- 21,980
- Household income
- $53,114
- Rent vs Own
- Severe rent burden
- 2139.0
Population outlook (Humboldt County) Hauer SSP2
- Today (2025)
- 135,550 people
- By 2030
- 134,798 · -0.6%
- By 2040
- 132,222 · -2.5%
- By 2050
- 130,850 · -3.5%
- By 2075
- 128,656 · -5.1%
- By 2100
- 120,238 · -11.3%
Race, ethnicity, and origin ACS 2023
- Neighborhood character
- Predominantly White (72%)
- Race & ethnicity
- White 72% Hispanic / Latino 15% Two or more races 13% Asian 2% Black 2% Native American 1%
- Hispanic origin (detail)
- Mexican 11% Puerto Rican 2%
- Common ancestry
- Lithuanian 5% Russian 5% Italian 4%
- Foreign-born
- 6% · Canada
- Languages at home
- 87% English-only · Spanish 8% Other Indo-European 2% Other Asian/Pacific 1%
Political lean MEDSL · Humboldt
- 2024 margin
- Strong D (+28.4) · D 62.0% · R 33.6% · Other 4.5%
- 2008→2024 swing
- +0.2pp no change · 2008: 28.2pp · 2024: 28.4pp
- All cycles
- 2024: D+28.4 2020: D+33.4 2016: D+25.9 2012: D+26.2 2008: D+28.2
Not yet ingested
- Civics
- —
Market trends
- HPI YoY
- ▼ -373.51%
- Current HPI
- 208.5938
- Rent YoY
- ▲ 8.08%
- Metro
- Eureka-Arcata, CA
- State GDP YoY
- ▲ 3.21%
- F500 in state
- 116
Industry mix (Fortune 500 HQ in CA)
| Industry | F500 HQs | Revenue |
|---|---|---|
| Technology | 27 | $1,492B |
|
||
| Financial Services | 3 | $174B |
|
||
| Retail | 3 | $44B |
|
||
| Insurance | 3 | $26B |
|
||
| Media / Entertainment | 2 | $115B |
|
||
| Pharmaceuticals / Biotech | 2 | $62B |
|
||
Price history
+115.2% since first listed3 events — show timeline
- 2026-05-11 Listed $156,000 HAR
- 2018-07-16 Sold (MLS) $68,000 HAR
- 2018-06-10 Listed $72,500 HAR
Cash-flow waterfall
monthlySold comps — $/sqft
last 12 mo · ≤1 miLoading sold comps…