40 Luther Ln · Bolivar, TN
Flood risk 1/10 · Minimal
- FEMA flood zone
- X (unshaded)
- Chance of flooding over 30 yrs
- 0.0%
- Est. flood insurance / yr
- $507 – $1,088
Fire risk 5/10 · Moderate
- Est. fire insurance / yr
- $949 – $1,763
Heat risk 6/10 · Moderate
- Hot days now (above 109°F)
- 7 days/yr
- Hot days in 30 yrs
- 19 days/yr
Wind risk 4/10 · Minor
- Chance of severe wind over 30 yrs
- 14.0%
Air-quality risk 2/10 · Minimal
- Unhealthy air days now
- 0 days/yr
- Unhealthy air days in 30 yrs
- 1 days/yr
Risk factors via First Street. Map © Google.
Why this score? — see what drove the B- grade
The composite is a weighted blend of 9 inputs, each scored 0–100. Each bar is that input's sub-score; the figure is the points it added to the 100-point composite (weight × sub-score).
- Cash flow +30.0/30.0
- 1% rule +10.0/10.0
- DSCR +10.0/10.0
- ARV discount +7.5/15.0
- Livability +2.6/5.0
- Rent growth +2.5/5.0
- Condition / age +2.5/5.0
- Schools +1.1/10.0
- Appreciation +0.0/10.0
$69,995
🖨 Deal sheet 📄 Offer letter ✓ Due diligence
Listing remarks
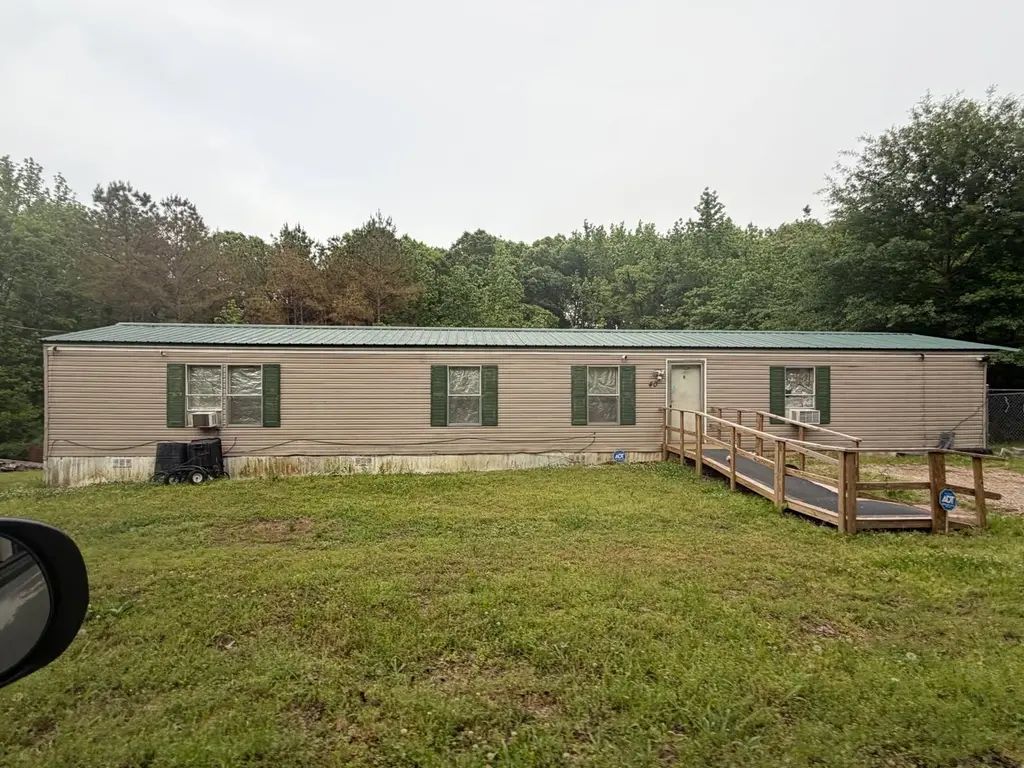
Charming 3 bed, 2 bath home on a spacious 0.7-acre lot. Enjoy a functional layout with comfortable living spaces and a durable metal roof. The large yard offers room to grow, garden, or relax. A solid property with great potential, ready for its next owner.
Key facts
- Metal roof
- Large yard
- Spacious lot
Tags
Property features AI
Finance
- Other: Windows listed as energy-efficient feature
Exterior
- Parking: No covered spaces reported; No total parking spaces reported
- Utilities: Public water; Public sewer; Electricity available
- Home design: Residential mobile home; One level
- Construction: Frame construction; Metal roof; Crawl space foundation; Built/existing structure
- Exterior features: Chain link fencing; Approximately 0.7-acre lot
Interior
- Kitchen: Pantry; Electric oven; Electric range
- Bedrooms: 3 bedrooms (all on the main level); Bedroom sizes approximately 15 x 13, 12 x 11, and 11 x 10
- Flooring: Vinyl flooring
- Bathrooms: 2 full bathrooms; Master bath includes a double vanity
- Heating & cooling: Central electric heating; Central electric air conditioning
- Interior features: Ceiling fans
- Laundry & utility: Has heating and cooling systems
Neighborhood map
What this means for you Summary
Snapshot
- This is a 3-bed/2.0-bath manufactured listed at $70k.
Deal economics
- At list price, monthly cash flow is $561 ($7k/yr) — positive.
- The deal already cash-flows at list — no discount required.
- Meets the 1% rule at list price ($1k rent vs $70k).
- Recommended offer: $69k (1.5% below list) — sets the bar for market timing.
Location & tenants
- Location reads 52/100 on livability (#397 in TN) — a working-class tenant base; expect higher turnover. Strengths: cost of living A+, housing A; Watch: health & safety C-, crime F, amenities F.
- Hardeman County Schools (rural): math 11% / reading 16% proficiency, ranked #133 of 139 in TN (top 96%) — low school quality limits family demand, transient renter base, plan for 1-2y turnover; 73% free/reduced lunch — lower-income household profile, screen leases tightly.
- Zoned schools: Bolivar Elementary (math 14% / reading 17%, grade F, #745 of 952 statewide, top 79%, 756 students, 0% FRL); Central High School (math 2% / reading 22%, grade F, #259 of 332 statewide, top 79%, 697 students, 0% FRL) — zoned schools average 0% FRL vs 73% district-wide (73 pts lower); this property's tenant base skews higher-income than the district average.
- Market conditions: 57 active listings in the ZIP; 43 units permitted in Hardeman County in 2024 (0 in 5+ unit buildings).
Forward outlook
- Local home prices are declining (-3.0%/yr); year-one equity from $484 of loan paydown is wiped out by about $2k of value loss. Plan a longer hold.
- Hardeman County population projected at -25% by 2050 — secular population decline; favor cash flow + early exit over multi-decade hold.
- At projected returns (-3.0% appreciation + 3.0% rent growth), your $20k cash investment doubles in ~4 years — after that, you're playing with house money.
Negotiation context
- It's been on market 15 days — a 2% lower offer ($69k) is reasonable based on typical stale-listing flexibility.
Risks & watch-outs
- Climate carrying-cost: moderate wildfire risk; extreme-heat days projected 7→19/yr by 2055 (HVAC capex compounding) — expect insurance premiums to compound above CPI over the hold.
Questions for the listing agent
- Is there a deadline driving the sale (1031 exchange, divorce, estate, relocation)? That informs how much negotiation room exists.
- Schools are F-rated, which usually means shorter tenancies and higher turnover. Who's the typical renter profile here, and what's been the actual vacancy rate?
- Crime grade is F in this area — have there been break-ins, vandalism, or insurance claims at this property in the last 3 years? What carrier currently insures it and at what premium?
- What's the average days-on-market for RENTAL listings here right now (not sales)? A rising rental-DOM trend means longer vacancies and softer asking-rent achievability than the comps imply.
- What's the recent tenant-quality profile in this submarket — average credit score on applications, eviction rate, late-payment / NSF rate, and stable-employment percentage? A property-management company in the area should have these aggregated.
- How much new for-sale + rental construction is in the pipeline within 1–3 miles? Heavy new supply typically softens prices + rents 12–24 months out; constrained supply supports both.
Investment metrics
- 1% rule
- 1.77% ✓
- Cap rate
- 15.90%
- Cash-on-cash
- 34.33%
- DSCR
- 2.53
- GRM
- 4.7
CMA / ARV
No comps found within radius.
Projected returns pro-forma
-3.0% appreciation · 3.0% rent growth · sell at horizon
- IRR
- 29.7%
- Equity multiple
- 2.24×
- Total profit
- $24,342
- Equity at exit
- $10,436
- IRR
- 37.0%
- Equity multiple
- 4.42×
- Total profit
- $67,085
- Equity at exit
- $6,052
Cash invested: $19,599 (down + closing). Projections, not guarantees.
Landlord ↔ Tenant lean methodology
- Overall (STATE)
- 87 Strongly Landlord-Friendly
- State Tennessee
- 87 Strongly Landlord-Friendly · R+13
- County
- — inherits STATE
- City
- — inherits STATE
ZIP-level market 38008
- Home prices YoY
- -11.4%
- Active inventory
- 57
- Price-to-rent
- 4.7×
Monthly cashflow live
- Estimated rent
- $1,238 medium interval (Pro) →
- Mortgage (P&I)
- −$367
- Tax from tax record
- −$21 /mo · $254/yr
- Insurance
- −$29
- HOA
- −$0
- Vacancy / Maint / Mgmt
- −$260
- Net cashflow
- $561
Break-even live
UW: 25.0% down · 7.5% · 30yr · 1.5% tax · 5.0% vac · 8.0% maint · 8.0% mgmt
Financing live
Cash to close
- Down payment
- $17,499
- Closing costs
- $2,100
- Reserves months
- —
- Total cash needed
- —
Loan-product check · same deal, 3 products live
Conventional
25% down · 7.5% · 30yr
- Down + closing
- —
- Monthly P&I
- —
- Monthly cashflow
- —
- DSCR
- —
- Eligible?
- —
Personal DTI + credit; lowest rate.
DSCR
20% down · 8.5% · 30yr
- Down + closing
- —
- Monthly P&I
- —
- Monthly cashflow
- —
- DSCR
- —
- Eligible?
- —
No personal income docs; deal must DSCR.
Hard money
10% down · 12.0% · 12mo
- Down + closing
- —
- Monthly P&I
- —
- Monthly cashflow
- —
- DSCR
- —
- Eligible?
- —
Short-term bridge; refi at stabilization.
Listing history 1 events
-
2026-05-05$69,995 Active 257-char remark
ⓘ Source: listings_history table (triggers on properties + properties_extension) + one-shot
backfill from property_details.listing_events for pre-trigger history.
Tax reassessment forecast TN · Resets to sale price
- Current annual tax
- $254 · $21/mo
- Projected year-2 tax
- $497 · $41/mo
- Expected delta
- +$243/yr (+$20/mo · 95.7%)
ⓘ Screening estimate from a state-policy table — verify with the county assessor before closing.
Climate risk First Street
- Flood 1/10 Low FEMA zone X (unshaded) · 0% chance over 30 yrs
- Wildfire 5/10 Major
- Heat 6/10 Major 7 d/yr ≥109°F today · 19 d/yr by 30 yrs out
- Wind 4/10 Moderate 14% chance of damaging wind over 30 yrs
- Air quality 2/10 Low 0 unhealthy d/yr today · 1 by 30 yrs out
Nearby sold comps map
Loading sold comps map…
Walkable amenities ~0.75 mi
Loading nearby amenities…
Taxation est. · year 1
- Rental income
- $14,856
- − Mortgage interest
- −$3,921
- − Property taxes
- −$254
- − Insurance
- −$350
- − Repairs & maintenance
- −$1,188
- − Management
- −$1,188
- − Depreciation
- −$2,036
- Taxable income
- $5,918
- Est. tax owed @ 24.0%
- −$1,420
- After-tax cash flow
- $5,307/yr
For passive investors: Depreciation is non-cash, so a rental often shows a tax loss while cash-flowing — sheltering income. Rental losses are passive: they offset passive income freely, and up to $25,000/yr can offset ordinary (W-2) income if you actively participate and your MAGI is under $100k (phasing out to $0 by $150k); unused losses carry forward. On sale, claimed depreciation is recaptured at up to 25%, and gains may owe capital-gains tax (a 1031 exchange can defer both). Figures are a year-1 estimate at your 24.0% rate — not tax advice; consult a CPA.
Schools (NCES district)
- District
- Hardeman County Schools
- NCES district ID
- 4701650
- Math proficiency
- 11% ▼ -11.00%
- Reading proficiency
- 16% ▼ -6.00%
- Median HH income
- $33,190
- Composite
- 10.9/100
- National rank
- #9754
- State rank
- #133 of 139 in TN
Livability — Bolivar
- Score
- 52/100
- State rank
- #397
- US rank
- #24758
Category grades
Schools grade is shown separately in the Schools card above.
Census & demographics
- City population
- 9,351
- Population (ZIP)
- 9,351
Population outlook (Hardeman County) Hauer SSP2
- Today (2025)
- 23,629 people
- By 2030
- 22,413 · -5.1%
- By 2040
- 19,910 · -15.7%
- By 2050
- 17,692 · -25.1%
- By 2075
- 13,532 · -42.7%
- By 2100
- 10,178 · -56.9%
Race, ethnicity, and origin ACS 2023
- Neighborhood character
- Majority Black (59%)
- Race & ethnicity
- Black 59% White 35% Two or more races 6% Hispanic / Latino 2%
- Common ancestry
- Italian 1%
- Foreign-born
- 0%
Political lean MEDSL · Hardeman
- 2024 margin
- Strong R (+24.1) · D 37.5% · R 61.6%
- 2008→2024 swing
- -30.3pp toward R · 2008: 6.2pp · 2024: -24.1pp
- All cycles
- 2024: R+24.1 2020: R+15.7 2016: R+8.0 2012: D+5.9 2008: D+6.2
Not yet ingested
- Civics
- —
Market trends
- HPI YoY
- ▼ -31.15%
- Current HPI
- 241.1615
- Rent YoY
- —
- Metro
- —
- State GDP YoY
- ▲ 2.78%
- F500 in state
- 22
Industry mix (Fortune 500 HQ in TN)
| Industry | F500 HQs | Revenue |
|---|---|---|
| Healthcare | 3 | $91B |
|
||
| Retail | 3 | $72B |
|
||
| Transportation / Logistics | 1 | $88B |
|
||
| Paper / Packaging | 1 | $19B |
|
||
| Insurance | 1 | $13B |
|
||
| Energy | 1 | $12B |
|
||
Price history
2 events — show timeline
- 2026-05-21 Pending — REALTRACS as Distributed by MLS Grid
- 2026-05-05 Listed $69,995 REALTRACS as Distributed by MLS Grid
Property tax history
+4.1%/yrLatest (2025): $254 · +7.6% YoY. Source: county tax records.
Cash-flow waterfall
monthlySold comps — $/sqft
last 12 mo · ≤1 miLoading sold comps…