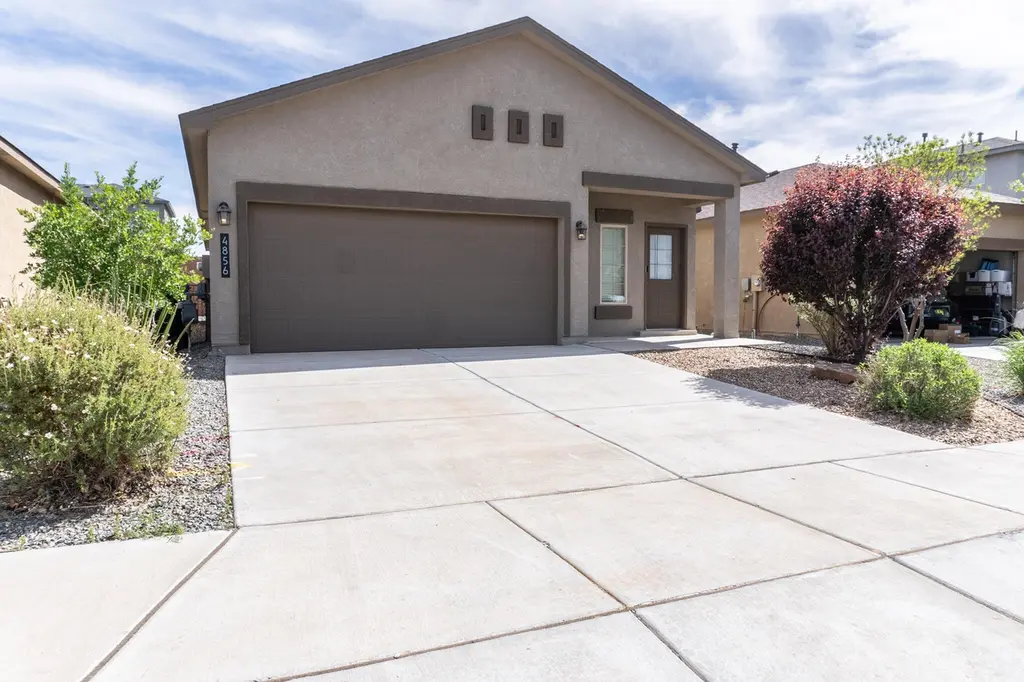
4856 Kings Peak Rd NE · Rio Rancho, NM
Flood risk No data
- FEMA flood zone
- —
- Chance of flooding over 30 yrs
- —
- Est. flood insurance / yr
- —
Fire risk No data
- Est. fire insurance / yr
- —
Heat risk No data
- Hot days now (above threshold)
- —
- Hot days in 30 yrs
- —
Wind risk No data
- Chance of severe wind over 30 yrs
- —
Air-quality risk No data
- Unhealthy air days now
- —
- Unhealthy air days in 30 yrs
- —
Risk factors via First Street. Map © Google.
Why this score? — see what drove the D- grade
The composite is a weighted blend of 9 inputs, each scored 0–100. Each bar is that input's sub-score; the figure is the points it added to the 100-point composite (weight × sub-score).
- ARV discount +11.8/15.0
- Cash flow +7.6/30.0
- Schools +5.2/10.0
- Rent growth +4.2/5.0
- Livability +3.6/5.0
- Condition / age +2.5/5.0
- 1% rule +2.3/10.0
- DSCR +1.7/10.0
- Appreciation +0.0/10.0
$340,000
🖨 Deal sheet (PDF) 📄 Offer letter ✓ Due diligence
Listing remarks
* * * SELLER IS OFFERING A $5000 CLOSING COST CREDIT * * * * Welcome to this charming 3-bedroom, 2-bath home in the heart of Rio Rancho! Designed with an open-concept layout, this home offers a seamless flow between the living, dining, and kitchen areas perfect for both everyday living and entertaining. The kitchen overlooks the main living space, creating a bright and inviting atmosphere. Tile flooring in all wet areas adds durability and easy maintenance, while the spacious bedrooms provide comfort and flexibility. The primary suite features its own private bath for added convenience. Located near schools, shopping, and dining, this home offers both comfort and convenience in a growi
Key facts
- Near schools
- Near dining
- Near shopping
Tags
Property features AI
Finance
- HOA & community: Homeowners association with a $30 monthly fee (covers common areas)
Exterior
- Parking: Attached 2-car garage
- Utilities: Electricity connected; Natural gas connected; Public water; Public sewer
- Home design: Single-story; Faces north; Resale property; Built by DR Horton
- Construction: Frame construction; Pitched roof
- Exterior features: Open patio
Interior
- Kitchen: Dishwasher; Free-standing gas range; Microwave
- Bedrooms: Primary bedroom on the main level
- Flooring: Carpet; Tile
- Bathrooms: 2 full bathrooms
- Heating & cooling: Natural gas heating; Refrigerated (central) cooling
- Interior features: Thermal windows; Main level primary bedroom
- Laundry & utility: Gas dryer hookup
Neighborhood map
What this means for you Summary
Snapshot
- This is a 3-bed/2.0-bath single-family listed at $340k.
Deal economics
- At list price, monthly cash flow is $-410 ($-5k/yr) — negative.
- To cash-flow at today's rent, offer at most $281k (17.5% below list).
- To meet the 1% rule (rent ≥ 1% of price), the offer needs to be $249k (26.7% below list).
- Recommended offer: $249k (26.7% below list) — sets the bar for 1% rule.
- Cap rate 4.8% vs local median 3.6% in Rio Rancho — top-decile yield for the area; either an underpriced asset or a hidden risk that comps aren't pricing in. Stress-test before assuming the spread holds.
Location & tenants
- Location reads 71/100 on livability (#17 in NM) — a middle-class / working-renter tenant base. Strengths: housing A+, cost of living A; Watch: schools C-, amenities D, commute F.
- Rio Rancho Public Schools (suburban): math 48% / reading 73% proficiency, ranked #4 of 29 in NM (top 14%) — acceptable for families but not a draw, mixed tenant base, ~2y average lease.
- Market conditions: Rents rising fast (+6.9%/yr); 1315 active listings in the ZIP; 2 comparable units currently listed for rent nearby; solid renter incomes; 1,278 units permitted in Sandoval County in 2024 (216 in 5+ unit buildings).
- This rent runs 32% of the median local income ($95k/yr) — at the standard rent-burdened threshold; future hikes will face affordability resistance.
Forward outlook
- Local home prices are declining (-3.0%/yr); year-one equity from $2k of loan paydown is wiped out by about $10k of value loss. Plan a longer hold.
- Sandoval County population projected at +15% by 2050 — long-run rental-demand tailwind backs the buy-and-hold thesis.
Negotiation context
- Only 11 days on market — expect competitive offers; lowballing is unlikely to land.
Questions for the listing agent
- What do current leases actually rent for vs. the listed asking? Can we see a recent rent roll and the last 12 months of T-12 income?
- What does the HOA fee cover, when was the last increase, and are there any pending special assessments or reserve-fund shortfalls?
- Is there a deadline driving the sale (1031 exchange, divorce, estate, relocation)? That informs how much negotiation room exists.
- The area grade is low — what's the realistic commute time and amenity access for the typical tenant pool here? Any planned neighborhood developments (good or bad) we should know about?
- What's the average days-on-market for RENTAL listings here right now (not sales)? A rising rental-DOM trend means longer vacancies and softer asking-rent achievability than the comps imply.
- What's the recent tenant-quality profile in this submarket — average credit score on applications, eviction rate, late-payment / NSF rate, and stable-employment percentage? A property-management company in the area should have these aggregated.
- How much new for-sale + rental construction is in the pipeline within 1–3 miles? Heavy new supply typically softens prices + rents 12–24 months out; constrained supply supports both.
Investment metrics
- 1% rule
- 0.73% ✗
- Cap rate
- 4.85%
- Cash-on-cash
- -5.17%
- DSCR
- 0.77
- GRM
- 11.4
CMA / ARV
- ARV (median comp)
- $375,769
- List price
- $340,000
- Delta
- -9.52%
- Verdict
- FAIR
- Comps
- 20 within 1.0 mi
Show comp detail 12 sales within ~0.75 mi
| Address | Dist | Beds/Ba | Sqft | Sold | Price | $/sf | Match |
|---|---|---|---|---|---|---|---|
| 4860 Blackburn Rd NE | 0.05mi | 3/2.0 | 1,653 (0%) | 4mo | $329,000 | $199 | 94 |
| 4847 Longs Peak Rd NE | 0.03mi | 3/2.0 | 1,559 (-6%) | 4mo | $325,000 | $208 | 86 |
| 4827 Sandia Peak Rd NE | 0.09mi | 4/2.0 (+1) | 1,602 (-3%) | 2mo | $360,000 | $225 | 84 |
| 4814 Mount Salas St NE | 0.18mi | 4/2.0 (+1) | 1,598 (-3%) | 0mo | $360,000 | $225 | 81 |
| 4890 Sandia Peak Rd NE | 0.12mi | 4/2.0 (+1) | 1,602 (-3%) | 6mo | $335,000 | $209 | 79 |
| 4819 Blackburn Rd NE | 0.10mi | 3/2.0 | 1,481 (-10%) | 4mo | $344,900 | $233 | 74 |
| 4904 Long's Peak Rd NE | 0.11mi | 3/2.0 | 1,480 (-10%) | 6mo | $335,000 | $226 | 73 |
| 4385 Golden Eagle Loop NE | 0.65mi | 3/2.0 | 1,697 (+3%) | 1mo | $369,900 | $218 | 65 |
| 6404 Red Falcon Dr NE | 0.59mi | 3/2.0 | 1,491 (-10%) | 2mo | $360,000 | $241 | 55 |
| 4381 Golden Eagle Loop NE | 0.66mi | 3/2.0 | 1,495 (-10%) | 1mo | $357,000 | $239 | 53 |
| 4433 Golden Eagle Loop NE | 0.54mi | 4/2.0 (+1) | 1,872 (+13%) | 1mo | $389,900 | $208 | 47 |
| 4313 Bald Eagle Loop NE | 0.64mi | 3/3.0 | 1,841 (+11%) | 2mo | $370,000 | $201 | 46 |
Match score weights: distance 35% · size 25% · config 20% · recency 20%. Top-matched comps best support the ARV.
Projected returns pro-forma
-3.0% appreciation · 6.88% rent growth · sell at horizon
- IRR
- -20.8%
- Equity multiple
- 0.25×
- Total profit
- $-71,045
- Equity at exit
- $50,695
- IRR
- -7.1%
- Equity multiple
- 0.47×
- Total profit
- $-50,316
- Equity at exit
- $29,397
Cash invested: $95,200 (down + closing). Projections, not guarantees.
Landlord ↔ Tenant lean methodology
- Overall (STATE)
- 55 Moderately Landlord-Leaning
- State New Mexico
- 55 Moderately Landlord-Leaning · D+3
- County
- — inherits STATE
- City
- — inherits STATE
ZIP-level market 87144
- Home prices YoY
- -30.8%
- Rents YoY
- 6.9%
- Active inventory
- 1315
- Price-to-rent
- 11.4×
Monthly cashflow live
- Estimated rent
- $2,493 medium interval (Pro) →
- Mortgage (P&I)
- −$1,783
- Tax est. 1.5%
- −$425 /mo · $5,100/yr
- Insurance
- −$142
- HOA
- −$30
- Vacancy / Maint / Mgmt
- −$524
- Net cashflow
- $-410
Break-even live
Sensitivity live
| Price | -10% $-175 | -5% $-293 | +0% $-410 | +5% $-528 | +10% $-645 |
|---|---|---|---|---|---|
| Rent | -10% $-607 | -5% $-509 | +0% $-410 | +5% $-312 | +10% $-213 |
| Rate | -1.0pp $-239 | -0.5pp $-324 | base $-410 | +0.5pp $-498 | +1.0pp $-588 |
UW: 25.0% down · 7.5% · 30yr · 1.5% tax · 5.0% vac · 8.0% maint · 8.0% mgmt
Financing live
Cash to close
- Down payment
- $85,000
- Closing costs
- $10,200
- Reserves months
- —
- Total cash needed
- —
Loan-product check · same deal, 3 products live
Conventional
25% down · 7.5% · 30yr
- Down + closing
- —
- Monthly P&I
- —
- Monthly cashflow
- —
- DSCR
- —
- Eligible?
- —
Personal DTI + credit; lowest rate.
DSCR
20% down · 8.5% · 30yr
- Down + closing
- —
- Monthly P&I
- —
- Monthly cashflow
- —
- DSCR
- —
- Eligible?
- —
No personal income docs; deal must DSCR.
Hard money
10% down · 12.0% · 12mo
- Down + closing
- —
- Monthly P&I
- —
- Monthly cashflow
- —
- DSCR
- —
- Eligible?
- —
Short-term bridge; refi at stabilization.
Rent comps 2 comps
| Address | Beds | Baths | Sqft | Rent | $/sqft | DOM | Units | Dist |
|---|---|---|---|---|---|---|---|---|
| 4872 Blackburn Rd NE Rio Rancho, NM | 4.0 | 2.5 | 2078 | $2,689 | $1.29 | 2d | 1 | 0.09mi |
| 5714 Quay Dr NE Rio Rancho, NM | 3.0 | 2.5 | 2047 | $2,200 | $1.07 | 2d | 1 | 1.37mi |
HOA detail
- Monthly dues
- $30 · $360/yr
Listing history 2 events
-
2026-05-06status Pending 712-char remark
-
2026-04-13$340,000 Active 712-char remark
ⓘ Source: listings_history table (triggers on properties + properties_extension) + one-shot
backfill from property_details.listing_events for pre-trigger history.
Nearby sold comps map
Loading sold comps map…
Walkable amenities ~0.75 mi
Loading nearby amenities…
Taxation est. · year 1
- Rental income
- $29,918
- − Mortgage interest
- −$19,045
- − Property taxes
- −$5,100
- − Insurance
- −$1,700
- − Repairs & maintenance
- −$2,393
- − Management
- −$2,393
- − HOA
- −$360
- − Depreciation
- −$9,891
- Taxable loss
- −$10,965
- Est. tax savings @ 24.0%
- +$2,632
- After-tax cash flow
- $-2,289/yr
For passive investors: Depreciation is non-cash, so a rental often shows a tax loss while cash-flowing — sheltering income. Rental losses are passive: they offset passive income freely, and up to $25,000/yr can offset ordinary (W-2) income if you actively participate and your MAGI is under $100k (phasing out to $0 by $150k); unused losses carry forward. On sale, claimed depreciation is recaptured at up to 25%, and gains may owe capital-gains tax (a 1031 exchange can defer both). Figures are a year-1 estimate at your 24.0% rate — not tax advice; consult a CPA.
Schools (NCES district)
- District
- Rio Rancho Public Schools
- NCES district ID
- 3500010
- Math proficiency
- 48% ▲ 38.00%
- Reading proficiency
- 73% ▲ 48.00%
- Median HH income
- $59,410
- Composite
- 52.29/100
- National rank
- #1595
- State rank
- #4 of 29 in NM
Livability — Rio Rancho
- Score
- 71/100
- State rank
- #17
- US rank
- #7253
Category grades
Schools grade is shown separately in the Schools card above.
Census & demographics
- Census place
- Rio Rancho, NM
- County
- Sandoval County · 110,336 people
- City population
- 110,336
- Metro
- Albuquerque, NM
- Population (ZIP)
- 51,837
- Household income
- $94,550
- Rent vs Own
- Severe rent burden
- 528.0
Population outlook (Sandoval County) Hauer SSP2
- Today (2025)
- 155,072 people
- By 2030
- 161,714 · +4.3%
- By 2040
- 171,831 · +10.8%
- By 2050
- 178,536 · +15.1%
- By 2075
- 192,517 · +24.1%
- By 2100
- 197,952 · +27.7%
Race, ethnicity, and origin ACS 2023
- Neighborhood character
- Diverse neighborhood (Simpson 0.61)
- Race & ethnicity
- White 44% Hispanic / Latino 44% Two or more races 24% Native American 4% Black 3% Asian 1%
- Hispanic origin (detail)
- Mexican 23% Puerto Rican 1%
- Common ancestry
- Slovak 3% Lithuanian 3% Italian 2%
- Foreign-born
- 5% · Canada
- Languages at home
- 80% English-only · Spanish 16%
Political lean MEDSL · Sandoval
- 2024 margin
- Lean D (+5.8) · D 51.8% · R 46.0% · Other 2.2%
- 2008→2024 swing
- -7.0pp toward R · 2008: 12.8pp · 2024: 5.8pp
- All cycles
- 2024: D+5.8 2020: D+8.4 2016: D+2.7 2012: D+5.1 2008: D+12.8
Not yet ingested
- Civics
- —
Market trends
- HPI YoY
- ▼ -95.68%
- Current HPI
- 215.124
- Rent YoY
- ▲ 6.88%
- Metro
- Albuquerque, NM
- State GDP YoY
- —
- F500 in state
- 0
Price history
2 events — show timeline
- 2026-05-06 Pending — Southwest MLS
- 2026-04-13 Listed $340,000 Southwest MLS
Cash-flow waterfall
monthlySold comps — $/sqft
last 12 mo · ≤1 miLoading sold comps…