 Multi-family
🌊 Lakefront
Multi-family
🌊 Lakefront
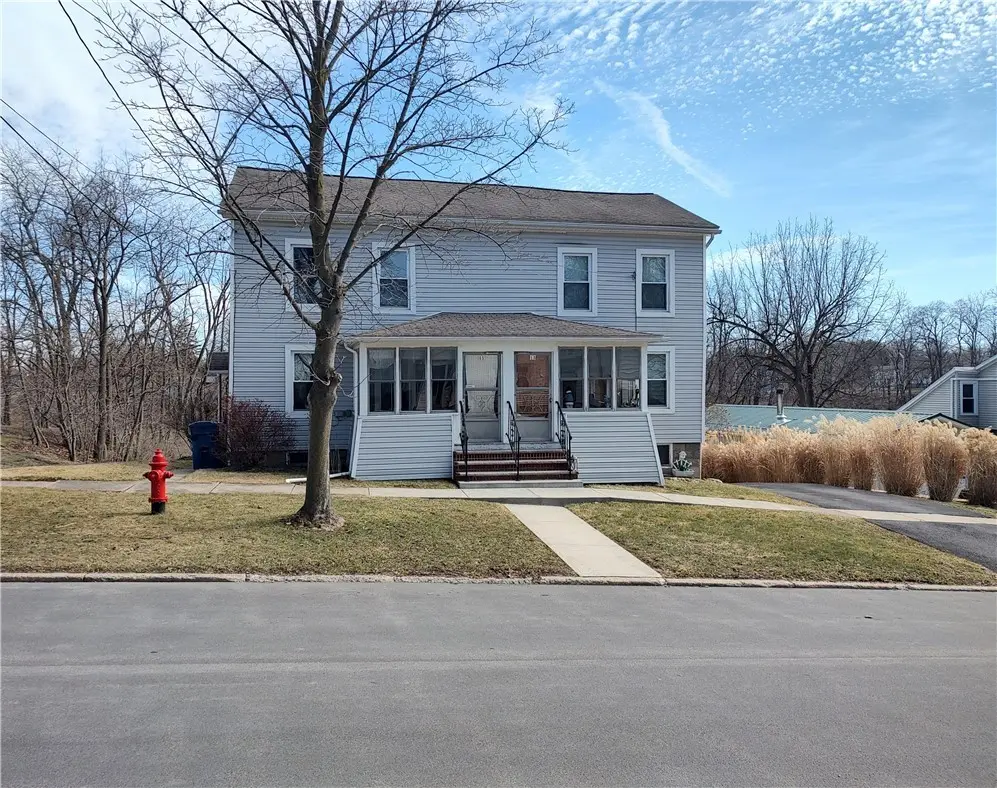
13 Center St #11 · Seneca Falls, NY
Flood risk 1/10 · Minimal
- FEMA flood zone
- X
- Chance of flooding over 30 yrs
- 0.0%
- Est. flood insurance / yr
- $473 – $860
Fire risk 2/10 · Minimal
- Est. fire insurance / yr
- $691 – $1,283
Heat risk 3/10 · Minor
- Hot days now (above 96°F)
- 7 days/yr
- Hot days in 30 yrs
- 15 days/yr
Wind risk 1/10 · Minimal
- Chance of severe wind over 30 yrs
- 0.0%
Air-quality risk 2/10 · Minimal
- Unhealthy air days now
- 0 days/yr
- Unhealthy air days in 30 yrs
- 1 days/yr
Risk factors via First Street. Map © Google.
Why this score? — see what drove the C+ grade
The composite is a weighted blend of 9 inputs, each scored 0–100. Each bar is that input's sub-score; the figure is the points it added to the 100-point composite (weight × sub-score).
- Cash flow +30.0/30.0
- DSCR +10.0/10.0
- 1% rule +8.7/10.0
- Schools +4.2/10.0
- Livability +3.3/5.0
- Rent growth +2.5/5.0
- Condition / age +2.5/5.0
- ARV discount +0.0/15.0
- Appreciation +0.0/10.0
$162,500
🖨 Deal sheet 📄 Offer letter ✓ Due diligence
Multi-family units
County records classify this as Multi-Family (2-4 Unit). Listing-text estimate: 1 unit. estimate disagrees with records
Listing remarks
~ New to the Market 11-13 Center Street, Seneca Falls, A Well Maintained-Family Loved Home for Generations. 11 CENTER STREET w 3 Bdrms, 1 1/2 Bath, Enclosed Front Porch, Formal Living and Dining Rooms Separated w Glass Panel French Doors, Eat in Kitchen w Timeless Decor- Laundry and Half Bath on First Floor, Enclosed Back Porch Looking Over the Yard and Creek, Second Story Hosting 3 Bdrms. , Full Bath Plenty of Closet Space and Storage. Hard Wood Flooring Throughout. Usable Dry Walk Out Basement with Additional Bathroom, Plenty of Space. / 13 CENTER STREET w 2 Bdrms. , 1 Full Bath, Enclosed Front Porch, Living Room, Updated Kitchen w Dining Area, Open Covered Back Deck Overlooking Yard and
Key facts
- Enclosed back porch
- Eat in kitchen
- Updated kitchen
Tags
Neighborhood map
What this means for you Summary
Snapshot
- This is a 5-bed/2.5-bath multifamily listed at $162k. Condition is rated fair.
Deal economics
- At list price, monthly cash flow is $641 ($8k/yr) — positive.
- The deal already cash-flows at list — no discount required.
- Meets the 1% rule at list price ($2k rent vs $162k).
- Recommended offer: $160k (1.5% below list) — sets the bar for market timing.
- Cap rate 11.0% vs local median 3.6% in Seneca Falls — top-decile yield for the area; either an underpriced asset or a hidden risk that comps aren't pricing in. Stress-test before assuming the spread holds.
Location & tenants
- Location reads 66/100 on livability (#657 in NY) — a middle-class / working-renter tenant base. Strengths: cost of living A+, housing A+, health & safety A; Watch: crime D, amenities D, commute F.
- Seneca Falls Central School District (town): math 46% / reading 53% proficiency, ranked #392 of 590 in NY (top 66%) — families likely to look elsewhere, expect single-tenant / working-renter base with shorter leases.
- Market conditions: 51 active listings in the ZIP; 48 units permitted in Seneca County in 2024 (0 in 5+ unit buildings).
Forward outlook
- Local home prices are declining (-3.0%/yr); year-one equity from $1k of loan paydown is wiped out by about $5k of value loss. Plan a longer hold.
- Seneca County population projected at -14% by 2050 — secular population decline; favor cash flow + early exit over multi-decade hold.
- At projected returns (-3.0% appreciation + 3.0% rent growth), your $46k cash investment doubles in ~8 years — after that, you're playing with house money.
Negotiation context
- It's been on market 21 days — a 2% lower offer ($160k) is reasonable based on typical stale-listing flexibility.
Risks & watch-outs
- Watch-outs: built in 1870 — expect roof / HVAC / electrical / plumbing capex.
Questions for the listing agent
- Have any recent inspections been done? Can we get a copy of the seller's disclosures and any deferred-maintenance estimates?
- Built in 1870 — when were the roof, HVAC, electrical panel, plumbing, and water heater last replaced?
- Is there a deadline driving the sale (1031 exchange, divorce, estate, relocation)? That informs how much negotiation room exists.
- Crime grade is D in this area — have there been break-ins, vandalism, or insurance claims at this property in the last 3 years? What carrier currently insures it and at what premium?
- This sits on a lake — are riparian / water-frontage rights deeded with the parcel? Any dock permits, shoreline easements, or HOA water-use restrictions?
- What's the documented flood / surge / shoreline-erosion history here (FEMA AND non-FEMA — e.g., storm surge, creek backup, septic-field saturation)?
- Any water-quality or seasonal algae-bloom issues that affect tenant satisfaction or short-term-rental demand?
- What's the average days-on-market for RENTAL listings here right now (not sales)? A rising rental-DOM trend means longer vacancies and softer asking-rent achievability than the comps imply.
- What's the recent tenant-quality profile in this submarket — average credit score on applications, eviction rate, late-payment / NSF rate, and stable-employment percentage? A property-management company in the area should have these aggregated.
- How much new apartment / multifamily construction is in the pipeline within 1–3 miles? Heavy new supply (>2% of stock underway) typically softens rents 12–24 months out; light construction supports rent growth.
Investment metrics
- 1% rule
- 1.37% ✓
- Cap rate
- 11.03%
- Cash-on-cash
- 16.91%
- DSCR
- 1.75
- GRM
- 6.1
CMA / ARV
- ARV (on-the-fly)
- $130,272
- Comps found
- 1
Show comp detail 1 sale within ~0.75 mi
| Address | Dist | Beds/Ba | Sqft | Sold | Price | $/sf | Match |
|---|---|---|---|---|---|---|---|
| 12 Rumsey St | 0.46mi | 4/2.0 (-1) | 2,041 (-8%) | 16mo | $121,000 | $59 | 46 |
Match score weights: distance 35% · size 25% · config 20% · recency 20%. Top-matched comps best support the ARV.
Projected returns pro-forma
-3.0% appreciation · 3.0% rent growth · sell at horizon
- IRR
- 8.1%
- Equity multiple
- 1.32×
- Total profit
- $14,532
- Equity at exit
- $24,229
- IRR
- 17.4%
- Equity multiple
- 2.44×
- Total profit
- $65,366
- Equity at exit
- $14,050
Cash invested: $45,500 (down + closing). Projections, not guarantees.
Landlord ↔ Tenant lean methodology
- Overall (STATE)
- 15 Strongly Tenant-Friendly
- State New York
- 15 Strongly Tenant-Friendly · D+10
- County
- — inherits STATE
- City
- — inherits STATE
ZIP-level market 13148
- Home prices YoY
- -19.6%
- Active inventory
- 51
- Price-to-rent
- 11.8×
Monthly cashflow live
- Estimated rent
- $2,233 medium interval (Pro) →
- Mortgage (P&I)
- −$852
- Tax est. 1.5%
- −$203 /mo · $2,438/yr
- Insurance
- −$68
- HOA
- −$0
- Vacancy / Maint / Mgmt
- −$469
- Net cashflow
- $641
Break-even live
2-unit breakdown (identical units grouped — click to expand)
| Units | Beds | Baths | Est. rent |
|---|---|---|---|
| 1× unit | 3 | 1.5 | $1,145 |
| 1× unit | 2 | 1 | $1,088 |
| Total (2 units) | $2,233 | ||
UW: 25.0% down · 7.5% · 30yr · 1.5% tax · 5.0% vac · 8.0% maint · 8.0% mgmt
Financing live
Cash to close
- Down payment
- $40,625
- Closing costs
- $4,875
- Reserves months
- —
- Total cash needed
- —
Loan-product check · same deal, 3 products live
Conventional
25% down · 7.5% · 30yr
- Down + closing
- —
- Monthly P&I
- —
- Monthly cashflow
- —
- DSCR
- —
- Eligible?
- —
Personal DTI + credit; lowest rate.
DSCR
20% down · 8.5% · 30yr
- Down + closing
- —
- Monthly P&I
- —
- Monthly cashflow
- —
- DSCR
- —
- Eligible?
- —
No personal income docs; deal must DSCR.
Hard money
10% down · 12.0% · 12mo
- Down + closing
- —
- Monthly P&I
- —
- Monthly cashflow
- —
- DSCR
- —
- Eligible?
- —
Short-term bridge; refi at stabilization.
Listing history 3 events
-
2026-04-10status Pending
-
2026-03-28historical Active Under Contract
-
2026-03-20$162,500 Active
ⓘ Source: listings_history table (triggers on properties + properties_extension) + one-shot
backfill from property_details.listing_events for pre-trigger history.
Climate risk First Street
- Flood 1/10 Low FEMA zone X · 0% chance over 30 yrs
- Wildfire 2/10 Low
- Heat 3/10 Moderate 7 d/yr ≥96°F today · 15 d/yr by 30 yrs out
- Wind 1/10 Low 0% chance of damaging wind over 30 yrs
- Air quality 2/10 Low 0 unhealthy d/yr today · 1 by 30 yrs out
Nearby sold comps map
Loading sold comps map…
Walkable amenities ~0.75 mi
Loading nearby amenities…
Taxation est. · year 1
- Rental income
- $26,796
- − Mortgage interest
- −$9,103
- − Property taxes
- −$2,438
- − Insurance
- −$812
- − Repairs & maintenance
- −$2,144
- − Management
- −$2,144
- − Depreciation
- −$4,727
- Taxable income
- $5,429
- Est. tax owed @ 24.0%
- −$1,303
- After-tax cash flow
- $6,390/yr
For passive investors: Depreciation is non-cash, so a rental often shows a tax loss while cash-flowing — sheltering income. Rental losses are passive: they offset passive income freely, and up to $25,000/yr can offset ordinary (W-2) income if you actively participate and your MAGI is under $100k (phasing out to $0 by $150k); unused losses carry forward. On sale, claimed depreciation is recaptured at up to 25%, and gains may owe capital-gains tax (a 1031 exchange can defer both). Figures are a year-1 estimate at your 24.0% rate — not tax advice; consult a CPA.
Condition & rehab AI · 13 photos
This multi-family home requires moderate renovations, including kitchen and bathroom updates, and landscaping improvements. These changes will significantly increase its resale and rental value.
Repairs flagged
- Major Kitchen cabinets — Outdated and in poor condition
- Major Bathroom fixtures — Outdated and in poor condition
- Major Landscaping — Overgrown and needs trimming
Value-add opportunities
- Resale Kitchen renovation — A modern kitchen will attract more buyers and increase the home's value
- Both Landscaping — A well-maintained yard will improve curb appeal and attract more renters
Renovation cost estimate screening
| Repair item | Severity | Est. cost |
|---|---|---|
| Kitchen cabinets · Outdated and in poor condition | Major | $15,000–50,000 |
| Bathroom fixtures · Outdated and in poor condition | Major | $15,000–50,000 |
| Landscaping · Overgrown and needs trimming | Major | $15,000–50,000 |
| Total estimated repair cost · 3 items | $45,000–150,000 |
Value-add ROI direction
- Resale Kitchen renovation — A modern kitchen will attract more buyers and increase the home's value ↑
- Both Landscaping — A well-maintained yard will improve curb appeal and attract more renters ↑
ⓘ Cost ranges are severity-bucket heuristics (US national rule-of-thumb). Get contractor quotes + a written scope before underwriting a rehab budget.
Schools (NCES district)
- District
- Seneca Falls Central School District
- NCES district ID
- 3626430
- Math proficiency
- 46% ▲ 2.00%
- Reading proficiency
- 53% ▲ 17.00%
- Median HH income
- $49,889
- Composite
- 42.34/100
- National rank
- #3253
- State rank
- #392 of 590 in NY
Livability — Seneca Falls
- Score
- 66/100
- State rank
- #657
- US rank
- #12239
Category grades
Schools grade is shown separately in the Schools card above.
Census & demographics
- Census place
- Seneca Falls, NY
- City population
- 10,798
- Population (ZIP)
- 10,798
Population outlook (Seneca County) Hauer SSP2
- Today (2025)
- 33,457 people
- By 2030
- 32,540 · -2.7%
- By 2040
- 30,680 · -8.3%
- By 2050
- 28,875 · -13.7%
- By 2075
- 24,757 · -26.0%
- By 2100
- 19,591 · -41.4%
Race, ethnicity, and origin ACS 2023
- Neighborhood character
- Predominantly White (90%)
- Race & ethnicity
- White 90% Two or more races 3% Hispanic / Latino 2% Black 2% Asian 2%
- Common ancestry
- Romanian 4% Iranian 4% Lithuanian 3%
- Foreign-born
- 3% · Canada, Jamaica
- Languages at home
- 95% English-only · Other Indo-European 3%
Political lean MEDSL · Seneca
- 2024 margin
- R (+11.8) · D 44.1% · R 55.9%
- 2008→2024 swing
- -14.4pp toward R · 2008: 2.6pp · 2024: -11.8pp
- All cycles
- 2024: R+11.8 2020: R+9.1 2016: R+12.1 2012: D+9.2 2008: D+2.6
Not yet ingested
- Civics
- —
Market trends
- HPI YoY
- ▼ -66.62%
- Current HPI
- 273.4852
- Rent YoY
- —
- Metro
- —
- State GDP YoY
- ▲ 2.60%
- F500 in state
- 92
Industry mix (Fortune 500 HQ in NY)
| Industry | F500 HQs | Revenue |
|---|---|---|
| Financial Services | 10 | $950B |
|
||
| Consumer Goods | 9 | $162B |
|
||
| Insurance | 4 | $225B |
|
||
| Telecommunications | 2 | $144B |
|
||
| Pharmaceuticals | 2 | $112B |
|
||
| Media / Entertainment | 2 | $69B |
|
||
Price history
3 events — show timeline
- 2026-04-10 Pending — UNYREIS
- 2026-03-28 Contingent — UNYREIS
- 2026-03-20 Listed $162,500 UNYREIS
Cash-flow waterfall
monthlySold comps — $/sqft
last 12 mo · ≤1 miLoading sold comps…