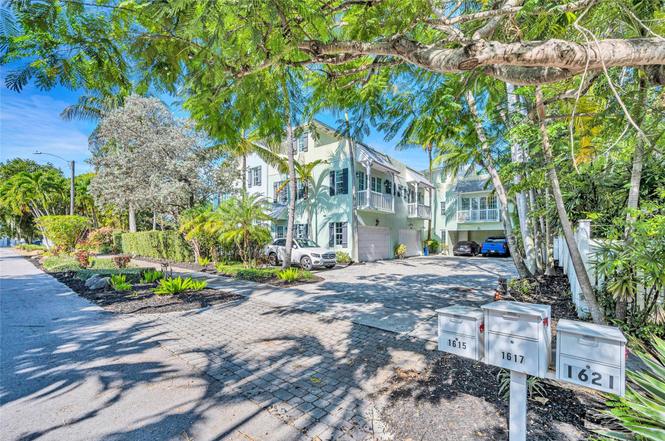
1617 NE 2nd Ct Unit None · Fort Lauderdale, FL
Flood risk 3/10 · Minor
- FEMA flood zone
- AH
- Chance of flooding over 30 yrs
- 0.1%
- Est. flood insurance / yr
- $1,142 – $2,507
Fire risk 1/10 · Minimal
- Est. fire insurance / yr
- $947 – $1,759
Heat risk 10/10 · Severe
- Hot days now (above 105°F)
- 7 days/yr
- Hot days in 30 yrs
- 26 days/yr
Wind risk 10/10 · Severe
- Chance of severe wind over 30 yrs
- 99.0%
Air-quality risk 2/10 · Minimal
- Unhealthy air days now
- 1 days/yr
- Unhealthy air days in 30 yrs
- 1 days/yr
Risk factors via First Street. Map © Google.
Why this score? — see what drove the C grade
The composite is a weighted blend of 9 inputs, each scored 0–100. Each bar is that input's sub-score; the figure is the points it added to the 100-point composite (weight × sub-score).
- ARV discount +15.0/15.0
- Cash flow +14.1/30.0
- Appreciation +7.3/10.0
- DSCR +4.3/10.0
- Schools +4.1/10.0
- Livability +4.1/5.0
- Condition / age +4.0/5.0
- 1% rule +3.9/10.0
- Rent growth +3.3/5.0
$925,000
🖨 Deal sheet 📄 Offer letter ✓ Due diligence
Listing remarks
Seldom found 4BR/3.5BA, fee simple townhouse in boutique Victoria Park development for less than $1M! Spacious & flexible floor plan w/ elevator servicing all 3 floors. Open, 1st floor living area consists of foyer entry, great room, powder room and a modern kitchen w/ center island, stainless appliances, quartz counters, decorative backsplash, bar seating and euro-style cabinetry. 2nd floor consists of primary suite w/ large walk-in closet & Juliet balcony, additional 2BR/1BA and stand alone laundry room. 3rd floor offers a 4th bedroom which could also be 2nd primary, separate den/office/game room and 2 rooftop terraces. Other features include a true 2-car garage & impact
Key facts
- Juliet balcony
- Fee simple townhouse
- Large walk-in closet
Tags
Property features AI
Finance
- HOA & community: Community of 4 units; Pets allowed
Exterior
- Parking: Attached garage for 2 cars; Covered parking (2 spaces)
- Utilities: Public water; Public sewer; Cable available
- Home design: Townhouse; Three or more levels; First-floor entry; Faces east
- Construction: CBS and other construction materials
- Exterior features: Covered patio; Patio; Terrace; Fenced
Interior
- Kitchen: Disposal; Dishwasher; Electric range; Microwave; Refrigerator
- Bedrooms: No main-level bedrooms listed
- Flooring: Wood flooring
- Bathrooms: Three full bathrooms and one half bathroom (total 4)
- Heating & cooling: Central heating (electric, zoned); Central air conditioning (electric, zoned); Ceiling fans
- Interior features: Built-in features; Entrance foyer; Kitchen island; Vaulted ceilings; Walk-in closets; Blinds, drapes and rods
- Laundry & utility: Unfurnished (no laundry-specific appliances listed)
Neighborhood map
What this means for you Summary
Snapshot
- This is a 4-bed/3.5-bath townhouse listed at $925k. Condition is rated good.
Deal economics
- At list price, monthly cash flow is $-24 ($-291/yr) — negative.
- To cash-flow at today's rent, offer at most $921k (0.4% below list).
- To meet the 1% rule (rent ≥ 1% of price), the offer needs to be $825k (10.8% below list).
- Recommended offer: $825k (10.8% below list) — sets the bar for 1% rule.
- Cap rate 6.5% vs local median 2.2% in Fort Lauderdale — top-decile yield for the area; either an underpriced asset or a hidden risk that comps aren't pricing in. Stress-test before assuming the spread holds.
Location & tenants
- Location reads 82/100 on livability (#78 in FL, #1,293 nationally) — a professional / high-income tenant draw. Strengths: crime A+, amenities A+, health & safety A+; Watch: cost of living D-.
- Broward (suburban): math 42% / reading 53% proficiency, ranked #46 of 73 in FL (top 63%) — families likely to look elsewhere, expect single-tenant / working-renter base with shorter leases.
- Zoned schools: Harbordale Elementary School (math 64% / reading 74%, grade A-, #399 of 2,144 statewide, top 19%, 487 students, 38% FRL); Sunrise Middle School (math 50% / reading 52%, grade C, #237 of 571 statewide, top 43%, 1,242 students, 64% FRL); Fort Lauderdale High School (math 38% / reading 67%, grade C-, #154 of 667 statewide, top 24%, 2,228 students, 57% FRL) — zoned schools at 53% FRL track the district average.
- Market conditions: Rents rising (+3.0%/yr); 469 active listings in the ZIP; 40 comparable units currently listed for rent nearby; rentals at typical pace (median 25d on market — plan ~3-4 weeks tenant-placement turnaround); high-income renter base; 2,111 units permitted in Broward County in 2024 (1,265 in 5+ unit buildings).
- At $8,254/mo this rent would consume 79% of the median local household income ($125k/yr) (locally 1662% of renters already pay >50% of income on rent) — very limited rent-growth headroom before tenants either downsize or default.
Forward outlook
- In year one you build about $49k of equity ($6k loan paydown + $42k appreciation (4.6% local appreciation)).
- Broward County population projected at +34% by 2050 — long-run rental-demand tailwind backs the buy-and-hold thesis.
- At projected returns (4.6% appreciation + 3.0% rent growth), your $259k cash investment doubles in ~5 years — after that, you're playing with house money.
- By year 2, paydown + projected appreciation supports a ~$78k cash-out refi (75% LTV) — recoverable capital for the next deal without selling this one.
Negotiation context
- It's been on market 99 days — a 9% lower offer ($842k) is reasonable based on typical stale-listing flexibility.
Risks & watch-outs
- Watch-outs: flood insurance adds $152/mo.
- Climate carrying-cost: in FEMA flood zone AH (mandatory federal flood insurance); severe wind risk, 99% chance of damaging wind over 30y; extreme-heat days projected 7→26/yr by 2055 (HVAC capex compounding) — expect insurance premiums to compound above CPI over the hold.
Questions for the listing agent
- What do current leases actually rent for vs. the listed asking? Can we see a recent rent roll and the last 12 months of T-12 income?
- It's been on market 99 days. Have you received any prior offers? Is the seller open to a 11% concession, seller financing, or rate buy-down credit?
- What's the actual annual flood-insurance premium (NFIP or private), and is the property in a SFHA with mandatory coverage?
- Why hasn't it sold? Are there any deal-killer items the seller is aware of (foundation, flood, title, zoning, code violations)?
- Is there a deadline driving the sale (1031 exchange, divorce, estate, relocation)? That informs how much negotiation room exists.
- Schools are B-rated — typically a magnet for longer-tenancy family renters. What's the average tenant stay here, and is there a school-zone premium baked into asking?
- What's the average days-on-market for RENTAL listings here right now (not sales)? A rising rental-DOM trend means longer vacancies and softer asking-rent achievability than the comps imply.
- What's the recent tenant-quality profile in this submarket — average credit score on applications, eviction rate, late-payment / NSF rate, and stable-employment percentage? A property-management company in the area should have these aggregated.
- How much new for-sale + rental construction is in the pipeline within 1–3 miles? Heavy new supply typically softens prices + rents 12–24 months out; constrained supply supports both.
Investment metrics
- 1% rule
- 0.89% ✗
- Cap rate
- 6.46%
- Cash-on-cash
- 0.59%
- DSCR
- 1.03
- GRM
- 9.3
CMA / ARV
- ARV (on-the-fly)
- $1,363,128
- Comps found
- 9
Show comp detail 9 sales within ~0.75 mi
| Address | Dist | Beds/Ba | Sqft | Sold | Price | $/sf | Match |
|---|---|---|---|---|---|---|---|
| 314 NE 15th Ave | 0.10mi | 4/3.5 | 2,738 (+3%) | 21mo | $1,250,000 | $457 | 72 |
| 308 NE 14th Ave | 0.14mi | 4/4.0 | 2,326 (-12%) | 7mo | $1,412,500 | $607 | 65 |
| 1400 NE 6th St | 0.35mi | 3/2.5 (-1) | 2,817 (+6%) | 2mo | $1,250,000 | $444 | 63 |
| 811 NE 17th Way | 0.64mi | 3/3.5 (-1) | 2,548 (-4%) | 2mo | $1,200,000 | $471 | 57 |
| 817 NE 17th Way | 0.66mi | 3/3.5 (-1) | 2,548 (-4%) | 3mo | $1,310,000 | $514 | 55 |
| 844 N Victoria Park Rd | 0.74mi | 3/3.5 (-1) | 2,564 (-3%) | 3mo | $950,000 | $371 | 53 |
| 609 NE 8th Ave Unit A | 0.63mi | 4/3.5 | 2,316 (-13%) | 3mo | $1,575,000 | $680 | 46 |
| 609 NE 8th Ave Unit B | 0.63mi | 4/3.5 | 2,264 (-15%) | 1mo | $1,400,000 | $618 | 45 |
| 45 Hendricks Isle #201 | 0.37mi | 3/3.5 (-1) | 2,979 (+12%) | 20mo | $1,800,000 | $604 | 41 |
Match score weights: distance 35% · size 25% · config 20% · recency 20%. Top-matched comps best support the ARV.
Projected returns pro-forma
4.58% appreciation · 3.02% rent growth · sell at horizon
- IRR
- 11.7%
- Equity multiple
- 1.73×
- Total profit
- $189,976
- Equity at exit
- $500,712
- IRR
- 13.0%
- Equity multiple
- 3.27×
- Total profit
- $587,502
- Equity at exit
- $845,350
Cash invested: $259,000 (down + closing). Projections, not guarantees.
Landlord ↔ Tenant lean methodology
- Overall (STATE)
- 87 Strongly Landlord-Friendly
- State Florida
- 87 Strongly Landlord-Friendly · R+3
- County
- — inherits STATE
- City
- — inherits STATE
ZIP-level market 33301
- Home prices YoY
- 1.6%
- Rents YoY
- 3.0%
- Active inventory
- 469
- Price-to-rent
- 9.3×
Monthly cashflow live
- Estimated rent
- $8,254 high interval (Pro) →
- Mortgage (P&I)
- −$4,851
- Tax est. 1.5%
- −$1,156 /mo · $13,875/yr
- Insurance
- −$385
- Flood insurance flood zone
- −$152 /mo · $1,824/yr
- HOA
- −$0
- Vacancy / Maint / Mgmt
- −$1,733
- Net cashflow
- $-24
Break-even live
UW: 25.0% down · 7.5% · 30yr · 1.5% tax · 5.0% vac · 8.0% maint · 8.0% mgmt
Financing live
Cash to close
- Down payment
- $231,250
- Closing costs
- $27,750
- Reserves months
- —
- Total cash needed
- —
Loan-product check · same deal, 3 products live
Conventional
25% down · 7.5% · 30yr
- Down + closing
- —
- Monthly P&I
- —
- Monthly cashflow
- —
- DSCR
- —
- Eligible?
- —
Personal DTI + credit; lowest rate.
DSCR
20% down · 8.5% · 30yr
- Down + closing
- —
- Monthly P&I
- —
- Monthly cashflow
- —
- DSCR
- —
- Eligible?
- —
No personal income docs; deal must DSCR.
Hard money
10% down · 12.0% · 12mo
- Down + closing
- —
- Monthly P&I
- —
- Monthly cashflow
- —
- DSCR
- —
- Eligible?
- —
Short-term bridge; refi at stabilization.
Rent comps 40 comps
| Address | Beds | Baths | Sqft | Rent | $/sqft | DOM | Units | Dist |
|---|---|---|---|---|---|---|---|---|
| 200 NE 16th Ave Unit 1369656P Fort Lauderdale, FL | 3.0 | 2.0 | 2497 | $6,472 | $2.59 | 2d | 1 | 0.03mi |
| 1416 NE 4th Ct #1416 Fort Lauderdale, FL | 3.0 | 2.5 | 2214 | $5,800 | $2.62 | 24d | 1 | 0.15mi |
| 417 NE 15th Ave Fort Lauderdale, FL | 5.0 | 4.0 | 2001 | $19,995 | $9.99 | 24d | 1 | 0.17mi |
| 1509 NE 4th Pl Fort Lauderdale, FL | 4.0 | 3.5 | 3213 | $9,000 | $2.80 | 24d | 1 | 0.20mi |
| 1511 NE 4th Pl #0 Fort Lauderdale, FL | 4.0 | 3.0 | 3271 | $8,000 | $2.45 | 24d | 1 | 0.21mi |
| 1511 NE 4th Pl #0 Fort Lauderdale, FL | 4.0 | 3.0 | 3271 | $8,000 | $2.45 | 8d | 1 | 0.21mi |
| 1415 NE 4th Pl Fort Lauderdale, FL | 5.0 | 3.0 | 1970 | $7,500 | $3.81 | 4d | 1 | 0.22mi |
| 404 NE 13th Ave Fort Lauderdale, FL | 4.0 | 3.5 | 3559 | $34,995 | $9.83 | 24d | 1 | 0.23mi |
| 1409 NE 4th Pl Unit 1541792P Fort Lauderdale, FL | 3.0 | 3.5 | 2863 | $5,190 | $1.81 | 14d | 1 | 0.23mi |
| 1606 SE 1st St Fort Lauderdale, FL | 3.0 | 2.0 | 1893 | $15,000 | $7.92 | 19d | 1 | 0.24mi |
| 1215 NE 1st St Fort Lauderdale, FL | 4.0 | 3.5 | 3436 | $14,995 | $4.36 | 24d | 1 | 0.24mi |
| 1410 NE 5th St Fort Lauderdale, FL | 3.0 | 3.0 | 3125 | $9,000 | $2.88 | 24d | 1 | 0.25mi |
| 1410 NE 5th St Unit A Fort Lauderdale, FL | 3.0 | 3.5 | 3125 | $9,250 | $2.96 | 17d | 1 | 0.25mi |
| 101 SE 15th Ave Unit E Fort Lauderdale, FL | 3.0 | 2.5 | 1774 | $4,500 | $2.54 | 24d | 1 | 0.26mi |
| 1206 NE 1st St #1206 Fort Lauderdale, FL | 4.0 | 3.5 | 2992 | $12,995 | $4.34 | 8d | 1 | 0.27mi |
| 1612 SE 2nd St Fort Lauderdale, FL | 4.0 | 3.0 | 2186 | $12,000 | $5.49 | 22d | 1 | 0.30mi |
| 1403 SE 2nd St Unit 1 Fort Lauderdale, FL | 3.0 | 2.0 | 2055 | $4,900 | $2.38 | 24d | 1 | 0.30mi |
| 1403 SE 2nd St Unit 1 Fort Lauderdale, FL | 3.0 | 2.0 | 2055 | $4,900 | $2.38 | 17d | 1 | 0.30mi |
| 1403 SE 2nd St Fort Lauderdale, FL | 3.0 | 2.0 | 2100 | $4,800 | $2.29 | 8d | 1 | 0.30mi |
| 1412 SE 2nd St Unit 1018675P Fort Lauderdale, FL | 4.0 | 6.0 | 3595 | $13,586 | $3.78 | 24d | 1 | 0.31mi |
| 117 S Gordon Rd Fort Lauderdale, FL | 4.0 | 3.0 | 3354 | $20,000 | $5.96 | 24d | 1 | 0.32mi |
| 1211 SE 1st St Fort Lauderdale, FL | 4.0 | 3.5 | 2486 | $8,500 | $3.42 | 2d | 1 | 0.32mi |
| 1312 SE 2nd St Fort Lauderdale, FL | 5.0 | 5.0 | 3254 | $28,000 | $8.60 | 24d | 1 | 0.33mi |
| 547 NE 16th Ave Unit 1369653P Fort Lauderdale, FL | 4.0 | 3.0 | 3498 | $10,370 | $2.96 | 22d | 1 | 0.34mi |
| 1504 NE 6th St Fort Lauderdale, FL | 5.0 | 5.0 | 3448 | $28,000 | $8.12 | 24d | 1 | 0.34mi |
| 561 NE 15th Ave Fort Lauderdale, FL | 3.0 | 3.5 | 2145 | $4,500 | $2.10 | 24d | 1 | 0.34mi |
| 561 NE 15th Ave Fort Lauderdale, FL | 3.0 | 3.5 | 2145 | $4,500 | $2.10 | 17d | 1 | 0.34mi |
| 540 NE 17th Ave Fort Lauderdale, FL | 4.0 | 3.5 | 2660 | $6,999 | $2.63 | 24d | 1 | 0.35mi |
| 45 Hendricks Isle #403 Fort Lauderdale, FL | 3.0 | 3.0 | 2100 | $12,500 | $5.95 | 5d | 1 | 0.36mi |
| 549 NE 14th Ave Unit 1369642P Fort Lauderdale, FL | 3.0 | 3.0 | 2992 | $9,703 | $3.24 | 24d | 1 | 0.37mi |
| 1312 SE 2nd Ct Fort Lauderdale, FL | 3.0 | 3.0 | 2974 | $15,000 | $5.04 | 24d | 1 | 0.38mi |
| 133 Isle of Venice Dr Fort Lauderdale, FL | 3.0 | 3.5 | 2849 | $17,000 | $5.97 | 19d | 1 | 0.38mi |
| 444 Hendricks Isle #301 Fort Lauderdale, FL | 3.0 | 3.5 | 2300 | $8,500 | $3.70 | 24d | 1 | 0.38mi |
| 95 Isle of Venice Dr Fort Lauderdale, FL | 4.0 | 4.5 | 3426 | $10,000 | $2.92 | 24d | 1 | 0.39mi |
| 119 SE 12th Ave Fort Lauderdale, FL | 4.0 | 3.5 | 3393 | $13,000 | $3.83 | 5d | 1 | 0.40mi |
| 110 SE 11th Ave Fort Lauderdale, FL | 4.0 | 2.5 | 3570 | $14,000 | $3.92 | 24d | 1 | 0.41mi |
| 625 NE 15th Ave Unit 625 Fort Lauderdale, FL | 5.0 | 4.0 | 2491 | $20,000 | $8.03 | 24d | 1 | 0.43mi |
| 1615 SE 4th St Fort Lauderdale, FL | 3.0 | 2.0 | 1948 | $5,500 | $2.82 | 5d | 1 | 0.44mi |
| 623 NE 17th Way Fort Lauderdale, FL | 4.0 | 4.0 | 2525 | $9,300 | $3.68 | 17d | 1 | 0.45mi |
| 623 NE 17th Way Fort Lauderdale, FL | 4.0 | 4.0 | 2525 | $9,275 | $3.67 | 3d | 1 | 0.45mi |
Listing history 14 events
-
2026-06-18days on market $925,000 Active 99 DOM
-
2026-06-17days on market $925,000 Active 98 DOM
-
2026-06-16days on market $925,000 Active 97 DOM
-
2026-06-15days on market $925,000 Active 96 DOM
-
2026-06-13days on market $925,000 Active 94 DOM
-
2026-06-09days on market $925,000 Active 90 DOM
-
2026-06-07pricedays on market $925,000 Active 88 DOM
-
2026-06-04days on market $945,000 Active 85 DOM
-
2026-06-03days on market $945,000 Active 84 DOM
-
2026-06-02days on market $945,000 Active 83 DOM
-
2026-06-01days on market $945,000 Active 82 DOM
-
2026-05-31days on market $945,000 Active 81 DOM
-
2026-04-12price $945,000
-
2026-01-28$975,000 Active
ⓘ Source: listings_history table (triggers on properties + properties_extension) + one-shot
backfill from property_details.listing_events for pre-trigger history.
Climate risk First Street
- Flood 3/10 Moderate FEMA zone AH · 10% chance over 30 yrs
- Wildfire 1/10 Low
- Heat 10/10 Extreme 7 d/yr ≥105°F today · 26 d/yr by 30 yrs out
- Wind 10/10 Extreme 99% chance of damaging wind over 30 yrs
- Air quality 2/10 Low 1 unhealthy d/yr today · 1 by 30 yrs out
Nearby sold comps map
Loading sold comps map…
Walkable amenities ~0.75 mi
Loading nearby amenities…
Taxation est. · year 1
- Rental income
- $99,042
- − Mortgage interest
- −$51,814
- − Property taxes
- −$13,875
- − Insurance
- −$6,450
- − Repairs & maintenance
- −$7,923
- − Management
- −$7,923
- − Depreciation
- −$26,909
- Taxable loss
- −$15,852
- Est. tax savings @ 24.0%
- +$3,805
- After-tax cash flow
- $3,514/yr
For passive investors: Depreciation is non-cash, so a rental often shows a tax loss while cash-flowing — sheltering income. Rental losses are passive: they offset passive income freely, and up to $25,000/yr can offset ordinary (W-2) income if you actively participate and your MAGI is under $100k (phasing out to $0 by $150k); unused losses carry forward. On sale, claimed depreciation is recaptured at up to 25%, and gains may owe capital-gains tax (a 1031 exchange can defer both). Figures are a year-1 estimate at your 24.0% rate — not tax advice; consult a CPA.
Condition & rehab AI · 14 photos
This townhouse is in good condition with a modern kitchen and bathrooms, and a well-maintained exterior. It has a good curb appeal and is ready for minor cosmetic improvements to further enhance its value.
Value-add opportunities
- Both Landscaping and curb appeal improvements — Enhances the home's curb appeal and can attract more buyers or renters.
- Both Painting the exterior walls — Improves the home's appearance and can increase its value.
- Both Upgrading the HVAC system — Improves comfort and energy efficiency, which can increase both resale and rental value.
Renovation cost estimate screening
Value-add ROI direction
- Both Landscaping and curb appeal improvements — Enhances the home's curb appeal and can attract more buyers or renters. ↑
- Both Painting the exterior walls — Improves the home's appearance and can increase its value. ↑
- Both Upgrading the HVAC system — Improves comfort and energy efficiency, which can increase both resale and rental value. ↑
ⓘ Cost ranges are severity-bucket heuristics (US national rule-of-thumb). Get contractor quotes + a written scope before underwriting a rehab budget.
Schools (NCES district)
- District
- Broward
- NCES district ID
- 1200180
- Math proficiency
- 42% ▼ -18.00%
- Reading proficiency
- 53% ▼ -5.00%
- Median HH income
- $52,139
- Composite
- 40.88/100
- National rank
- #3621
- State rank
- #46 of 73 in FL
Livability — Fort Lauderdale
- Score
- 82/100
- State rank
- #78
- US rank
- #1293
Category grades
Schools grade is shown separately in the Schools card above.
Census & demographics
- Census place
- Fort Lauderdale, FL
- County
- Broward County · 1,963,430 people
- City population
- 235,769
- Metro
- Miami-Fort Lauderdale-Pompano Beach, FL
- Population (ZIP)
- 19,503
- Household income
- $124,812
- Rent vs Own
- Severe rent burden
- 1662.0
Population outlook (Broward County) Hauer SSP2
- Today (2025)
- 2,207,033 people
- By 2030
- 2,360,704 · +7.0%
- By 2040
- 2,661,208 · +20.6%
- By 2050
- 2,946,698 · +33.5%
- By 2075
- 3,602,273 · +63.2%
- By 2100
- 3,970,984 · +79.9%
Race, ethnicity, and origin ACS 2023
- Neighborhood character
- Predominantly White (67%)
- Race & ethnicity
- White 67% Hispanic / Latino 17% Two or more races 14% Black 8% Asian 2%
- Hispanic origin (detail)
- Mexican 1% Puerto Rican 3% Cuban 5%
- Common ancestry
- Romanian 3% Scotch-Irish 3% Czech 2%
- Foreign-born
- 19% · Canada, Jamaica, Dominican Republic
- Languages at home
- 75% English-only · Spanish 13% Other Indo-European 3% French/Haitian/Cajun 3%
Political lean MEDSL · Broward
- 2024 margin
- D (+17.0) · D 58.0% · R 41.0%
- 2008→2024 swing
- -17.8pp toward R · 2008: 34.7pp · 2024: 17.0pp
- All cycles
- 2024: D+17.0 2020: D+29.8 2016: D+35.0 2012: D+34.9 2008: D+34.7
Not yet ingested
- Civics
- —
Market trends
- HPI YoY
- ▲ 4.58%
- Current HPI
- 300.8346
- Rent YoY
- ▲ 3.02%
- Metro
- Miami-Fort Lauderdale-Pompano Beach, FL
- State GDP YoY
- ▲ 3.28%
- F500 in state
- 36
Industry mix (Fortune 500 HQ in FL)
| Industry | F500 HQs | Revenue |
|---|---|---|
| Industrial Technology | 2 | $29B |
|
||
| Insurance | 2 | $17B |
|
||
| Retail | 1 | $60B |
|
||
| Technology Distribution | 1 | $58B |
|
||
| Homebuilding | 1 | $35B |
|
||
| Technology Manufacturing | 1 | $35B |
|
||
Price history
-3.1% since first listed2 events — show timeline
- 2026-04-12 Price Changed $945,000 Beaches MLS
- 2026-01-28 Listed $975,000 Beaches MLS
Cash-flow waterfall
monthlySold comps — $/sqft
last 12 mo · ≤1 miLoading sold comps…