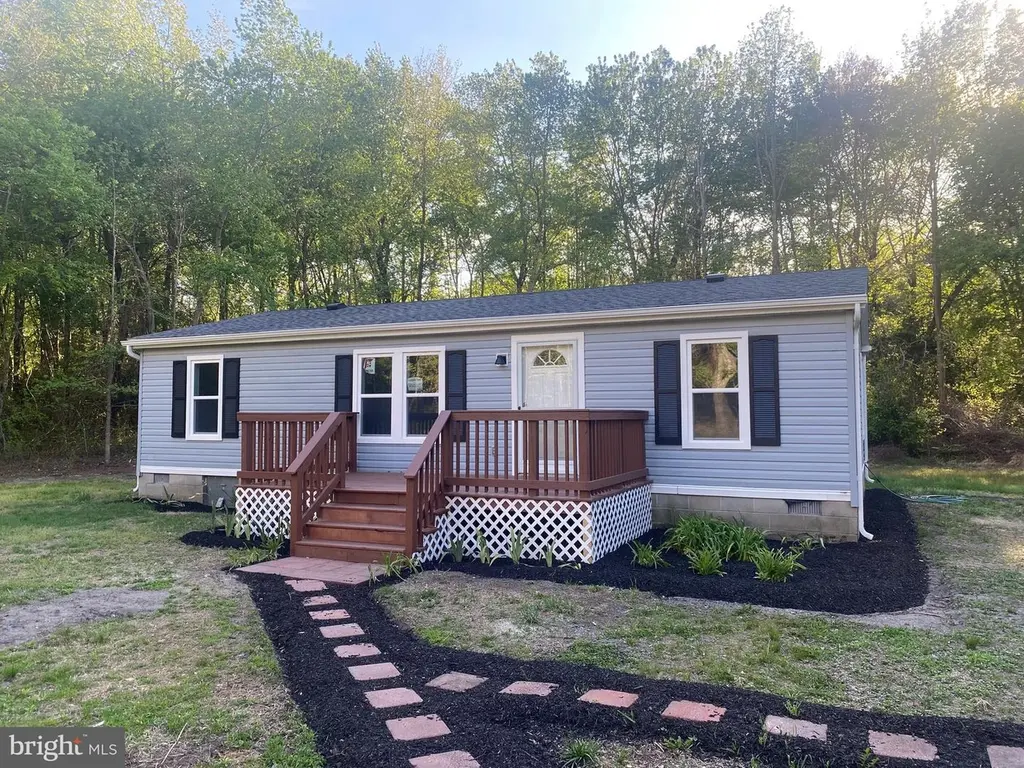
20322 Thicket Rd · Milton, DE
Flood risk 6/10 · Moderate
- FEMA flood zone
- X (unshaded)
- Chance of flooding over 30 yrs
- 0.71%
- Est. flood insurance / yr
- $473 – $860
Fire risk 6/10 · Moderate
- Est. fire insurance / yr
- $476 – $884
Heat risk 8/10 · Major
- Hot days now (above 104°F)
- 7 days/yr
- Hot days in 30 yrs
- 16 days/yr
Wind risk 8/10 · Major
- Chance of severe wind over 30 yrs
- 80.0%
Air-quality risk 2/10 · Minimal
- Unhealthy air days now
- 1 days/yr
- Unhealthy air days in 30 yrs
- 1 days/yr
Risk factors via First Street. Map © Google.
Why this score? — see what drove the D grade
The composite is a weighted blend of 9 inputs, each scored 0–100. Each bar is that input's sub-score; the figure is the points it added to the 100-point composite (weight × sub-score).
- ARV discount +15.0/15.0
- Cash flow +9.0/30.0
- Schools +4.2/10.0
- Livability +3.7/5.0
- DSCR +2.5/10.0
- Rent growth +2.5/5.0
- Condition / age +2.5/5.0
- 1% rule +1.4/10.0
- Appreciation +0.0/10.0
$319,786
🖨 Deal sheet 📄 Offer letter ✓ Due diligence
Listing remarks MLS
Investor Alert! Sold as is with no seller paid inspections or repairs. Debris onsite to be removed at buyer expense.
Key facts
- 1.4 acre lot
- 4 parking spots
- Built 1988
Property features AI
Finance
- Other: Ownership: Fee simple; Property condition: Very good
- HOA & community: Ground rent paid annually
Exterior
- Parking: Driveway parking (4 spaces total)
- Utilities: Well water; Low pressure pipe (LPP) septic; Electric service 200+ amp; Electric hot water; Cable internet available; Municipal trash not provided
- Home design: Manufactured property; Single-story; Main entrance faces east; Above-grade and below-grade structures noted
- Construction: Modular/Manufactured construction; Block foundation with crawl space; Shingle roof; Energy-efficient windows; Building not winterized; Effective year built: 2026 (major remodel/renovation)
- Exterior features: Landscaped lot; Not in a federal flood zone; Rural location; Blacktop road frontage; Road maintained by city/county; Horse allowed
Interior
- Kitchen: Dishwasher; Electric oven/range; Refrigerator; Energy-efficient appliances
- Bedrooms: Three bedrooms on the main level
- Flooring: Vinyl flooring; Carpet
- Bathrooms: Two full bathrooms (both on the main level)
- Heating & cooling: Heat pump(s); Central A/C (electric)
- Interior features: Insulated doors; Drywall walls and ceilings; Not furnished; Estimated living area
- Laundry & utility: Washer; Dryer; Has laundry
Neighborhood map
What this means for you Summary
Snapshot
- This is a 3-bed/2.0-bath manufactured listed at $320k.
Deal economics
- At list price, monthly cash flow is $-251 ($-3k/yr) — negative.
- To cash-flow at today's rent, offer at most $275k (13.9% below list).
- To meet the 1% rule (rent ≥ 1% of price), the offer needs to be $205k (35.8% below list).
- Recommended offer: $205k (35.8% below list) — sets the bar for 1% rule.
- Cap rate 5.4% vs local median 2.2% in Milton — top-decile yield for the area; either an underpriced asset or a hidden risk that comps aren't pricing in. Stress-test before assuming the spread holds.
Location & tenants
- Location reads 73/100 on livability (#7 in DE) — a middle-class / working-renter tenant base. Strengths: health & safety A+, housing A-, cost of living B+; Watch: amenities F, commute F.
- Cape Henlopen School District (town): math 42% / reading 55% proficiency, ranked #5 of 26 in DE (top 19%) — families likely to look elsewhere, expect single-tenant / working-renter base with shorter leases.
- Market conditions: 391 active listings in the ZIP; 4,354 units permitted in Sussex County in 2024 (344 in 5+ unit buildings).
Forward outlook
- Local home prices are declining (-3.0%/yr); year-one equity from $2k of loan paydown is wiped out by about $10k of value loss. Plan a longer hold.
- Sussex County population projected at +25% by 2050 — long-run rental-demand tailwind backs the buy-and-hold thesis.
Negotiation context
- It's been on market 30 days — a 2% lower offer ($315k) is reasonable based on typical stale-listing flexibility.
- 2 sale attempts with the ask held roughly flat each time — persistent listings suggest the price (not the market) is what's stuck; bring a comps-based counter.
- Current owner paid $210k; list at $320k implies a 52% gain — meaningful room to come down on a strong offer.
Risks & watch-outs
- Climate carrying-cost: major flood risk; severe wind risk, 80% chance of damaging wind over 30y; major wildfire risk; extreme-heat days projected 7→16/yr by 2055 (HVAC capex compounding) — expect insurance premiums to compound above CPI over the hold.
Questions for the listing agent
- What do current leases actually rent for vs. the listed asking? Can we see a recent rent roll and the last 12 months of T-12 income?
- Is there a deadline driving the sale (1031 exchange, divorce, estate, relocation)? That informs how much negotiation room exists.
- The area grade is low — what's the realistic commute time and amenity access for the typical tenant pool here? Any planned neighborhood developments (good or bad) we should know about?
- What's the average days-on-market for RENTAL listings here right now (not sales)? A rising rental-DOM trend means longer vacancies and softer asking-rent achievability than the comps imply.
- What's the recent tenant-quality profile in this submarket — average credit score on applications, eviction rate, late-payment / NSF rate, and stable-employment percentage? A property-management company in the area should have these aggregated.
- How much new for-sale + rental construction is in the pipeline within 1–3 miles? Heavy new supply typically softens prices + rents 12–24 months out; constrained supply supports both.
Investment metrics
- 1% rule
- 0.64% ✗
- Cap rate
- 5.35%
- Cash-on-cash
- -3.36%
- DSCR
- 0.85
- GRM
- 13.0
CMA / ARV
- ARV (median comp)
- $384,152
- List price
- $319,786
- Delta
- -16.76%
- Verdict
- UNDERPRICED
- Comps
- 3 within 2.0 mi
Projected returns pro-forma
-3.0% appreciation · 3.0% rent growth · sell at horizon
- IRR
- -22.0%
- Equity multiple
- 0.24×
- Total profit
- $-67,966
- Equity at exit
- $47,681
- IRR
- -16.1%
- Equity multiple
- 0.10×
- Total profit
- $-80,463
- Equity at exit
- $27,649
Cash invested: $89,540 (down + closing). Projections, not guarantees.
Landlord ↔ Tenant lean methodology
- Overall (STATE)
- 70 Landlord-Friendly
- State Delaware
- 70 Landlord-Friendly · D+7
- County
- — inherits STATE
- City
- — inherits STATE
ZIP-level market 19968
- Home prices YoY
- -11.2%
- Active inventory
- 391
- Price-to-rent
- 13.0×
Monthly cashflow live
- Estimated rent
- $2,054 medium interval (Pro) →
- Mortgage (P&I)
- −$1,677
- Tax from tax record
- −$63 /mo · $759/yr
- Insurance
- −$133
- HOA
- −$0
- Vacancy / Maint / Mgmt
- −$431
- Net cashflow
- $-251
Break-even live
UW: 25.0% down · 7.5% · 30yr · 1.5% tax · 5.0% vac · 8.0% maint · 8.0% mgmt
Financing live
Cash to close
- Down payment
- $79,946
- Closing costs
- $9,594
- Reserves months
- —
- Total cash needed
- —
Loan-product check · same deal, 3 products live
Conventional
25% down · 7.5% · 30yr
- Down + closing
- —
- Monthly P&I
- —
- Monthly cashflow
- —
- DSCR
- —
- Eligible?
- —
Personal DTI + credit; lowest rate.
DSCR
20% down · 8.5% · 30yr
- Down + closing
- —
- Monthly P&I
- —
- Monthly cashflow
- —
- DSCR
- —
- Eligible?
- —
No personal income docs; deal must DSCR.
Hard money
10% down · 12.0% · 12mo
- Down + closing
- —
- Monthly P&I
- —
- Monthly cashflow
- —
- DSCR
- —
- Eligible?
- —
Short-term bridge; refi at stabilization.
Listing history 12 events
-
2026-06-07statusdays on market $319,786 Pending 30 DOM
-
2026-06-05days on market $319,786 Active 28 DOM
-
2026-06-03days on market $319,786 Active 27 DOM
-
2026-06-02days on market $319,786 Active 26 DOM
-
2026-06-01days on market $319,786 Active 25 DOM
-
2026-05-31days on market $319,786 Active 24 DOM
-
2026-05-30days on market $319,786 Active 23 DOM
-
2026-05-07$319,786 Active 762-char remark
-
2025-10-17soldstatus $210,000
-
2025-10-14soldstatus $210,000 Closed 116-char remark
Show marketing remark (116 chars)
Investor Alert! Sold as is with no seller paid inspections or repairs. Debris onsite to be removed at buyer expense.
-
2025-09-24status Pending 116-char remark
Show marketing remark (116 chars)
Investor Alert! Sold as is with no seller paid inspections or repairs. Debris onsite to be removed at buyer expense.
-
2025-09-24$249,900 Active 116-char remark
Show marketing remark (116 chars)
Investor Alert! Sold as is with no seller paid inspections or repairs. Debris onsite to be removed at buyer expense.
ⓘ Source: listings_history table (triggers on properties + properties_extension) + one-shot
backfill from property_details.listing_events for pre-trigger history.
Tax reassessment forecast DE · Partial reset (capped growth)
- Current annual tax
- $759 · $63/mo
- Projected year-2 tax
- $1,307 · $109/mo
- Expected delta
- +$548/yr (+$46/mo · 72.2%)
ⓘ Screening estimate from a state-policy table — verify with the county assessor before closing.
Climate risk First Street
- Flood 6/10 Major FEMA zone X (unshaded) · 71% chance over 30 yrs
- Wildfire 6/10 Major
- Heat 8/10 Severe 7 d/yr ≥104°F today · 16 d/yr by 30 yrs out
- Wind 8/10 Severe 80% chance of damaging wind over 30 yrs
- Air quality 2/10 Low 1 unhealthy d/yr today · 1 by 30 yrs out
Nearby sold comps map
Loading sold comps map…
Walkable amenities ~0.75 mi
Loading nearby amenities…
Taxation est. · year 1
- Rental income
- $24,648
- − Mortgage interest
- −$17,913
- − Property taxes
- −$759
- − Insurance
- −$1,599
- − Repairs & maintenance
- −$1,972
- − Management
- −$1,972
- − Depreciation
- −$9,303
- Taxable loss
- −$8,869
- Est. tax savings @ 24.0%
- +$2,128
- After-tax cash flow
- $-881/yr
For passive investors: Depreciation is non-cash, so a rental often shows a tax loss while cash-flowing — sheltering income. Rental losses are passive: they offset passive income freely, and up to $25,000/yr can offset ordinary (W-2) income if you actively participate and your MAGI is under $100k (phasing out to $0 by $150k); unused losses carry forward. On sale, claimed depreciation is recaptured at up to 25%, and gains may owe capital-gains tax (a 1031 exchange can defer both). Figures are a year-1 estimate at your 24.0% rate — not tax advice; consult a CPA.
Schools (NCES district)
- District
- Cape Henlopen School District
- NCES district ID
- 1000170
- Math proficiency
- 42% ▼ -14.00%
- Reading proficiency
- 55% ▼ -10.00%
- Median HH income
- $60,196
- Composite
- 42.47/100
- National rank
- #3214
- State rank
- #5 of 26 in DE
Livability — Milton
- Score
- 73/100
- State rank
- #7
- US rank
- #5043
Category grades
Schools grade is shown separately in the Schools card above.
Census & demographics
- Population (ZIP)
- 14,791
Population outlook (Sussex County) Hauer SSP2
- Today (2025)
- 248,853 people
- By 2030
- 264,464 · +6.3%
- By 2040
- 290,980 · +16.9%
- By 2050
- 311,259 · +25.1%
- By 2075
- 352,488 · +41.6%
- By 2100
- 367,406 · +47.6%
Race, ethnicity, and origin ACS 2023
- Neighborhood character
- Predominantly White (85%)
- Race & ethnicity
- White 85% Black 6% Two or more races 5% Hispanic / Latino 4% Asian 2%
- Common ancestry
- Romanian 5% Slovak 2% Iranian 2%
- Foreign-born
- 5% · Canada, Jamaica, Dominican Republic
- Languages at home
- 92% English-only · Spanish 5% Vietnamese 1%
Political lean MEDSL · Sussex
- 2024 margin
- R (+11.0) · D 43.9% · R 54.9% · Other 1.2%
- 2008→2024 swing
- -2.4pp toward R · 2008: -8.6pp · 2024: -11.0pp
- All cycles
- 2024: R+11.0 2020: R+11.2 2016: R+22.0 2012: R+13.0 2008: R+8.6
Not yet ingested
- Civics
- —
Market trends
- HPI YoY
- ▼ -43.93%
- Current HPI
- 349.5055
- Rent YoY
- —
- Metro
- —
- State GDP YoY
- —
- F500 in state
- 0
Price history
+28.0% since first listed6 events — show timeline
- 2026-06-06 Pending — BRIGHT MLS
- 2026-05-07 Listed $319,786 BRIGHT MLS
- 2025-10-17 Sold (Public Records) $210,000 Public Records
- 2025-10-14 Sold (MLS) $210,000 BRIGHT MLS
- 2025-09-24 Pending — BRIGHT MLS
- 2025-09-24 Listed $249,900 BRIGHT MLS
Property tax history
+5.3%/yrLatest (2025): $759 · +34.7% YoY. Source: county tax records.
Cash-flow waterfall
monthlySold comps — $/sqft
last 12 mo · ≤1 miLoading sold comps…