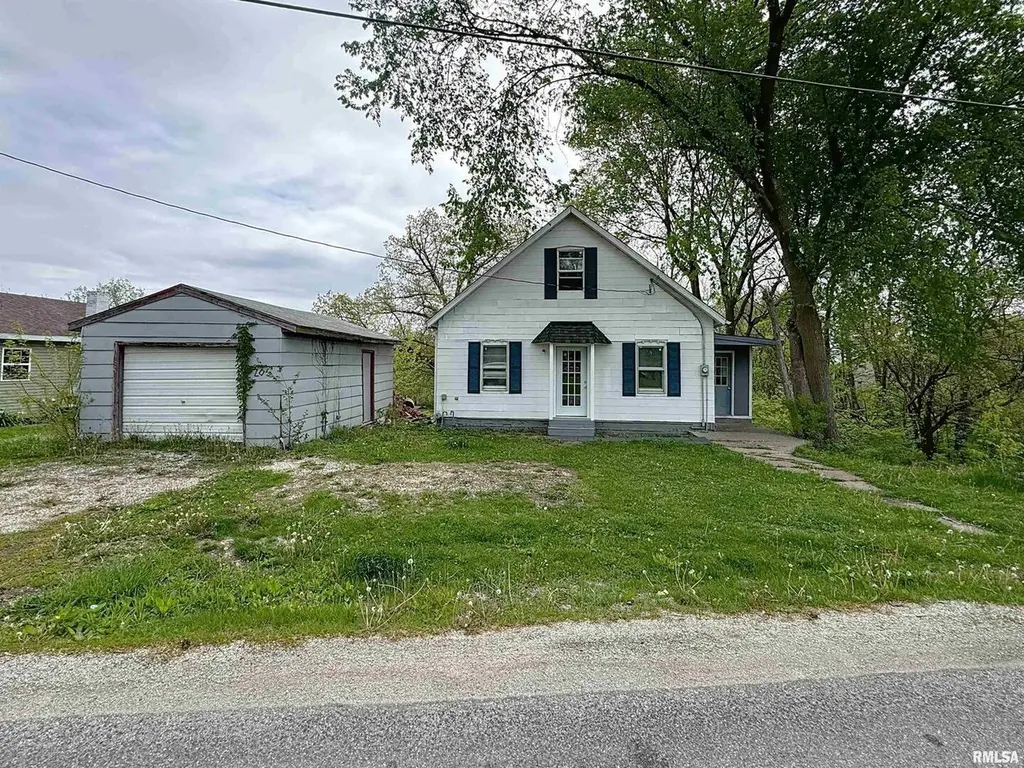
204 Main Ave · Matherville, IL
Flood risk 1/10 · Minimal
- FEMA flood zone
- X (unshaded)
- Chance of flooding over 30 yrs
- 0.0%
- Est. flood insurance / yr
- $507 – $1,088
Fire risk 3/10 · Minor
- Est. fire insurance / yr
- $804 – $1,492
Heat risk 3/10 · Minor
- Hot days now (above 105°F)
- 7 days/yr
- Hot days in 30 yrs
- 16 days/yr
Wind risk 2/10 · Minimal
- Chance of severe wind over 30 yrs
- —
Air-quality risk 2/10 · Minimal
- Unhealthy air days now
- 2 days/yr
- Unhealthy air days in 30 yrs
- 2 days/yr
Risk factors via First Street. Map © Google.
Why this score? — see what drove the B- grade
The composite is a weighted blend of 9 inputs, each scored 0–100. Each bar is that input's sub-score; the figure is the points it added to the 100-point composite (weight × sub-score).
- Cash flow +30.0/30.0
- 1% rule +10.0/10.0
- DSCR +10.0/10.0
- ARV discount +7.5/15.0
- Livability +3.0/5.0
- Schools +2.7/10.0
- Rent growth +2.5/5.0
- Condition / age +2.5/5.0
- Appreciation +0.0/10.0
$44,900
🖨 Deal sheet 📄 Offer letter ✓ Due diligence
Listing remarks
Sitting on nearly an acre in Matherville, this 2-bed, 1-bath, 1.5-story home has been completely transformed from the studs up between 2024-2025. Updates include all-new walls, paint, ceilings, floors, heating, plumbing, windows, & doors. The main floor offers a bright living room, an eat-in kitchen, a full bathroom, & a bedroom. Upstairs features a 2nd bedroom & a walk-through office, den, or 3rd bedroom. The walk-out basement provides laundry hookups & additional storage. Per previous owners: the roof is newer, & the North side foundation was recently replaced. A detached 1-car garage adds convenience, & the large lot gives you space to expand, garden, or s
Key facts
- Nearly an acre
- Large lot
- Bright living room
Tags
Neighborhood map
What this means for you Summary
Snapshot
- This is a 2-bed/1.0-bath townhouse listed at $45k.
Deal economics
- At list price, monthly cash flow is $518 ($6k/yr) — positive.
- The deal already cash-flows at list — no discount required.
- Meets the 1% rule at list price ($1k rent vs $45k).
- Recommended offer: $40k (12.0% below list) — sets the bar for market timing.
Location & tenants
- Location reads 59/100 on livability (#1,074 in IL) — a working-class tenant base; expect higher turnover. Strengths: cost of living A+, housing A+; Watch: employment D+, crime D, schools D-.
- Sherrard CUSD 200 (rural): math 29% / reading 30% proficiency, ranked #240 of 620 in IL (top 39%) — low school quality limits family demand, transient renter base, plan for 1-2y turnover.
- Market conditions: 41 active listings in the ZIP; 15 units permitted in Mercer County in 2024 (0 in 5+ unit buildings).
Forward outlook
- Local home prices are declining (-3.0%/yr); year-one equity from $310 of loan paydown is wiped out by about $1k of value loss. Plan a longer hold.
- Mercer County population projected at -25% by 2050 — secular population decline; favor cash flow + early exit over multi-decade hold.
- At projected returns (-3.0% appreciation + 3.0% rent growth), your $13k cash investment doubles in ~3 years — after that, you're playing with house money.
Negotiation context
- It's been on market 174 days — a 12% lower offer ($40k) is reasonable based on typical stale-listing flexibility.
- 13 sale attempts since 22y ago; this cycle's ask is 157% above the opening price — seller raised mid-cycle; expect resistance to lowballs.
- Current owner paid $29k; list at $45k implies a 55% gain — meaningful room to come down on a strong offer.
Risks & watch-outs
- Watch-outs: built in 1910 — expect roof / HVAC / electrical / plumbing capex.
Questions for the listing agent
- It's been on market 174 days. Have you received any prior offers? Is the seller open to a 12% concession, seller financing, or rate buy-down credit?
- Built in 1910 — when were the roof, HVAC, electrical panel, plumbing, and water heater last replaced?
- Why hasn't it sold? Are there any deal-killer items the seller is aware of (foundation, flood, title, zoning, code violations)?
- Is there a deadline driving the sale (1031 exchange, divorce, estate, relocation)? That informs how much negotiation room exists.
- Schools are D-rated, which usually means shorter tenancies and higher turnover. Who's the typical renter profile here, and what's been the actual vacancy rate?
- Crime grade is D in this area — have there been break-ins, vandalism, or insurance claims at this property in the last 3 years? What carrier currently insures it and at what premium?
- What's the average days-on-market for RENTAL listings here right now (not sales)? A rising rental-DOM trend means longer vacancies and softer asking-rent achievability than the comps imply.
- What's the recent tenant-quality profile in this submarket — average credit score on applications, eviction rate, late-payment / NSF rate, and stable-employment percentage? A property-management company in the area should have these aggregated.
- How much new for-sale + rental construction is in the pipeline within 1–3 miles? Heavy new supply typically softens prices + rents 12–24 months out; constrained supply supports both.
Investment metrics
- 1% rule
- 2.34% ✓
- Cap rate
- 20.14%
- Cash-on-cash
- 49.46%
- DSCR
- 3.20
- GRM
- 3.6
CMA / ARV
- ARV (median comp)
- $109,015
- List price
- $44,900
- Delta
- -58.81%
- Verdict
- UNDERPRICED
- Comps
- 15 within 1.0 mi
Projected returns pro-forma
-3.0% appreciation · 3.0% rent growth · sell at horizon
- IRR
- 47.1%
- Equity multiple
- 3.05×
- Total profit
- $25,744
- Equity at exit
- $6,695
- IRR
- 52.8%
- Equity multiple
- 6.17×
- Total profit
- $64,979
- Equity at exit
- $3,882
Cash invested: $12,572 (down + closing). Projections, not guarantees.
Landlord ↔ Tenant lean methodology
- Overall (STATE)
- 43 Moderately Tenant-Leaning
- State Illinois
- 43 Moderately Tenant-Leaning · D+7
- County
- — inherits STATE
- City
- — inherits STATE
ZIP-level market 61231
- Home prices YoY
- -33.0%
- Active inventory
- 41
- Price-to-rent
- 3.6×
Monthly cashflow live
- Estimated rent
- $1,049 medium interval (Pro) →
- Mortgage (P&I)
- −$235
- Tax est. 1.5%
- −$56 /mo · $674/yr
- Insurance
- −$19
- HOA
- −$0
- Vacancy / Maint / Mgmt
- −$220
- Net cashflow
- $518
Break-even live
UW: 25.0% down · 7.5% · 30yr · 1.5% tax · 5.0% vac · 8.0% maint · 8.0% mgmt
Financing live
Cash to close
- Down payment
- $11,225
- Closing costs
- $1,347
- Reserves months
- —
- Total cash needed
- —
Loan-product check · same deal, 3 products live
Conventional
25% down · 7.5% · 30yr
- Down + closing
- —
- Monthly P&I
- —
- Monthly cashflow
- —
- DSCR
- —
- Eligible?
- —
Personal DTI + credit; lowest rate.
DSCR
20% down · 8.5% · 30yr
- Down + closing
- —
- Monthly P&I
- —
- Monthly cashflow
- —
- DSCR
- —
- Eligible?
- —
No personal income docs; deal must DSCR.
Hard money
10% down · 12.0% · 12mo
- Down + closing
- —
- Monthly P&I
- —
- Monthly cashflow
- —
- DSCR
- —
- Eligible?
- —
Short-term bridge; refi at stabilization.
Listing history 50 events
-
2026-06-18days on market $44,900 Active 174 DOM
-
2026-06-17days on market $44,900 Active 173 DOM
-
2026-06-16days on market $44,900 Active 172 DOM
-
2026-06-15days on market $44,900 Active 171 DOM
-
2026-06-13days on market $44,900 Active 169 DOM
-
2026-06-12days on market $44,900 Active 168 DOM
-
2026-06-09days on market $44,900 Active 165 DOM
-
2026-06-08days on market $44,900 Active 164 DOM
-
2026-06-07days on market $44,900 Active 163 DOM
-
2026-06-07days on market $44,900 Active 162 DOM
-
2026-06-04days on market $44,900 Active 159 DOM
-
2026-06-02days on market $44,900 Active 158 DOM
-
2026-06-01days on market $44,900 Active 157 DOM
-
2026-05-31days on market $44,900 Active 156 DOM
-
2026-05-31days on market $44,900 Active 155 DOM
-
2026-04-30status Active
-
2026-04-22historical
-
2026-04-14price $49,000
-
2026-02-27price $52,000
-
2026-01-15status Active
-
2026-01-14historical
-
2026-01-08status Active
-
2026-01-07historical
-
2026-01-07status Active
-
2026-01-07price $59,000
-
2026-01-06historical
-
2026-01-06historical
-
2026-01-05status Active
-
2026-01-05historical
-
2025-10-22Active
-
2025-07-09historical
-
2025-07-09historical
-
2025-06-19price
-
2025-05-05Active
-
2025-04-07soldstatus $29,000
-
2025-02-24soldstatus $12,000
-
2025-01-31soldstatus $12,000
-
2025-01-31soldstatus $12,000 Closed
-
2025-01-14status Pending
-
2024-10-17$17,500
-
2024-10-17$17,500 Active
-
2024-10-16historical
-
2024-10-15historical
-
2024-07-01price
-
2024-04-15Active
-
2021-08-06historical
-
2021-08-06historical
-
2018-04-11soldstatus $4,650
-
2018-04-11soldstatus $4,650
-
2018-02-09$8,000
ⓘ Source: listings_history table (triggers on properties + properties_extension) + one-shot
backfill from property_details.listing_events for pre-trigger history.
Climate risk First Street
- Flood 1/10 Low FEMA zone X (unshaded) · 0% chance over 30 yrs
- Wildfire 3/10 Moderate
- Heat 3/10 Moderate 7 d/yr ≥105°F today · 16 d/yr by 30 yrs out
- Wind 2/10 Low
- Air quality 2/10 Low 2 unhealthy d/yr today · 2 by 30 yrs out
Nearby sold comps map
Loading sold comps map…
Walkable amenities ~0.75 mi
Loading nearby amenities…
Taxation est. · year 1
- Rental income
- $12,585
- − Mortgage interest
- −$2,515
- − Property taxes
- −$674
- − Insurance
- −$224
- − Repairs & maintenance
- −$1,007
- − Management
- −$1,007
- − Depreciation
- −$1,306
- Taxable income
- $5,852
- Est. tax owed @ 24.0%
- −$1,404
- After-tax cash flow
- $4,814/yr
For passive investors: Depreciation is non-cash, so a rental often shows a tax loss while cash-flowing — sheltering income. Rental losses are passive: they offset passive income freely, and up to $25,000/yr can offset ordinary (W-2) income if you actively participate and your MAGI is under $100k (phasing out to $0 by $150k); unused losses carry forward. On sale, claimed depreciation is recaptured at up to 25%, and gains may owe capital-gains tax (a 1031 exchange can defer both). Figures are a year-1 estimate at your 24.0% rate — not tax advice; consult a CPA.
Schools (NCES district)
- District
- Sherrard CUSD 200
- NCES district ID
- 1736180
- Math proficiency
- 29% ▼ -9.00%
- Reading proficiency
- 30% ▼ -16.00%
- Median HH income
- $60,194
- Composite
- 26.77/100
- National rank
- #7129
- State rank
- #240 of 620 in IL
Livability — Matherville
- Score
- 59/100
- State rank
- #1074
- US rank
- #20507
Category grades
Schools grade is shown separately in the Schools card above.
Census & demographics
- Census place
- Matherville, IL
- Population (ZIP)
- 4,958
Population outlook (Mercer County) Hauer SSP2
- Today (2025)
- 14,595 people
- By 2030
- 13,846 · -5.1%
- By 2040
- 12,335 · -15.5%
- By 2050
- 10,893 · -25.4%
- By 2075
- 8,238 · -43.6%
- By 2100
- 6,111 · -58.1%
Race, ethnicity, and origin ACS 2023
- Neighborhood character
- Predominantly White (93%)
- Race & ethnicity
- White 93% Hispanic / Latino 4% Two or more races 3% Black 1%
- Common ancestry
- Lithuanian 2% Danish 2% Iranian 1%
- Foreign-born
- 1% · Canada
- Languages at home
- 96% English-only · Spanish 3% Arabic 1%
Political lean MEDSL · Mercer
- 2024 margin
- Strong R (+27.1) · D 35.4% · R 62.5% · Other 2.2%
- 2008→2024 swing
- -39.0pp toward R · 2008: 11.9pp · 2024: -27.1pp
- All cycles
- 2024: R+27.1 2020: R+24.0 2016: R+20.7 2012: D+7.4 2008: D+11.9
Not yet ingested
- Civics
- —
Market trends
- HPI YoY
- ▼ -69.03%
- Current HPI
- 140.0
- Rent YoY
- —
- Metro
- —
- State GDP YoY
- ▲ 1.59%
- F500 in state
- 60
Industry mix (Fortune 500 HQ in IL)
| Industry | F500 HQs | Revenue |
|---|---|---|
| Insurance | 4 | $201B |
|
||
| Consumer Goods | 4 | $87B |
|
||
| Industrial Machinery | 3 | $64B |
|
||
| Healthcare | 2 | $55B |
|
||
| Retail / Pharmacy | 1 | $148B |
|
||
| Agriculture / Food | 1 | $86B |
|
||
Price history
-5.8% since first listed38 events — show timeline
- 2026-04-30 Relisted — MRED as Distributed by MLS Grid
- 2026-04-22 Listing Removed — MRED as Distributed by MLS Grid
- 2026-04-14 Price Changed $49,000 MRED as Distributed by MLS Grid
- 2026-02-27 Price Changed $52,000 MRED as Distributed by MLS Grid
- 2026-01-15 Relisted — MRED as Distributed by MLS Grid
- 2026-01-14 Listing Removed — MRED as Distributed by MLS Grid
- 2026-01-08 Relisted — MRED as Distributed by MLS Grid
- 2026-01-07 Listing Removed — MRED as Distributed by MLS Grid
- 2026-01-07 Relisted — MRED as Distributed by MLS Grid
- 2026-01-07 Price Changed $59,000 MRED as Distributed by MLS Grid
- 2026-01-06 Listing Removed — RMLSA as Distributed by MLS Grid
- 2026-01-06 Listing Removed — MRED as Distributed by MLS Grid
- 2026-01-05 Relisted — MRED as Distributed by MLS Grid
- 2026-01-05 Listing Removed — MRED as Distributed by MLS Grid
- 2025-10-22 Listed — RMLSA as Distributed by MLS Grid
- 2025-07-09 Listing Removed — RMLSA as Distributed by MLS Grid
- 2025-07-09 Listing Removed — MRED as Distributed by MLS Grid
- 2025-06-19 Price Changed — RMLSA as Distributed by MLS Grid
- 2025-05-05 Listed — RMLSA as Distributed by MLS Grid
- 2025-04-07 Sold (Public Records) $29,000 Public Records
- 2025-02-24 Sold (Public Records) $12,000 Public Records
- 2025-01-31 Sold (MLS) $12,000 RMLSA as Distributed by MLS Grid
- 2025-01-31 Sold (MLS) $12,000 MRED as Distributed by MLS Grid
- 2025-01-14 Pending — RMLSA as Distributed by MLS Grid
- 2024-10-17 Listed $17,500 RMLSA as Distributed by MLS Grid
- 2024-10-17 Listed $17,500 MRED as Distributed by MLS Grid
- 2024-10-16 Listing Removed — RMLSA as Distributed by MLS Grid
- 2024-10-15 Listing Removed — MRED as Distributed by MLS Grid
- 2024-07-01 Price Changed — RMLSA as Distributed by MLS Grid
- 2024-04-15 Listed — RMLSA as Distributed by MLS Grid
- 2021-08-06 Listing Removed — RMLSA as Distributed by MLS Grid
- 2021-08-06 Listing Removed — RMLSA as Distributed by MLS Grid
- 2018-04-11 Sold (MLS) $4,650 RMLSA as Distributed by MLS Grid
- 2018-04-11 Sold (MLS) $4,650 MRED as Distributed by MLS Grid
- 2018-02-09 Listed $8,000 RMLSA as Distributed by MLS Grid
- 2018-02-09 Listed $8,000 MRED as Distributed by MLS Grid
- 2004-04-30 Sold (MLS) $47,000 RMLSA as Distributed by MLS Grid
- 2004-02-27 Listed $52,000 RMLSA as Distributed by MLS Grid
Property tax history
+5.1%/yrLatest (2024): $2,632 · +12.1% YoY. Source: county tax records.
Cash-flow waterfall
monthlySold comps — $/sqft
last 12 mo · ≤1 miLoading sold comps…