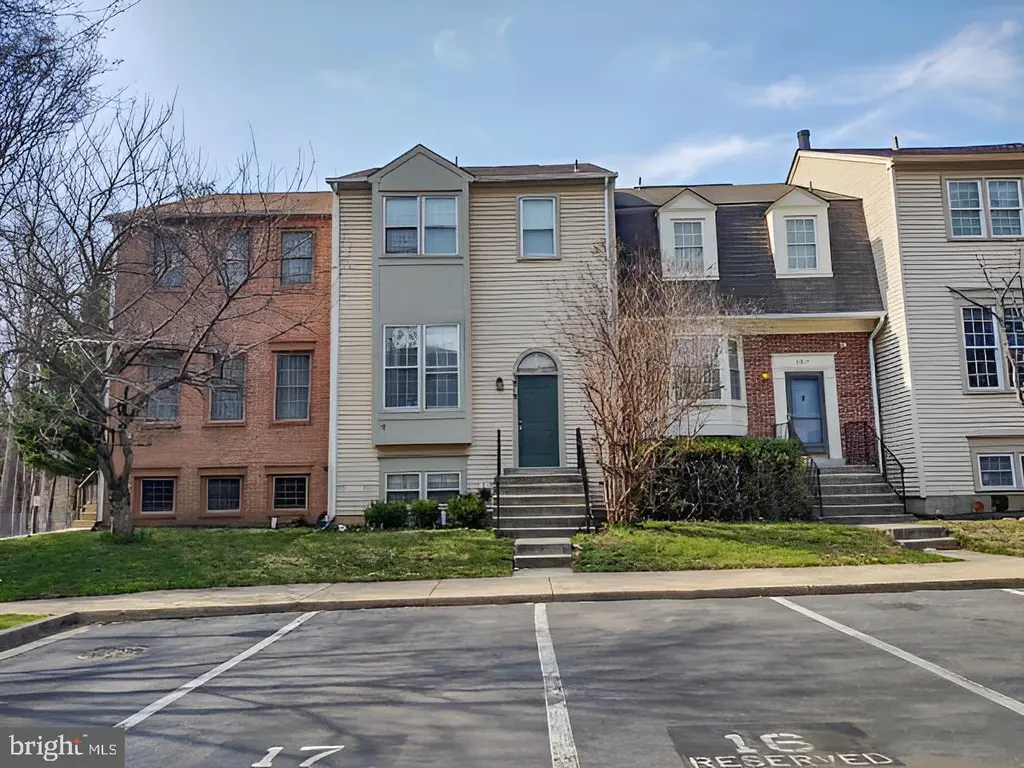
3919 Peppertree Ln · Aspen Hill, MD
Flood risk 1/10 · Minimal
- FEMA flood zone
- X (unshaded)
- Chance of flooding over 30 yrs
- 0.0%
- Est. flood insurance / yr
- $473 – $860
Fire risk 1/10 · Minimal
- Est. fire insurance / yr
- $755 – $1,403
Heat risk 7/10 · Major
- Hot days now (above 102°F)
- 7 days/yr
- Hot days in 30 yrs
- 15 days/yr
Wind risk 4/10 · Minor
- Chance of severe wind over 30 yrs
- 15.0%
Air-quality risk 3/10 · Minor
- Unhealthy air days now
- 2 days/yr
- Unhealthy air days in 30 yrs
- 3 days/yr
Risk factors via First Street. Map © Google.
Why this score? — see what drove the D grade
The composite is a weighted blend of 9 inputs, each scored 0–100. Each bar is that input's sub-score; the figure is the points it added to the 100-point composite (weight × sub-score).
- ARV discount +15.0/15.0
- Cash flow +9.5/30.0
- Schools +3.6/10.0
- Livability +3.5/5.0
- 1% rule +2.9/10.0
- DSCR +2.7/10.0
- Rent growth +2.6/5.0
- Condition / age +2.5/5.0
- Appreciation +0.0/10.0
$359,950
🖨 Deal sheet (PDF) 📄 Offer letter ✓ Due diligence
Listing remarks MLS
4 bedroom 3 bath town home on a quiet street in Silver Spring now available for sale. The property is occupied and no showings are allowed. Offers to purchase are based on the exterior only, and the buyers will be responsible for removing the current occupants. It is unlawful to approach or disturb the occupants, so please do not.
Key facts
- $110 HOA
- 2 parking spots
- Built 1984
Neighborhood map
What this means for you Summary
Snapshot
- This is a 4-bed/3.5-bath townhouse listed at $360k.
Deal economics
- At list price, monthly cash flow is $-247 ($-3k/yr) — negative.
- To cash-flow at today's rent, offer at most $316k (12.1% below list).
- To meet the 1% rule (rent ≥ 1% of price), the offer needs to be $285k (20.9% below list).
- Recommended offer: $285k (20.9% below list) — sets the bar for 1% rule.
- Cap rate 5.5% vs local median 3.6% in Aspen Hill — top-decile yield for the area; either an underpriced asset or a hidden risk that comps aren't pricing in. Stress-test before assuming the spread holds.
Location & tenants
- Location reads 70/100 on livability (#168 in MD) — a middle-class / working-renter tenant base. Strengths: employment A+, housing A-, commute B; Watch: health & safety C-, crime D+, amenities D-.
- Montgomery County Public Schools (suburban): math 27% / reading 45% proficiency, ranked #3 of 24 in MD (top 12%) — families likely to look elsewhere, expect single-tenant / working-renter base with shorter leases.
- Zoned schools: Georgian Forest Elementary (math 9% / reading 15%, grade F, #550 of 860 statewide, top 66%, 519 students, 82% FRL); Argyle Middle (math 8% / reading 32%, grade F, #147 of 225 statewide, top 68%, 995 students, 72% FRL); John F. Kennedy High (math 15% / reading 48%, grade F, #152 of 222 statewide, top 68%, 1,827 students, 77% FRL) — zoned schools average 77% FRL vs 26% district-wide (51 pts higher); higher-poverty schools than district average — tighter screening recommended.
- Zoned-school proficiency averages 21% at this address vs 36% district-wide (-15 pts) — the specific schools serving this property underperform the Montgomery County Public Schools average; the district grade overstates school quality for this exact location.
- Market conditions: Rents flat; 246 active listings in the ZIP; 35 comparable units currently listed for rent nearby; rentals at typical pace (median 24d on market — plan ~3-4 weeks tenant-placement turnaround); solid renter incomes; 3,880 units permitted in Montgomery County in 2024 (2,054 in 5+ unit buildings).
- This rent runs 35% of the median local income ($98k/yr) — at the standard rent-burdened threshold; future hikes will face affordability resistance.
Forward outlook
- Local home prices are declining (-3.0%/yr); year-one equity from $2k of loan paydown is wiped out by about $11k of value loss. Plan a longer hold.
- Montgomery County population projected at +27% by 2050 — long-run rental-demand tailwind backs the buy-and-hold thesis.
Negotiation context
- It's been on market 56 days — a 3% lower offer ($349k) is reasonable based on typical stale-listing flexibility.
- 2 sale attempts since 24y ago; this cycle's ask has dropped $20k (5%) from the opening price — seller is motivated, your offer sets the floor, not the list.
- Current owner paid $201k; list at $360k implies a 79% gain — meaningful room to come down on a strong offer.
Risks & watch-outs
- Climate carrying-cost: extreme-heat days projected 7→15/yr by 2055 (HVAC capex compounding) — expect insurance premiums to compound above CPI over the hold.
Questions for the listing agent
- What do current leases actually rent for vs. the listed asking? Can we see a recent rent roll and the last 12 months of T-12 income?
- It's been on market 56 days. Have you received any prior offers? Is the seller open to a 21% concession, seller financing, or rate buy-down credit?
- What does the HOA fee cover, when was the last increase, and are there any pending special assessments or reserve-fund shortfalls?
- Is there a deadline driving the sale (1031 exchange, divorce, estate, relocation)? That informs how much negotiation room exists.
- Schools are F-rated, which usually means shorter tenancies and higher turnover. Who's the typical renter profile here, and what's been the actual vacancy rate?
- Crime grade is D in this area — have there been break-ins, vandalism, or insurance claims at this property in the last 3 years? What carrier currently insures it and at what premium?
- The area grade is low — what's the realistic commute time and amenity access for the typical tenant pool here? Any planned neighborhood developments (good or bad) we should know about?
- What's the average days-on-market for RENTAL listings here right now (not sales)? A rising rental-DOM trend means longer vacancies and softer asking-rent achievability than the comps imply.
- What's the recent tenant-quality profile in this submarket — average credit score on applications, eviction rate, late-payment / NSF rate, and stable-employment percentage? A property-management company in the area should have these aggregated.
- How much new for-sale + rental construction is in the pipeline within 1–3 miles? Heavy new supply typically softens prices + rents 12–24 months out; constrained supply supports both.
Investment metrics
- 1% rule
- 0.79% ✗
- Cap rate
- 5.47%
- Cash-on-cash
- -2.94%
- DSCR
- 0.87
- GRM
- 10.5
CMA / ARV
- ARV (median comp)
- $469,712
- List price
- $359,950
- Delta
- -23.37%
- Verdict
- UNDERPRICED
- Comps
- 20 within 1.0 mi
Show comp detail 12 sales within ~0.75 mi
| Address | Dist | Beds/Ba | Sqft | Sold | Price | $/sf | Match |
|---|---|---|---|---|---|---|---|
| 3714 Capulet Ter #4 | 0.37mi | 4/3.5 | 1,982 (+3%) | 5mo | $436,000 | $220 | 74 |
| 3737 Capulet Ter #3737 | 0.39mi | 4/3.5 | 2,017 (+5%) | 2mo | $462,000 | $229 | 73 |
| 3715 Capulet Ter Unit 3715-4 | 0.36mi | 3/3.5 (-1) | 1,965 (+2%) | 14mo | $445,000 | $226 | 64 |
| 3133 Beaverwood Ln | 0.39mi | 4/3.5 | 2,118 (+10%) | 2mo | $510,000 | $241 | 63 |
| 3815 Gawayne Ter Unit 31-381 | 0.50mi | 4/3.5 | 1,981 (+3%) | 11mo | $475,000 | $240 | 63 |
| 3830 Tremayne Ter | 0.55mi | 4/3.5 | 1,971 (+2%) | 11mo | $449,000 | $228 | 61 |
| 3731 Capulet Ter #3731 | 0.39mi | 4/4.0 | 2,165 (+12%) | 4mo | $470,000 | $217 | 56 |
| 14628 Tynewick Ter Unit 2-14628 | 0.64mi | 4/3.5 | 1,909 (-1%) | 16mo | $455,000 | $238 | 55 |
| 14530 Banquo Ter #14530 | 0.36mi | 3/2.5 (-1) | 1,760 (-9%) | 10mo | $435,000 | $247 | 51 |
| 3121 Beaverwood Ln | 0.42mi | 5/3.5 (+1) | 2,142 (+11%) | 14mo | $485,000 | $226 | 45 |
| 14613 Tynewick Ter Unit 6-1461 | 0.60mi | 5/3.5 (+1) | 1,650 (-14%) | 5mo | $453,000 | $275 | 38 |
| 14632 Tynewick Ter Unit 2-1463 | 0.65mi | 4/3.5 | 1,650 (-14%) | 14mo | $460,000 | $279 | 34 |
Match score weights: distance 35% · size 25% · config 20% · recency 20%. Top-matched comps best support the ARV.
Projected returns pro-forma
-3.0% appreciation · 0.24% rent growth · sell at horizon
- IRR
- -24.3%
- Equity multiple
- 0.19×
- Total profit
- $-81,718
- Equity at exit
- $53,670
- IRR
- -30.4%
- Equity multiple
- -0.20×
- Total profit
- $-121,122
- Equity at exit
- $31,122
Cash invested: $100,786 (down + closing). Projections, not guarantees.
Landlord ↔ Tenant lean methodology
- Overall (STATE)
- 27 Tenant-Leaning
- State Maryland
- 27 Tenant-Leaning · D+14
- County
- — inherits STATE
- City
- — inherits STATE
ZIP-level market 20906
- Rents YoY
- 0.2%
- Active inventory
- 246
- Price-to-rent
- 10.5×
Monthly cashflow live
- Estimated rent
- $2,849 high interval (Pro) →
- Mortgage (P&I)
- −$1,888
- Tax from tax record
- −$350 /mo · $4,199/yr
- Insurance
- −$150
- HOA
- −$110
- Vacancy / Maint / Mgmt
- −$598
- Net cashflow
- $-247
Break-even live
Sensitivity live
| Price | -10% $-43 | -5% $-145 | +0% $-247 | +5% $-349 | +10% $-451 |
|---|---|---|---|---|---|
| Rent | -10% $-472 | -5% $-360 | +0% $-247 | +5% $-135 | +10% $-22 |
| Rate | -1.0pp $-66 | -0.5pp $-156 | base $-247 | +0.5pp $-340 | +1.0pp $-435 |
UW: 25.0% down · 7.5% · 30yr · 1.5% tax · 5.0% vac · 8.0% maint · 8.0% mgmt
Financing live
Cash to close
- Down payment
- $89,988
- Closing costs
- $10,798
- Reserves months
- —
- Total cash needed
- —
Loan-product check · same deal, 3 products live
Conventional
25% down · 7.5% · 30yr
- Down + closing
- —
- Monthly P&I
- —
- Monthly cashflow
- —
- DSCR
- —
- Eligible?
- —
Personal DTI + credit; lowest rate.
DSCR
20% down · 8.5% · 30yr
- Down + closing
- —
- Monthly P&I
- —
- Monthly cashflow
- —
- DSCR
- —
- Eligible?
- —
No personal income docs; deal must DSCR.
Hard money
10% down · 12.0% · 12mo
- Down + closing
- —
- Monthly P&I
- —
- Monthly cashflow
- —
- DSCR
- —
- Eligible?
- —
Short-term bridge; refi at stabilization.
Rent comps 35 comps
| Address | Beds | Baths | Sqft | Rent | $/sqft | DOM | Units | Dist |
|---|---|---|---|---|---|---|---|---|
| 4108 Peppertree Ln #4108 Silver Spring, MD | 3.0 | 2.0 | 1311 | $2,500 | $1.91 | 21d | 1 | 0.09mi |
| 4118 Peppertree Ln #4118 Silver Spring, MD | 3.0 | 2.0 | 1305 | $2,500 | $1.92 | 23d | 1 | 0.09mi |
| 14120 Weeping Willow Dr Silver Spring, MD | 1.0–3.0 | 1.0–2.0 | 1030 | $2,350 | $2.28 | 0d | 151 | 0.20mi |
| 3810 Chesterwood Dr #3810 Silver Spring, MD | 3.0 | 2.5 | 1350 | $2,500 | $1.85 | 5d | 1 | 0.35mi |
| 3934 Chesterwood Dr #3934 Silver Spring, MD | 3.0 | 2.5 | 1690 | $2,600 | $1.54 | 45d | 1 | 0.42mi |
| 14301 Georgia Ave Silver Spring, MD | 1.0–3.0 | 1.0–2.5 | 935 | $2,767 | $2.96 | 1d | 50 | 0.44mi |
| 3822 Gawayne Ter Unit 32-382 Silver Spring, MD | 3.0 | 2.5 | 1309 | $3,400 | $2.60 | 45d | 1 | 0.47mi |
| 3822 Gawayne Ter Unit 32-382 Silver Spring, MD | 4.0 | 3.5 | 1309 | $3,400 | $2.60 | 20d | 1 | 0.47mi |
| 2943 Saint Helen Cir Silver Spring, MD | 3.0 | 2.5 | 2178 | $3,500 | $1.61 | 3d | 1 | 0.56mi |
| 14602 King Lear Ct Unit 12-146 Silver Spring, MD | 4.0 | 3.5 | 1963 | $3,250 | $1.66 | 45d | 1 | 0.59mi |
| 3331 Hewitt Ave #204 Silver Spring, MD | 3.0 | 2.0 | 1300 | $2,400 | $1.85 | 45d | 1 | 0.64mi |
| 3331 Hewitt Ave #102 Silver Spring, MD | 3.0 | 2.0 | 1300 | $2,400 | $1.85 | 9d | 1 | 0.64mi |
| 3331 Hewitt Ave #104 Silver Spring, MD | 3.0 | 2.0 | 1300 | $2,368 | $1.82 | 23d | 1 | 0.64mi |
| 3331 Hewitt Ave #202 Silver Spring, MD | 3.0 | 2.0 | 1300 | $2,100 | $1.62 | 45d | 1 | 0.64mi |
| 3331 Hewitt Ave #003 Silver Spring, MD | 3.0 | 2.0 | 1300 | $2,472 | $1.90 | 4d | 1 | 0.64mi |
| 3331 Hewitt Ave Unit 1 Silver Spring, MD | 2.0–3.0 | 1.5–2.0 | 1175 | $2,550 | $2.17 | 18d | 8 | 0.66mi |
| 4107 Southend Rd Rockville, MD | 4.0 | 2.5 | 2000 | $3,700 | $1.85 | 23d | 1 | 0.68mi |
| 14231 Clayton St Rockville, MD | 5.0 | 3.5 | 2000 | $3,099 | $1.55 | 23d | 1 | 0.72mi |
| 3700 Ralph Rd Silver Spring, MD | 4.0 | 2.0 | 1769 | $3,650 | $2.06 | 9d | 1 | 0.86mi |
| 13905 Parkland Dr Rockville, MD | 4.0 | 2.5 | 1620 | $3,650 | $2.25 | 23d | 1 | 0.91mi |
| 15101 Glade Dr Unit 10-3G Silver Spring, MD | 3.0 | 2.0 | 1415 | $2,550 | $1.80 | 0d | 1 | 1.02mi |
| 13807 Eastland St Rockville, MD | 4.0 | 3.0 | 1514 | $3,950 | $2.61 | 23d | 1 | 1.06mi |
| 4419 Renn St Rockville, MD | 3.0 | 2.0 | 2044 | $3,000 | $1.47 | 23d | 1 | 1.07mi |
| 13206 Holdridge Rd Silver Spring, MD | 4.0 | 2.0 | 1749 | $3,300 | $1.89 | 26d | 1 | 1.10mi |
| 14426 Taos Ct Unit 5F Silver Spring, MD | 3.0 | 2.0 | 1371 | $2,400 | $1.75 | 16d | 1 | 1.16mi |
| 3330 N Leisure World Blvd Apt 128 Silver Spring, MD | 3.0 | 2.5 | 1530 | $2,900 | $1.90 | 26d | 1 | 1.21mi |
| 4301 Independence St #61 Rockville, MD | 5.0 | 3.0 | 2150 | $3,600 | $1.67 | 0d | 1 | 1.30mi |
| 4301 Independence St #61 Rockville, MD | 5.0 | 2.5 | 2150 | $3,200 | $1.49 | 16d | 1 | 1.30mi |
| 7 Valleyfield Ct Silver Spring, MD | 3.0 | 2.5 | 1656 | $2,700 | $1.63 | 45d | 1 | 1.31mi |
| 14104 Parker Farm Way Unit X Silver Spring, MD | 4.0 | 3.5 | 2430 | $3,199 | $1.32 | 45d | 1 | 1.34mi |
| 15210 Elkridge Way Unit 91-3K Silver Spring, MD | 3.0 | 2.0 | 1340 | $2,700 | $2.01 | 1d | 1 | 1.38mi |
| 15101 Callohan Ct Silver Spring, MD | 3.0 | 3.5 | 1628 | $3,600 | $2.21 | 45d | 1 | 1.44mi |
| 13208 Hathaway Dr Silver Spring, MD | 4.0 | 2.5 | 1794 | $3,300 | $1.84 | 45d | 1 | 1.47mi |
| 2208 Wimbledon Cir Silver Spring, MD | 3.0 | 2.5 | 1376 | $2,995 | $2.18 | 20d | 1 | 1.48mi |
| 14601 Melinda Ln Rockville, MD | 4.0 | 2.5 | 2467 | $4,300 | $1.74 | 16d | 1 | 1.50mi |
HOA detail
- Monthly dues
- $110 · $1,320/yr
Listing history 13 events
-
2026-06-16days on market $359,950 Active 56 DOM
-
2026-06-15days on market $359,950 Active 55 DOM
-
2026-06-13days on market $359,950 Active 53 DOM
-
2026-06-09days on market $359,950 Active 49 DOM
-
2026-06-08days on market $359,950 Active 48 DOM
-
2026-06-07pricedays on market $359,950 Active 47 DOM
-
2026-04-15$379,950 Active 332-char remark
Show marketing remark (332 chars)
4 bedroom 3 bath town home on a quiet street in Silver Spring now available for sale. The property is occupied and no showings are allowed. Offers to purchase are based on the exterior only, and the buyers will be responsible for removing the current occupants. It is unlawful to approach or disturb the occupants, so please do not.
-
2002-06-06soldstatus $201,000
-
2002-05-29soldstatus $201,000 283-char remark
Show marketing remark (283 chars)
SUPER CLEAN, NEW BERBER CARPET, FRESH PAINT, CATHEDRAL CEILINGS, SUNKEN LIVING ROOM, FORMAL DINING ROOM, RECESSED LIGHTING, DECK, ASSIGNED PARKING, VERY QUIET COMMUNITY, LARGE BEDROOMS UPSTAIRS EACH WITH PRIVATE BATH AND AMPLE CLOSETS, THIS ONE REALLY SHINES, CALL NO ANSWER OK TO GO
-
2002-03-29historical 283-char remark
Show marketing remark (283 chars)
SUPER CLEAN, NEW BERBER CARPET, FRESH PAINT, CATHEDRAL CEILINGS, SUNKEN LIVING ROOM, FORMAL DINING ROOM, RECESSED LIGHTING, DECK, ASSIGNED PARKING, VERY QUIET COMMUNITY, LARGE BEDROOMS UPSTAIRS EACH WITH PRIVATE BATH AND AMPLE CLOSETS, THIS ONE REALLY SHINES, CALL NO ANSWER OK TO GO
-
2002-03-27$199,990 283-char remark
Show marketing remark (283 chars)
SUPER CLEAN, NEW BERBER CARPET, FRESH PAINT, CATHEDRAL CEILINGS, SUNKEN LIVING ROOM, FORMAL DINING ROOM, RECESSED LIGHTING, DECK, ASSIGNED PARKING, VERY QUIET COMMUNITY, LARGE BEDROOMS UPSTAIRS EACH WITH PRIVATE BATH AND AMPLE CLOSETS, THIS ONE REALLY SHINES, CALL NO ANSWER OK TO GO
-
1989-07-19soldstatus $144,000
-
1988-04-28soldstatus $116,000
ⓘ Source: listings_history table (triggers on properties + properties_extension) + one-shot
backfill from property_details.listing_events for pre-trigger history.
Tax reassessment forecast MD · Partial reset (capped growth)
- Current annual tax
- $4,199 · $350/mo
- Projected year-2 tax
- $4,199 · $350/mo
- Expected delta
- $0/yr ($0/mo · 0.0%)
ⓘ Screening estimate from a state-policy table — verify with the county assessor before closing.
Climate risk First Street
- Flood 1/10 Low FEMA zone X (unshaded) · 0% chance over 30 yrs
- Wildfire 1/10 Low
- Heat 7/10 Severe 7 d/yr ≥102°F today · 15 d/yr by 30 yrs out
- Wind 4/10 Moderate 15% chance of damaging wind over 30 yrs
- Air quality 3/10 Moderate 2 unhealthy d/yr today · 3 by 30 yrs out
Nearby sold comps map
Loading sold comps map…
Walkable amenities ~0.75 mi
Loading nearby amenities…
Taxation est. · year 1
- Rental income
- $34,183
- − Mortgage interest
- −$20,163
- − Property taxes
- −$4,199
- − Insurance
- −$1,800
- − Repairs & maintenance
- −$2,735
- − Management
- −$2,735
- − HOA
- −$1,320
- − Depreciation
- −$10,471
- Taxable loss
- −$9,239
- Est. tax savings @ 24.0%
- +$2,217
- After-tax cash flow
- $-748/yr
For passive investors: Depreciation is non-cash, so a rental often shows a tax loss while cash-flowing — sheltering income. Rental losses are passive: they offset passive income freely, and up to $25,000/yr can offset ordinary (W-2) income if you actively participate and your MAGI is under $100k (phasing out to $0 by $150k); unused losses carry forward. On sale, claimed depreciation is recaptured at up to 25%, and gains may owe capital-gains tax (a 1031 exchange can defer both). Figures are a year-1 estimate at your 24.0% rate — not tax advice; consult a CPA.
Schools (NCES district)
- District
- Montgomery County Public Schools
- NCES district ID
- 2400480
- Math proficiency
- 27% ▼ -21.00%
- Reading proficiency
- 45% ▼ -10.00%
- Median HH income
- $97,191
- Composite
- 35.62/100
- National rank
- #4889
- State rank
- #3 of 24 in MD
Livability — Aspen Hill
- Score
- 70/100
- State rank
- #168
- US rank
- #7559
Category grades
Schools grade is shown separately in the Schools card above.
Census & demographics
- Census place
- Aspen Hill, MD
- County
- Montgomery County · 961,106 people
- City population
- 102,654
- Metro
- Washington-Arlington-Alexandria, DC-VA-MD-WV
- Population (ZIP)
- 70,595
- Household income
- $97,521
- Rent vs Own
- Severe rent burden
- 2967.0
Population outlook (Montgomery County) Hauer SSP2
- Today (2025)
- 1,173,231 people
- By 2030
- 1,237,402 · +5.5%
- By 2040
- 1,365,115 · +16.4%
- By 2050
- 1,491,592 · +27.1%
- By 2075
- 1,803,893 · +53.8%
- By 2100
- 2,035,619 · +73.5%
Race, ethnicity, and origin ACS 2023
- Neighborhood character
- Highly diverse neighborhood (Simpson 0.76)
- Race & ethnicity
- Hispanic / Latino 32% White 26% Black 25% Asian 11% Two or more races 10%
- Hispanic origin (detail)
- Mexican 2%
- Common ancestry
- Estonian 2% Romanian 2% Scotch-Irish 1%
- Foreign-born
- 42% · Canada, South Korea, Vietnam
- Languages at home
- 46% English-only · Spanish 30% Other Indo-European 6% French/Haitian/Cajun 2%
Political lean MEDSL · Montgomery
- 2024 margin
- Solid D (+53.3) · D 75.2% · R 21.9% · Other 2.9%
- 2008→2024 swing
- +8.7pp toward D · 2008: 44.6pp · 2024: 53.3pp
- All cycles
- 2024: D+53.3 2020: D+59.6 2016: D+55.5 2012: D+43.4 2008: D+44.6
Not yet ingested
- Civics
- —
Market trends
- HPI YoY
- ▼ -366.58%
- Current HPI
- 256.9059
- Rent YoY
- ▲ 0.24%
- Metro
- Washington-Arlington-Alexandria, DC-VA-MD-WV
- State GDP YoY
- ▲ 2.97%
- F500 in state
- 12
Industry mix (Fortune 500 HQ in MD)
| Industry | F500 HQs | Revenue |
|---|---|---|
| Aerospace / Defense | 1 | $71B |
|
||
| Utilities | 1 | $25B |
|
||
| Hotels | 1 | $24B |
|
||
| Consumer Goods | 1 | $7B |
|
||
| Real Estate | 1 | $6B |
|
||
| Chemicals | 1 | $2B |
|
||
Price history
+227.5% since first listed7 events — show timeline
- 2026-04-15 Listed $379,950 BRIGHT MLS
- 2002-06-06 Sold (Public Records) $201,000 Public Records
- 2002-05-29 Sold (MLS) $201,000 MRIS
- 2002-03-29 Delisted — MRIS
- 2002-03-27 Listed $199,990 MRIS
- 1989-07-19 Sold (Public Records) $144,000 Public Records
- 1988-04-28 Sold (Public Records) $116,000 Public Records
Property tax history
+5.1%/yrLatest (2025): $4,199 · +7.3% YoY. Source: county tax records.
Cash-flow waterfall
monthlySold comps — $/sqft
last 12 mo · ≤1 miLoading sold comps…