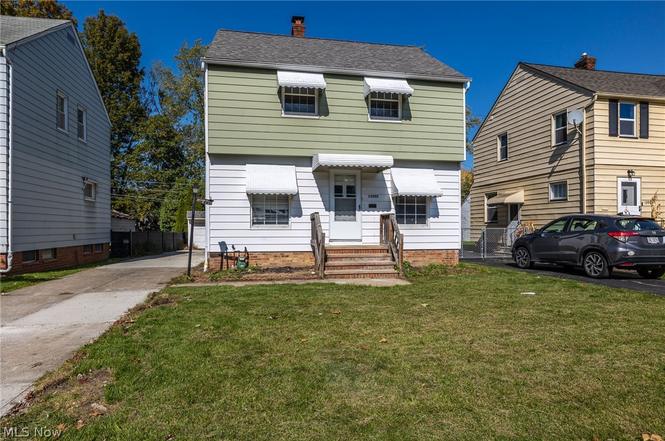
13905 Thraves Ave · Garfield Heights, OH
Flood risk 1/10 · Minimal
- FEMA flood zone
- X (unshaded)
- Chance of flooding over 30 yrs
- 0.0%
- Est. flood insurance / yr
- $473 – $860
Fire risk 1/10 · Minimal
- Est. fire insurance / yr
- $713 – $1,323
Heat risk 3/10 · Minor
- Hot days now (above 95°F)
- 7 days/yr
- Hot days in 30 yrs
- 17 days/yr
Wind risk 1/10 · Minimal
- Chance of severe wind over 30 yrs
- —
Air-quality risk 3/10 · Minor
- Unhealthy air days now
- 2 days/yr
- Unhealthy air days in 30 yrs
- 3 days/yr
Risk factors via First Street. Map © Google.
Why this score? — see what drove the C- grade
The composite is a weighted blend of 9 inputs, each scored 0–100. Each bar is that input's sub-score; the figure is the points it added to the 100-point composite (weight × sub-score).
- Cash flow +19.0/30.0
- ARV discount +10.0/15.0
- DSCR +6.0/10.0
- 1% rule +5.4/10.0
- Rent growth +3.7/5.0
- Livability +3.4/5.0
- Condition / age +2.5/5.0
- Schools +1.3/10.0
- Appreciation +0.0/10.0
$150,000
🖨 Deal sheet 📄 Offer letter ✓ Due diligence
Listing remarks
Welcome to 13905 Thraves Rd! The new renovations speak for themselves including the following udpates: new roof (2025), electric to the garage (2025), hot water tank (2017), newer luxury vinyl flooring throughout, central air, fresh paint throughout, toilets, kitchen cabinets and sink, updated electrical panel, light fixtures, ceiling fans, front and back exterior doors, newer basement carpeting, newer garage door, and newer appliances. Schedule your showing today!
Key facts
- Hot water tank
- Fresh paint
- Central air
Tags
Neighborhood map
What this means for you Summary
Snapshot
- This is a 3-bed/1.5-bath single-family listed at $150k.
Deal economics
- At list price, monthly cash flow is $156 ($2k/yr) — positive.
- The deal already cash-flows at list — no discount required.
- Meets the 1% rule at list price ($2k rent vs $150k).
- Recommended offer: $146k (3.0% below list) — sets the bar for market timing.
Location & tenants
- Location reads 67/100 on livability (#593 in OH) — a middle-class / working-renter tenant base. Strengths: cost of living A+, housing A+, health & safety A; Watch: schools C-, crime D-, amenities F.
- Garfield Heights City Schools (suburban): math 8% / reading 22% proficiency, ranked #643 of 656 in OH (top 98%) — low school quality limits family demand, transient renter base, plan for 1-2y turnover; 64% free/reduced lunch — lower-income household profile, screen leases tightly.
- Market conditions: Rents rising fast (+4.8%/yr); 120 active listings in the ZIP; 36 comparable units currently listed for rent nearby; rentals at typical pace (median 16d on market — plan ~3-4 weeks tenant-placement turnaround); 1,441 units permitted in Cuyahoga County in 2024 (700 in 5+ unit buildings).
- This rent runs 33% of the median local income ($57k/yr) — at the standard rent-burdened threshold; future hikes will face affordability resistance.
Forward outlook
- Local home prices are declining (-3.0%/yr); year-one equity from $1k of loan paydown is wiped out by about $4k of value loss. Plan a longer hold.
- Cuyahoga County population projected to shrink 8% by 2050 — rents likely to lag national; underwrite the cash flow, not the appreciation.
Negotiation context
- It's been on market 59 days — a 3% lower offer ($146k) is reasonable based on typical stale-listing flexibility.
- 12 sale attempts since 23y ago with the ask held roughly flat each time — persistent listings suggest the price (not the market) is what's stuck; bring a comps-based counter.
- Current owner paid $90k; list at $150k implies a 67% gain — meaningful room to come down on a strong offer.
Risks & watch-outs
- Watch-outs: built in 1947 — expect roof / HVAC / electrical / plumbing capex.
Questions for the listing agent
- It's been on market 59 days. Have you received any prior offers? Is the seller open to a 3% concession, seller financing, or rate buy-down credit?
- Built in 1947 — when were the roof, HVAC, electrical panel, plumbing, and water heater last replaced?
- Is there a deadline driving the sale (1031 exchange, divorce, estate, relocation)? That informs how much negotiation room exists.
- Crime grade is D in this area — have there been break-ins, vandalism, or insurance claims at this property in the last 3 years? What carrier currently insures it and at what premium?
- What's the average days-on-market for RENTAL listings here right now (not sales)? A rising rental-DOM trend means longer vacancies and softer asking-rent achievability than the comps imply.
- What's the recent tenant-quality profile in this submarket — average credit score on applications, eviction rate, late-payment / NSF rate, and stable-employment percentage? A property-management company in the area should have these aggregated.
- How much new for-sale + rental construction is in the pipeline within 1–3 miles? Heavy new supply typically softens prices + rents 12–24 months out; constrained supply supports both.
Investment metrics
- 1% rule
- 1.04% ✓
- Cap rate
- 7.54%
- Cash-on-cash
- 4.46%
- DSCR
- 1.20
- GRM
- 8.0
CMA / ARV
- ARV (on-the-fly)
- $158,976
- Comps found
- 12
Show comp detail 12 sales within ~0.75 mi
| Address | Dist | Beds/Ba | Sqft | Sold | Price | $/sf | Match |
|---|---|---|---|---|---|---|---|
| 13513 York Blvd | 0.21mi | 3/1.5 | 1,170 (+2%) | 1mo | $185,900 | $159 | 87 |
| 5853 Monica Ln | 0.08mi | 3/1.5 | 1,299 (+13%) | 0mo | $169,900 | $131 | 75 |
| 5408 Roland Dr | 0.62mi | 3/1.0 | 1,160 (+1%) | 2mo | $142,000 | $122 | 66 |
| 13206 Shady Oak Blvd | 0.45mi | 3/1.0 | 1,080 (-6%) | 2mo | $127,000 | $118 | 65 |
| 6104 Turney Rd | 0.66mi | 3/1.0 | 1,169 (+2%) | 1mo | $202,000 | $173 | 64 |
| 13008 Oakview Blvd | 0.40mi | 3/1.0 | 1,040 (-10%) | 0mo | $137,500 | $132 | 63 |
| 13009 Willard Ave | 0.66mi | 3/2.0 | 1,134 (-2%) | 2mo | $156,500 | $138 | 63 |
| 12416 Eastwood Blvd | 0.66mi | 3/2.0 | 1,102 (-4%) | 1mo | $175,000 | $159 | 59 |
| 13801 Bangor Ave | 0.61mi | 3/1.0 | 1,064 (-8%) | 2mo | $160,000 | $150 | 56 |
| 13004 Rockside Rd | 0.46mi | 3/1.0 | 1,319 (+14%) | 0mo | $154,000 | $117 | 52 |
| 5948 Dunham Rd | 0.73mi | 3/2.0 | 1,072 (-7%) | 2mo | $140,000 | $131 | 51 |
| 13600 Royal Blvd | 0.72mi | 3/2.0 | 1,036 (-10%) | 2mo | $205,000 | $198 | 46 |
Match score weights: distance 35% · size 25% · config 20% · recency 20%. Top-matched comps best support the ARV.
Projected returns pro-forma
-3.0% appreciation · 4.8% rent growth · sell at horizon
- IRR
- -7.2%
- Equity multiple
- 0.73×
- Total profit
- $-11,441
- Equity at exit
- $22,365
- IRR
- 4.6%
- Equity multiple
- 1.36×
- Total profit
- $15,263
- Equity at exit
- $12,969
Cash invested: $42,000 (down + closing). Projections, not guarantees.
Landlord ↔ Tenant lean methodology
- Overall (STATE)
- 73 Landlord-Friendly
- State Ohio
- 73 Landlord-Friendly · R+6
- County
- — inherits STATE
- City
- — inherits STATE
ZIP-level market 44125
- Rents YoY
- 4.8%
- Active inventory
- 120
- Price-to-rent
- 8.0×
Monthly cashflow live
- Estimated rent
- $1,558 high interval (Pro) →
- Mortgage (P&I)
- −$787
- Tax from tax record
- −$226 /mo · $2,707/yr
- Insurance
- −$62
- HOA
- −$0
- Vacancy / Maint / Mgmt
- −$327
- Net cashflow
- $156
Break-even live
UW: 25.0% down · 7.5% · 30yr · 1.5% tax · 5.0% vac · 8.0% maint · 8.0% mgmt
Financing live
Cash to close
- Down payment
- $37,500
- Closing costs
- $4,500
- Reserves months
- —
- Total cash needed
- —
Loan-product check · same deal, 3 products live
Conventional
25% down · 7.5% · 30yr
- Down + closing
- —
- Monthly P&I
- —
- Monthly cashflow
- —
- DSCR
- —
- Eligible?
- —
Personal DTI + credit; lowest rate.
DSCR
20% down · 8.5% · 30yr
- Down + closing
- —
- Monthly P&I
- —
- Monthly cashflow
- —
- DSCR
- —
- Eligible?
- —
No personal income docs; deal must DSCR.
Hard money
10% down · 12.0% · 12mo
- Down + closing
- —
- Monthly P&I
- —
- Monthly cashflow
- —
- DSCR
- —
- Eligible?
- —
Short-term bridge; refi at stabilization.
Rent comps 36 comps
| Address | Beds | Baths | Sqft | Rent | $/sqft | DOM | Units | Dist |
|---|---|---|---|---|---|---|---|---|
| 14100 Brunswick Ave Maple Heights, OH | 3.0 | 1.0 | 1157 | $1,475 | $1.27 | 43d | 1 | 0.16mi |
| 14205 Corridon Ave Maple Heights, OH | 4.0 | 1.5 | 1236 | $1,650 | $1.33 | 23d | 1 | 0.25mi |
| 14519 Tokay Ave Maple Heights, OH | 3.0 | 1.0 | 1230 | $1,325 | $1.08 | 43d | 1 | 0.25mi |
| 13776 Shady Oak Blvd Cleveland, OH | 4.0 | 1.0 | 1170 | $1,600 | $1.37 | 14d | 1 | 0.32mi |
| 14509 Rockside Rd Maple Heights, OH | 3.0 | 2.0 | 1430 | $2,300 | $1.61 | 1d | 1 | 0.35mi |
| 12918 Eastwood Blvd Cleveland, OH | 4.0 | 1.0 | 1170 | $1,295 | $1.11 | 16d | 1 | 0.44mi |
| 12808 Havana Rd Cleveland, OH | 3.0 | 1.0 | 1056 | $1,350 | $1.28 | 16d | 1 | 0.55mi |
| 5973 Turney Rd Cleveland, OH | 3.0 | 1.5 | 1159 | $1,425 | $1.23 | 23d | 1 | 0.59mi |
| 15409 Benhoff Dr Maple Heights, OH | 3.0 | 1.0 | 728 | $1,800 | $2.47 | 1d | 1 | 0.62mi |
| 12211 Woodward Blvd Cleveland, OH | 4.0 | 2.0 | 1236 | $1,500 | $1.21 | 10d | 1 | 0.74mi |
| 12214 Shady Oak Blvd Cleveland, OH | 3.0 | 1.0 | 900 | $1,350 | $1.50 | 23d | 1 | 0.74mi |
| 15312 Ramage Ave Maple Heights, OH | 3.0 | 1.0 | 1060 | $1,595 | $1.50 | 43d | 1 | 0.77mi |
| 5270 Beech Ave Maple Heights, OH | 3.0 | 1.0 | 1401 | $1,350 | $0.96 | 16d | 1 | 0.81mi |
| 16011 Maplewood Ave Maple Heights, OH | 3.0 | 1.0 | 1070 | $1,300 | $1.21 | 43d | 1 | 0.86mi |
| 5283 E 133rd St Cleveland, OH | 3.0 | 2.0 | 1176 | $1,495 | $1.27 | 16d | 1 | 0.89mi |
| 16224 Maplewood Ct Maple Heights, OH | 2.0 | 1.0 | 926 | $1,550 | $1.67 | 16d | 1 | 0.97mi |
| 5200 Miller Ave Maple Heights, OH | 3.0 | 1.0 | 800 | $1,495 | $1.87 | 2d | 1 | 1.08mi |
| 11512 Tonsing Dr Unit 2 UP Garfield Heights, OH | 2.0 | 1.0 | 1145 | $975 | $0.85 | 23d | 1 | 1.10mi |
| 11512 Tonsing Dr Cleveland, OH | 2.0 | 1.0 | 1104 | $1,095 | $0.99 | 16d | 1 | 1.10mi |
| 5445 Lee Rd Unit 6-R Maple Heights, OH | 2.0 | 1.0 | 800 | $1,299 | $1.62 | 7d | 1 | 1.12mi |
| 5164 E 128th St Cleveland, OH | 4.0 | 1.0 | 1222 | $1,495 | $1.22 | 20d | 1 | 1.14mi |
| 5627 Jefferson Ave Maple Heights, OH | 3.0 | 1.0 | 1136 | $1,250 | $1.10 | 7d | 1 | 1.15mi |
| 5581 Saxon Dr Cleveland, OH | 3.0 | 2.0 | 1080 | $1,595 | $1.48 | 7d | 1 | 1.18mi |
| 5223 Paine Ave Maple Heights, OH | 4.0 | 1.0 | 1344 | $1,650 | $1.23 | 1d | 1 | 1.21mi |
| 5074 Miller Ave Maple Heights, OH | 3.0 | 1.0 | 962 | $1,400 | $1.46 | 43d | 1 | 1.29mi |
| 5554 Dalewood Ave Maple Heights, OH | 3.0 | 1.0 | 1150 | $1,500 | $1.30 | 11d | 1 | 1.33mi |
| 16914 Maple Heights Blvd Maple Heights, OH | 3.0 | 1.0 | 1212 | $1,425 | $1.18 | 10d | 1 | 1.35mi |
| 15913 Grant Ave Maple Heights, OH | 3.0 | 1.5 | 1400 | $1,390 | $0.99 | 16d | 1 | 1.39mi |
| 5461 Clement Ave Maple Heights, OH | 3.0 | 1.5 | 1260 | $1,350 | $1.07 | 20d | 1 | 1.40mi |
| 5461 Clement Ave Maple Heights, OH | 3.0 | 1.5 | 1260 | $1,350 | $1.07 | 16d | 1 | 1.40mi |
| 17204 Mapleboro Ave Maple Heights, OH | 3.0 | 1.0 | 1074 | $1,475 | $1.37 | 43d | 1 | 1.41mi |
| 17206 Mapleboro Ave Maple Heights, OH | 3.0 | 1.0 | 1020 | $1,325 | $1.30 | 23d | 1 | 1.42mi |
| 5141 Lee Rd Maple Heights, OH | 1.0–2.0 | 1.0 | 775 | $1,350 | $1.74 | 16d | 5 | 1.43mi |
| 5145 E 114th St Cleveland, OH | 3.0 | 1.5 | 1174 | $1,620 | $1.38 | 7d | 1 | 1.43mi |
| 681 Turney Rd Bedford, OH | 1.0–2.0 | 1.0–1.5 | 795 | $1,500 | $1.89 | 19d | 13 | 1.44mi |
| 681 Turney Rd Bedford, OH | 2.0 | 1.0 | 1030 | $1,500 | $1.46 | 3d | 1 | 1.44mi |
Listing history 42 events
-
2026-03-30status Pending
-
2026-02-10price $150,000
-
2026-01-30$155,000 Active
-
2026-01-07historical
-
2025-12-30price $160,000
-
2025-09-29price $169,000
-
2025-08-25$174,000 Active
-
2025-02-21historical
-
2024-12-08$150,000 Active
-
2024-11-30historical
-
2024-07-23price $146,999
-
2024-07-08price $147,000
-
2024-06-25status Active
-
2024-06-14historical Contingent
-
2024-06-13price $149,999
-
2024-06-13status Active
-
2024-05-31historical Contingent
-
2024-05-09$145,000 Active
-
2024-04-08historical
-
2024-03-15historical Contingent
-
2024-03-03status Active
-
2024-02-27historical Contingent
-
2024-02-22price $140,000
-
2024-01-21$145,000 Active
-
2023-12-21price $139,000
-
2023-11-09price $140,000
-
2023-09-26price $145,000
-
2023-09-11price $147,500
-
2023-08-21$150,000 Active
-
2023-02-23soldstatus $90,000 Closed
-
2023-02-23soldstatus $90,000
-
2022-12-30status Pending
-
2022-12-27historical Contingent
-
2022-11-13price $109,500
-
2022-10-26price $115,900
-
2022-09-21$120,000 Active
-
2013-05-30soldstatus $46,000
-
2013-03-31historical
-
2012-03-31$38,750
-
2003-07-30soldstatus $107,900
-
2003-07-28soldstatus $107,900
-
2003-05-29$109,900
ⓘ Source: listings_history table (triggers on properties + properties_extension) + one-shot
backfill from property_details.listing_events for pre-trigger history.
Tax reassessment forecast OH · Partial reset (capped growth)
- Current annual tax
- $2,707 · $226/mo
- Projected year-2 tax
- $2,707 · $226/mo
- Expected delta
- $0/yr ($0/mo · 0.0%)
ⓘ Screening estimate from a state-policy table — verify with the county assessor before closing.
Climate risk First Street
- Flood 1/10 Low FEMA zone X (unshaded) · 0% chance over 30 yrs
- Wildfire 1/10 Low
- Heat 3/10 Moderate 7 d/yr ≥95°F today · 17 d/yr by 30 yrs out
- Wind 1/10 Low
- Air quality 3/10 Moderate 2 unhealthy d/yr today · 3 by 30 yrs out
Nearby sold comps map
Loading sold comps map…
Walkable amenities ~0.75 mi
Loading nearby amenities…
Taxation est. · year 1
- Rental income
- $18,697
- − Mortgage interest
- −$8,402
- − Property taxes
- −$2,707
- − Insurance
- −$750
- − Repairs & maintenance
- −$1,496
- − Management
- −$1,496
- − Depreciation
- −$4,364
- Taxable loss
- −$518
- Est. tax savings @ 24.0%
- +$124
- After-tax cash flow
- $1,998/yr
For passive investors: Depreciation is non-cash, so a rental often shows a tax loss while cash-flowing — sheltering income. Rental losses are passive: they offset passive income freely, and up to $25,000/yr can offset ordinary (W-2) income if you actively participate and your MAGI is under $100k (phasing out to $0 by $150k); unused losses carry forward. On sale, claimed depreciation is recaptured at up to 25%, and gains may owe capital-gains tax (a 1031 exchange can defer both). Figures are a year-1 estimate at your 24.0% rate — not tax advice; consult a CPA.
Schools (NCES district)
- District
- Garfield Heights City Schools
- NCES district ID
- 3904404
- Math proficiency
- 8% ▼ -19.00%
- Reading proficiency
- 22% ▼ -18.00%
- Median HH income
- $41,334
- Composite
- 12.88/100
- National rank
- #9590
- State rank
- #643 of 656 in OH
Livability — Garfield Heights
- Score
- 67/100
- State rank
- #593
- US rank
- #10152
Category grades
Schools grade is shown separately in the Schools card above.
Census & demographics
- Census place
- Garfield Heights, OH
- County
- Cuyahoga County · 1,090,369 people
- City population
- 29,461
- Metro
- Cleveland-Elyria, OH
- Population (ZIP)
- 29,461
- Household income
- $57,363
- Rent vs Own
- Severe rent burden
- 1738.0
Population outlook (Cuyahoga County) Hauer SSP2
- Today (2025)
- 1,244,621 people
- By 2030
- 1,230,093 · -1.2%
- By 2040
- 1,189,108 · -4.5%
- By 2050
- 1,145,706 · -7.9%
- By 2075
- 1,076,557 · -13.5%
- By 2100
- 978,987 · -21.3%
Race, ethnicity, and origin ACS 2023
- Neighborhood character
- Diverse neighborhood (Simpson 0.61)
- Race & ethnicity
- Black 47% White 41% Two or more races 7% Hispanic / Latino 6%
- Hispanic origin (detail)
- Mexican 2% Puerto Rican 3%
- Common ancestry
- Romanian 11% Slovak 1% Lithuanian 1%
- Foreign-born
- 3% · Canada
- Languages at home
- 94% English-only · Spanish 4% Russian/Polish/Slavic 1%
Political lean MEDSL · Cuyahoga
- 2024 margin
- Solid D (+31.5) · D 65.4% · R 33.9%
- 2008→2024 swing
- -7.4pp toward R · 2008: 38.9pp · 2024: 31.5pp
- All cycles
- 2024: D+31.5 2020: D+34.1 2016: D+35.0 2012: D+38.7 2008: D+38.9
Not yet ingested
- Civics
- —
Market trends
- HPI YoY
- ▼ -116.98%
- Current HPI
- 155.1507
- Rent YoY
- ▲ 4.80%
- Metro
- Cleveland-Elyria, OH
- State GDP YoY
- ▲ 1.98%
- F500 in state
- 48
Industry mix (Fortune 500 HQ in OH)
| Industry | F500 HQs | Revenue |
|---|---|---|
| Insurance | 3 | $145B |
|
||
| Industrial Machinery | 3 | $49B |
|
||
| Financial Services | 3 | $24B |
|
||
| Consumer Goods | 2 | $93B |
|
||
| Aerospace / Defense | 2 | $47B |
|
||
| Utilities | 2 | $33B |
|
||
Price history
+36.5% since first listed42 events — show timeline
- 2026-03-30 Pending — MLSNOW
- 2026-02-10 Price Changed $150,000 MLSNOW
- 2026-01-30 Listed $155,000 MLSNOW
- 2026-01-07 Listing Removed — MLSNOW
- 2025-12-30 Price Changed $160,000 MLSNOW
- 2025-09-29 Price Changed $169,000 MLSNOW
- 2025-08-25 Listed $174,000 MLSNOW
- 2025-02-21 Listing Removed — MLSNOW
- 2024-12-08 Listed $150,000 MLSNOW
- 2024-11-30 Listing Removed — MLSNOW
- 2024-07-23 Price Changed $146,999 MLSNOW
- 2024-07-08 Price Changed $147,000 MLSNOW
- 2024-06-25 Relisted — MLSNOW
- 2024-06-14 Contingent — MLSNOW
- 2024-06-13 Price Changed $149,999 MLSNOW
- 2024-06-13 Relisted — MLSNOW
- 2024-05-31 Contingent — MLSNOW
- 2024-05-09 Listed $145,000 MLSNOW
- 2024-04-08 Listing Removed — MLSNOW
- 2024-03-15 Contingent — MLSNOW
- 2024-03-03 Relisted — MLSNOW
- 2024-02-27 Contingent — MLSNOW
- 2024-02-22 Price Changed $140,000 MLSNOW
- 2024-01-21 Listed $145,000 MLSNOW
- 2023-12-21 Price Changed $139,000 MLSNOW
- 2023-11-09 Price Changed $140,000 MLSNOW
- 2023-09-26 Price Changed $145,000 MLSNOW
- 2023-09-11 Price Changed $147,500 MLSNOW
- 2023-08-21 Listed $150,000 MLSNOW
- 2023-02-23 Sold (Public Records) $90,000 Public Records
- 2023-02-23 Sold (MLS) $90,000 MLSNOW
- 2022-12-30 Pending — MLSNOW
- 2022-12-27 Contingent — MLSNOW
- 2022-11-13 Price Changed $109,500 MLSNOW
- 2022-10-26 Price Changed $115,900 MLSNOW
- 2022-09-21 Listed $120,000 MLSNOW
- 2013-05-30 Sold (Public Records) $46,000 Public Records
- 2013-03-31 Listing Removed — MLSNOW
- 2012-03-31 Listed $38,750 MLSNOW
- 2003-07-30 Sold (MLS) $107,900 MLSNOW
- 2003-07-28 Sold (Public Records) $107,900 Public Records
- 2003-05-29 Listed $109,900 MLSNOW
Property tax history
+0.2%/yrLatest (2025): $2,707 · -19.3% YoY. Source: county tax records.
Cash-flow waterfall
monthlySold comps — $/sqft
last 12 mo · ≤1 miLoading sold comps…