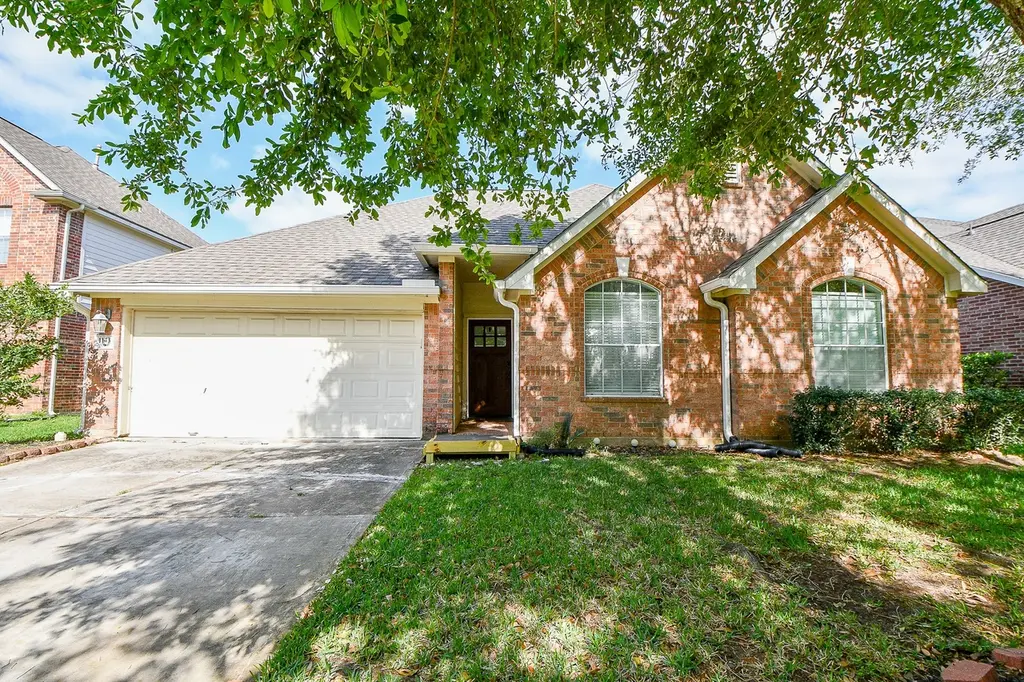
1143 Oxford Mills Ln · Sugar Land, TX
Flood risk 4/10 · Minor
- FEMA flood zone
- X
- Chance of flooding over 30 yrs
- 0.23%
- Est. flood insurance / yr
- $507 – $1,088
Fire risk 2/10 · Minimal
- Est. fire insurance / yr
- $1,222 – $2,270
Heat risk 9/10 · Severe
- Hot days now (above 110°F)
- 7 days/yr
- Hot days in 30 yrs
- 24 days/yr
Wind risk 9/10 · Severe
- Chance of severe wind over 30 yrs
- 99.0%
Air-quality risk 2/10 · Minimal
- Unhealthy air days now
- 1 days/yr
- Unhealthy air days in 30 yrs
- 2 days/yr
Risk factors via First Street. Map © Google.
Why this score? — see what drove the C- grade
The composite is a weighted blend of 9 inputs, each scored 0–100. Each bar is that input's sub-score; the figure is the points it added to the 100-point composite (weight × sub-score).
- Cash flow +18.8/30.0
- ARV discount +9.4/15.0
- 1% rule +6.0/10.0
- DSCR +5.9/10.0
- Schools +4.5/10.0
- Livability +4.0/5.0
- Rent growth +2.7/5.0
- Condition / age +2.5/5.0
- Appreciation +0.0/10.0
$354,900
🖨 Deal sheet (PDF) 📄 Offer letter ✓ Due diligence
Listing remarks MLS
Beautiful home in a quiet neighborhood. Easy access for TX-99 and 59. House has waterproof laminated flooring and tiles. Study room with built ins. Kitchen upgrades with plenty of cabinet space. Also a big yard with a covered gazebo big enough for the family to barbecue. Property has never flooded.
Key facts
- Wonderful gazebo
- Recent roof
- Lvp flooring
Tags
Property features AI
Finance
- Other: Seller disclosure available
- HOA & community: Member of NTRCA; Annual association fee; Association amenities include clubhouse, pool, playground, tennis courts, sport court, picnic area; Association fee covers clubhouse, common areas, and recreation facilities
Exterior
- Parking: Attached 2-car garage; Attached garage parking
- Utilities: Public water; Public sewer
- Home design: Residential property; Single-story entry (rooms listed on first floor)
- Construction: Built in 2001; Brick and cement siding exterior; Composition roof; Slab foundation
- Exterior features: Subdivision lot; Asphalt road access; Association pool
Interior
- Kitchen: Electric oven; Gas range; Microwave; Garbage disposal; Granite counters
- Bedrooms: Primary bedroom on first floor (approx. 14x14); Two additional bedrooms on first floor (each approx. 10x10)
- Flooring: Laminate
- Bathrooms: 2 full bathrooms
- Heating & cooling: Central heating (gas, zoned); Central air conditioning (electric, zoned)
- Interior features: Granite counters; One fireplace; 8 total rooms
- Laundry & utility: Electric dryer hookup; Gas dryer hookup
Neighborhood map
What this means for you Summary
Snapshot
- This is a 4-bed/2.0-bath single-family listed at $355k.
Deal economics
- At list price, monthly cash flow is $358 ($4k/yr) — positive.
- The deal already cash-flows at list — no discount required.
- Meets the 1% rule at list price ($4k rent vs $355k).
- Recommended offer: $334k (6.0% below list) — sets the bar for market timing.
- Cap rate 7.5% vs local median 2.6% in Sugar Land — top-decile yield for the area; either an underpriced asset or a hidden risk that comps aren't pricing in. Stress-test before assuming the spread holds.
Location & tenants
- Location reads 80/100 on livability (#38 in TX, #1,758 nationally) — a professional / high-income tenant draw. Strengths: crime A+, employment A+, housing A+; Watch: cost of living D, commute F.
- Fort Bend ISD (suburban): math 44% / reading 53% proficiency, ranked #140 of 826 in TX (top 17%) — families likely to look elsewhere, expect single-tenant / working-renter base with shorter leases.
- Zoned schools: Brazos Bend El (math 47% / reading 54%, grade D+, #833 of 4,322 statewide, top 20%, 739 students, 44% FRL); Sartartia Middle (math 69% / reading 71%, grade A, #58 of 1,662 statewide, top 4%, 1,440 students, 24% FRL); William B Travis H S (math 44% / reading 73%, grade C, #315 of 1,632 statewide, top 19%, 3,205 students, 39% FRL) — zoned schools at 36% FRL track the district average.
- Market conditions: Rents flat; 570 active listings in the ZIP; 3 comparable units currently listed for rent nearby; rentals lingering (median 45d on market — plan ~5-8 weeks vacancy on turnover, expect pricing pressure); 67% of comp listings sitting > 30 days — soft ceiling on asking rent; high-income renter base; 12,093 units permitted in Fort Bend County in 2024 (815 in 5+ unit buildings).
Forward outlook
- Local home prices are declining (-3.0%/yr); year-one equity from $2k of loan paydown is wiped out by about $11k of value loss. Plan a longer hold.
- Fort Bend County population projected at +75% by 2050 — long-run rental-demand tailwind backs the buy-and-hold thesis.
Negotiation context
- It's been on market 61 days — a 6% lower offer ($334k) is reasonable based on typical stale-listing flexibility.
- 8 sale attempts since 18y ago with the ask held roughly flat each time — persistent listings suggest the price (not the market) is what's stuck; bring a comps-based counter.
Risks & watch-outs
- Climate carrying-cost: severe wind risk, 99% chance of damaging wind over 30y; extreme-heat days projected 7→24/yr by 2055 (HVAC capex compounding) — expect insurance premiums to compound above CPI over the hold.
Questions for the listing agent
- It's been on market 61 days. Have you received any prior offers? Is the seller open to a 6% concession, seller financing, or rate buy-down credit?
- What does the HOA fee cover, when was the last increase, and are there any pending special assessments or reserve-fund shortfalls?
- Why hasn't it sold? Are there any deal-killer items the seller is aware of (foundation, flood, title, zoning, code violations)?
- Is there a deadline driving the sale (1031 exchange, divorce, estate, relocation)? That informs how much negotiation room exists.
- Schools are A-rated — typically a magnet for longer-tenancy family renters. What's the average tenant stay here, and is there a school-zone premium baked into asking?
- What's the average days-on-market for RENTAL listings here right now (not sales)? A rising rental-DOM trend means longer vacancies and softer asking-rent achievability than the comps imply.
- What's the recent tenant-quality profile in this submarket — average credit score on applications, eviction rate, late-payment / NSF rate, and stable-employment percentage? A property-management company in the area should have these aggregated.
- How much new for-sale + rental construction is in the pipeline within 1–3 miles? Heavy new supply typically softens prices + rents 12–24 months out; constrained supply supports both.
Investment metrics
- 1% rule
- 1.10% ✓
- Cap rate
- 7.50%
- Cash-on-cash
- 4.32%
- DSCR
- 1.19
- GRM
- 7.6
CMA / ARV
- ARV (median comp)
- $370,693
- List price
- $354,900
- Delta
- -4.26%
- Verdict
- FAIR
- Comps
- 20 within 1.0 mi
Show comp detail 12 sales within ~0.75 mi
| Address | Dist | Beds/Ba | Sqft | Sold | Price | $/sf | Match |
|---|---|---|---|---|---|---|---|
| 818 Presley Way | 0.39mi | 3/2.0 (-1) | 2,049 (+2%) | 6mo | $335,000 | $163 | 69 |
| 1210 Cambrian Park Ct | 0.07mi | 4/2.5 | 2,265 (+12%) | 6mo | $349,999 | $155 | 69 |
| 1114 Foxland Chase St | 0.09mi | 4/2.0 | 2,315 (+15%) | 5mo | $369,000 | $159 | 67 |
| 1111 Cambrian Park Ct | 0.10mi | 4/2.5 | 2,265 (+12%) | 8mo | $409,999 | $181 | 66 |
| 4419 Zimmerly Ct | 0.41mi | 3/2.0 (-1) | 1,993 (-1%) | 10mo | $325,000 | $163 | 65 |
| 918 Featherbrook Ct | 0.29mi | 4/2.5 | 2,251 (+12%) | 2mo | $311,000 | $138 | 63 |
| 1110 Kerri Ct | 0.28mi | 4/2.5 | 2,265 (+12%) | 4mo | $336,000 | $148 | 61 |
| 4815 Knights Branch Dr | 0.24mi | 3/2.5 (-1) | 2,281 (+13%) | 0mo | $328,000 | $144 | 60 |
| 546 Ivy Cross Ln | 0.57mi | 4/2.0 | 2,236 (+11%) | 2mo | $365,000 | $163 | 54 |
| 915 Featherbrook Ct | 0.28mi | 3/2.5 (-1) | 2,274 (+13%) | 10mo | $350,000 | $154 | 50 |
| 5527 Santa Chase Lane Ln | 0.67mi | 4/2.5 | 2,147 (+6%) | 9mo | $345,000 | $161 | 48 |
| 715 Tyler Run Run | 0.59mi | 3/2.0 (-1) | 2,268 (+12%) | 8mo | $349,000 | $154 | 40 |
Match score weights: distance 35% · size 25% · config 20% · recency 20%. Top-matched comps best support the ARV.
Projected returns pro-forma
-3.0% appreciation · 0.82% rent growth · sell at horizon
- IRR
- -12.2%
- Equity multiple
- 0.57×
- Total profit
- $-42,860
- Equity at exit
- $52,917
- IRR
- -7.1%
- Equity multiple
- 0.60×
- Total profit
- $-39,953
- Equity at exit
- $30,685
Cash invested: $99,372 (down + closing). Projections, not guarantees.
Landlord ↔ Tenant lean methodology
- Overall (STATE)
- 87 Strongly Landlord-Friendly
- State Texas
- 87 Strongly Landlord-Friendly · R+5
- County
- — inherits STATE
- City
- — inherits STATE
ZIP-level market 77479
- Home prices YoY
- -34.9%
- Rents YoY
- 0.8%
- Active inventory
- 570
- Price-to-rent
- 7.6×
Monthly cashflow live
- Estimated rent
- $3,903 medium interval (Pro) →
- Mortgage (P&I)
- −$1,861
- Tax from tax record
- −$623 /mo · $7,481/yr
- Insurance
- −$148
- HOA
- −$93
- Vacancy / Maint / Mgmt
- −$820
- Net cashflow
- $358
Break-even live
Sensitivity live
| Price | -10% $559 | -5% $458 | +0% $358 | +5% $258 | +10% $157 |
|---|---|---|---|---|---|
| Rent | -10% $50 | -5% $204 | +0% $358 | +5% $512 | +10% $666 |
| Rate | -1.0pp $537 | -0.5pp $448 | base $358 | +0.5pp $266 | +1.0pp $172 |
UW: 25.0% down · 7.5% · 30yr · 1.5% tax · 5.0% vac · 8.0% maint · 8.0% mgmt
Financing live
Cash to close
- Down payment
- $88,725
- Closing costs
- $10,647
- Reserves months
- —
- Total cash needed
- —
Loan-product check · same deal, 3 products live
Conventional
25% down · 7.5% · 30yr
- Down + closing
- —
- Monthly P&I
- —
- Monthly cashflow
- —
- DSCR
- —
- Eligible?
- —
Personal DTI + credit; lowest rate.
DSCR
20% down · 8.5% · 30yr
- Down + closing
- —
- Monthly P&I
- —
- Monthly cashflow
- —
- DSCR
- —
- Eligible?
- —
No personal income docs; deal must DSCR.
Hard money
10% down · 12.0% · 12mo
- Down + closing
- —
- Monthly P&I
- —
- Monthly cashflow
- —
- DSCR
- —
- Eligible?
- —
Short-term bridge; refi at stabilization.
Rent comps 3 comps
| Address | Beds | Baths | Sqft | Rent | $/sqft | DOM | Units | Dist |
|---|---|---|---|---|---|---|---|---|
| 4315 Trailwood Dr Sugar Land, TX | 4.0 | 2.5 | 2250 | $5,800 | $2.58 | 14d | 1 | 0.62mi |
| 107 High Meadows Dr Sugar Land, TX | 4.0 | 3.0 | 2619 | $2,600 | $0.99 | 45d | 1 | 1.03mi |
| 1919 Canyon Crest Dr Sugar Land, TX | 4.0 | 2.0 | 2478 | $2,400 | $0.97 | 45d | 1 | 1.12mi |
HOA detail
- Monthly dues
- $93 · $1,116/yr
- Likely covers
- water
Listing history 39 events
-
2026-06-21days on market $354,900 Active 61 DOM
-
2026-06-18days on market $354,900 Active 58 DOM
-
2026-06-17days on market $354,900 Active 57 DOM
-
2026-06-16days on market $354,900 Active 56 DOM
-
2026-06-15days on market $354,900 Active 55 DOM
-
2026-06-13days on market $354,900 Active 53 DOM
-
2026-06-09days on market $354,900 Active 49 DOM
-
2026-06-07days on market $354,900 Active 47 DOM
-
2026-06-04days on market $354,900 Active 44 DOM
-
2026-06-03days on market $354,900 Active 43 DOM
-
2026-06-02days on market $354,900 Active 42 DOM
-
2026-06-01days on market $354,900 Active 41 DOM
-
2026-05-31days on market $354,900 Active 40 DOM
-
2026-04-21$354,900 Active 992-char remark
-
2026-03-31historical
-
2025-10-05status Active
-
2025-09-30historical
-
2025-05-13price $359,000
-
2025-03-19$375,000 Active
-
2024-05-23soldstatus
-
2024-05-21soldstatus Sold
Show marketing remark (300 chars)
Beautiful home in a quiet neighborhood. Easy access for TX-99 and 59. House has waterproof laminated flooring and tiles. Study room with built ins. Kitchen upgrades with plenty of cabinet space. Also a big yard with a covered gazebo big enough for the family to barbecue. Property has never flooded.
-
2024-04-21status Pending
Show marketing remark (300 chars)
Beautiful home in a quiet neighborhood. Easy access for TX-99 and 59. House has waterproof laminated flooring and tiles. Study room with built ins. Kitchen upgrades with plenty of cabinet space. Also a big yard with a covered gazebo big enough for the family to barbecue. Property has never flooded.
-
2024-04-16status Option Pending
Show marketing remark (300 chars)
Beautiful home in a quiet neighborhood. Easy access for TX-99 and 59. House has waterproof laminated flooring and tiles. Study room with built ins. Kitchen upgrades with plenty of cabinet space. Also a big yard with a covered gazebo big enough for the family to barbecue. Property has never flooded.
-
2024-03-22$339,000 Active
Show marketing remark (300 chars)
Beautiful home in a quiet neighborhood. Easy access for TX-99 and 59. House has waterproof laminated flooring and tiles. Study room with built ins. Kitchen upgrades with plenty of cabinet space. Also a big yard with a covered gazebo big enough for the family to barbecue. Property has never flooded.
-
2023-09-30historical
-
2023-05-20price $364,998
-
2023-04-18$369,998 Active
-
2020-01-02soldstatus
-
2019-12-31soldstatus Sold
-
2019-12-12status Pending
-
2019-12-01status Option Pending
-
2019-10-29$239,900 Active
-
2013-06-18soldstatus
-
2013-06-17soldstatus Sold
-
2013-06-03status Pending, Continue to Show
-
2013-05-23status Option Pending
-
2013-05-15$194,500 Active
-
2009-02-02historical
-
2008-11-04$188,900
ⓘ Source: listings_history table (triggers on properties + properties_extension) + one-shot
backfill from property_details.listing_events for pre-trigger history.
Tax reassessment forecast TX · Resets to sale price
- Current annual tax
- $7,481 · $623/mo
- Projected year-2 tax
- $7,481 · $623/mo
- Expected delta
- $0/yr ($0/mo · 0.0%)
ⓘ Screening estimate from a state-policy table — verify with the county assessor before closing.
Climate risk First Street
- Flood 4/10 Moderate FEMA zone X · 23% chance over 30 yrs
- Wildfire 2/10 Low
- Heat 9/10 Extreme 7 d/yr ≥110°F today · 24 d/yr by 30 yrs out
- Wind 9/10 Extreme 99% chance of damaging wind over 30 yrs
- Air quality 2/10 Low 1 unhealthy d/yr today · 2 by 30 yrs out
Nearby sold comps map
Loading sold comps map…
Walkable amenities ~0.75 mi
Loading nearby amenities…
Taxation est. · year 1
- Rental income
- $46,837
- − Mortgage interest
- −$19,880
- − Property taxes
- −$7,481
- − Insurance
- −$1,774
- − Repairs & maintenance
- −$3,747
- − Management
- −$3,747
- − HOA
- −$1,116
- − Depreciation
- −$10,324
- Taxable loss
- −$1,233
- Est. tax savings @ 24.0%
- +$296
- After-tax cash flow
- $4,592/yr
For passive investors: Depreciation is non-cash, so a rental often shows a tax loss while cash-flowing — sheltering income. Rental losses are passive: they offset passive income freely, and up to $25,000/yr can offset ordinary (W-2) income if you actively participate and your MAGI is under $100k (phasing out to $0 by $150k); unused losses carry forward. On sale, claimed depreciation is recaptured at up to 25%, and gains may owe capital-gains tax (a 1031 exchange can defer both). Figures are a year-1 estimate at your 24.0% rate — not tax advice; consult a CPA.
Schools (NCES district)
- District
- Fort Bend ISD
- NCES district ID
- 4819650
- Math proficiency
- 44% ▼ -15.00%
- Reading proficiency
- 53% ▼ -4.00%
- Median HH income
- $82,360
- Composite
- 44.61/100
- National rank
- #2779
- State rank
- #140 of 826 in TX
Livability — Sugar Land
- Score
- 80/100
- State rank
- #38
- US rank
- #1758
Category grades
Schools grade is shown separately in the Schools card above.
Census & demographics
- Census place
- Sugar Land, TX
- County
- Fort Bend County · 836,777 people
- City population
- 168,209
- Metro
- Houston-The Woodlands-Sugar Land, TX
- Population (ZIP)
- 92,221
- Household income
- $156,735
- Rent vs Own
- Severe rent burden
- 1207.0
Population outlook (Fort Bend County) Hauer SSP2
- Today (2025)
- 1,004,526 people
- By 2030
- 1,153,104 · +14.8%
- By 2040
- 1,453,718 · +44.7%
- By 2050
- 1,753,781 · +74.6%
- By 2075
- 2,455,772 · +144.5%
- By 2100
- 2,930,528 · +191.7%
Race, ethnicity, and origin ACS 2023
- Neighborhood character
- Diverse neighborhood (Simpson 0.67)
- Race & ethnicity
- Asian 47% White 30% Hispanic / Latino 10% Black 8% Two or more races 8%
- Hispanic origin (detail)
- Mexican 5%
- Common ancestry
- Lithuanian 2% Romanian 1% Slovak 1%
- Foreign-born
- 42% · China, Canada, Vietnam
- Languages at home
- 52% English-only · Other Indo-European 16% Chinese 13% Spanish 6%
Political lean MEDSL · Fort Bend
- 2024 margin
- Toss-up / Even · D 49.5% · R 47.9% · Other 2.6%
- 2008→2024 swing
- +4.0pp toward D · 2008: -2.4pp · 2024: 1.6pp
- All cycles
- 2024: D+1.6 2020: D+10.6 2016: D+6.6 2012: R+6.8 2008: R+2.4
Not yet ingested
- Civics
- —
Market trends
- HPI YoY
- ▼ -121.96%
- Current HPI
- 227.7544
- Rent YoY
- ▲ 0.82%
- Metro
- Houston-The Woodlands-Sugar Land, TX
- State GDP YoY
- ▲ 3.95%
- F500 in state
- 110
Industry mix (Fortune 500 HQ in TX)
| Industry | F500 HQs | Revenue |
|---|---|---|
| Energy | 16 | $1,198B |
|
||
| Technology | 5 | $198B |
|
||
| Engineering / Construction | 4 | $72B |
|
||
| Energy Services | 3 | $60B |
|
||
| Utilities | 3 | $41B |
|
||
| Healthcare | 2 | $330B |
|
||
Price history
+87.9% since first listed26 events — show timeline
- 2026-04-21 Listed $354,900 HARMLS
- 2026-03-31 Listing Removed — HARMLS
- 2025-10-05 Relisted — HARMLS
- 2025-09-30 Listing Removed — HARMLS
- 2025-05-13 Price Changed $359,000 HARMLS
- 2025-03-19 Listed $375,000 HARMLS
- 2024-05-23 Sold (Public Records) — Public Records
- 2024-05-21 Sold (MLS) — HARMLS
- 2024-04-21 Pending — HARMLS
- 2024-04-16 Pending — HARMLS
- 2024-03-22 Listed $339,000 HARMLS
- 2023-09-30 Listing Removed — HARMLS
- 2023-05-20 Price Changed $364,998 HARMLS
- 2023-04-18 Listed $369,998 HARMLS
- 2020-01-02 Sold (Public Records) — Public Records
- 2019-12-31 Sold (MLS) — HARMLS
- 2019-12-12 Pending — HARMLS
- 2019-12-01 Pending — HARMLS
- 2019-10-29 Listed $239,900 HARMLS
- 2013-06-18 Sold (Public Records) — Public Records
- 2013-06-17 Sold (MLS) — HARMLS
- 2013-06-03 Pending — HARMLS
- 2013-05-23 Pending — HARMLS
- 2013-05-15 Listed $194,500 HARMLS
- 2009-02-02 Listing Removed — HARMLS
- 2008-11-04 Listed $188,900 HARMLS
Property tax history
+3.5%/yrLatest (2025): $7,481 · +1.5% YoY. Source: county tax records.
Cash-flow waterfall
monthlySold comps — $/sqft
last 12 mo · ≤1 miLoading sold comps…