 🏢 Co-op
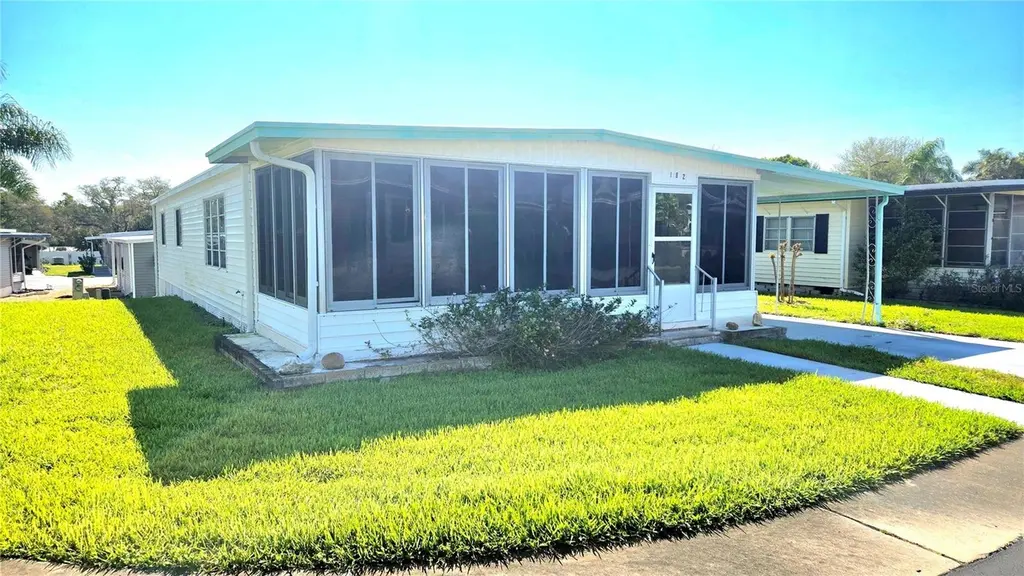
39820 US Highway 19 N #182 · Tarpon Springs, FL
Flood risk 1/10 · Minimal
- FEMA flood zone
- X (unshaded)
- Chance of flooding over 30 yrs
- 0.0%
- Est. flood insurance / yr
- $507 – $1,088
Fire risk 1/10 · Minimal
- Est. fire insurance / yr
- $947 – $1,759
Heat risk 10/10 · Severe
- Hot days now (above 109°F)
- 7 days/yr
- Hot days in 30 yrs
- 25 days/yr
Wind risk 10/10 · Severe
- Chance of severe wind over 30 yrs
- 99.0%
Air-quality risk 3/10 · Minor
- Unhealthy air days now
- 2 days/yr
- Unhealthy air days in 30 yrs
- 2 days/yr
Risk factors via First Street. Map © Google.
Why this score? — see what drove the B+ grade
The composite is a weighted blend of 9 inputs, each scored 0–100. Each bar is that input's sub-score; the figure is the points it added to the 100-point composite (weight × sub-score).
- Cash flow +30.0/30.0
- ARV discount +15.0/15.0
- 1% rule +10.0/10.0
- DSCR +10.0/10.0
- Schools +4.3/10.0
- Livability +3.4/5.0
- Condition / age +2.5/5.0
- Rent growth +2.2/5.0
- Appreciation +0.0/10.0
$99,900
🖨 Deal sheet 📄 Offer letter ✓ Due diligence
Listing remarks MLS
Sought after Stonehedge 55+ Co-OP. Excellent location and high and dry. The clubhouse, heated pool, and shuffleboard abound with activities. This spacious well kept home is complete with furnishings. The Co-Op share is included in the price.
Key facts
- 2 parking spots
- Community pool
- Built 1974
Property features AI
Finance
- Other: Lease restrictions apply; Property is furnished
- Financial info: Total monthly HOA fees $380 (total annual $4,560)
- HOA & community: HOA required with monthly fee of $380; Association amenities: clubhouse, pool, recreation facilities, shuffleboard court, security, maintenance, storage, cable TV, internet, trash, water, sewer, common area taxes, management, pest control, private road; Buyer/association approval required; Senior community with community features such as sidewalks and street lights; Pets allowed (cats OK, with limits); Association contact listed
Exterior
- Parking: Covered driveway with tandem parking; 2-car carport
- Security: Community security included (HOA amenity)
- Utilities: Public water and well water available; Public sewer; Electricity connected; Cable and high-speed internet available; Water connected; Sewer connected; Sprinkler meter and sprinkler well
- Home design: Residential double-wide mobile home; One story; Wheelchair/grip-accessible features; Faces west
- Construction: Vinyl siding; Membrane and metal roof; Pillar/post/pier foundation; Completed condition
- Exterior features: Awnings; Exterior lighting; Rain gutters; Sidewalks; Sliding doors; Sprinkler (metered and well); Storage shed; Shed(s)/storage
Interior
- Kitchen: Dishwasher; Microwave; Range; Range hood; Refrigerator; Exhaust fan; Electric water heater
- Bedrooms: 2 bedrooms
- Flooring: Carpet; Linoleum
- Bathrooms: 2 full bathrooms
- Heating & cooling: Central heating; Central air conditioning
- Interior features: Ceiling fans; Eat-in kitchen; Laundry/utility room features present; Living/dining areas; Thermostat; Walk-in closet(s); Window treatments (blinds, drapes and rods)
- Laundry & utility: Washer; Dryer
Neighborhood map
What this means for you Summary
Snapshot
- This is a 2-bed/2.0-bath manufactured listed at $100k.
Deal economics
- At list price, monthly cash flow is $505 ($6k/yr) — positive.
- The deal already cash-flows at list — no discount required.
- Meets the 1% rule at list price ($2k rent vs $100k).
- Recommended offer: $94k (6.0% below list) — sets the bar for market timing.
- Cap rate 12.4% vs local median 3.4% in Tarpon Springs — top-decile yield for the area; either an underpriced asset or a hidden risk that comps aren't pricing in. Stress-test before assuming the spread holds.
Location & tenants
- Location reads 68/100 on livability (#502 in FL) — a middle-class / working-renter tenant base. Strengths: housing A+, cost of living A, schools A-; Watch: employment C-, amenities F, commute F.
- Pinellas (suburban): math 51% / reading 51% proficiency, ranked #31 of 73 in FL (top 42%) — acceptable for families but not a draw, mixed tenant base, ~2y average lease.
- Market conditions: Rents soft (-1.2%/yr); 399 active listings in the ZIP; 26 comparable units currently listed for rent nearby; rentals at typical pace (median 22d on market — plan ~3-4 weeks tenant-placement turnaround); 2,676 units permitted in Pinellas County in 2024 (1,422 in 5+ unit buildings).
- This rent runs 30% of the median local income ($75k/yr) — at the standard rent-burdened threshold; future hikes will face affordability resistance.
Forward outlook
- Local home prices are declining (-3.0%/yr); year-one equity from $691 of loan paydown is wiped out by about $3k of value loss. Plan a longer hold.
- Pinellas County population projected at +14% by 2050 — modest demand growth; plan on rents tracking national, not racing it.
- At projected returns (-3.0% appreciation + 0.0% rent growth), your $28k cash investment doubles in ~8 years — after that, you're playing with house money.
Negotiation context
- It's been on market 80 days — a 6% lower offer ($94k) is reasonable based on typical stale-listing flexibility.
- 5 sale attempts since 20y ago; this cycle's ask has dropped $9k (8%) from the opening price — seller is motivated, your offer sets the floor, not the list.
- Current owner paid $63k; list at $100k implies a 59% gain — meaningful room to come down on a strong offer.
Risks & watch-outs
- Watch-outs: HOA is 20% of rent.
- Climate carrying-cost: severe wind risk, 99% chance of damaging wind over 30y; extreme-heat days projected 7→25/yr by 2055 (HVAC capex compounding) — expect insurance premiums to compound above CPI over the hold.
Questions for the listing agent
- It's been on market 80 days. Have you received any prior offers? Is the seller open to a 6% concession, seller financing, or rate buy-down credit?
- Built in 1974 — when were the roof, HVAC, electrical panel, plumbing, and water heater last replaced?
- What does the HOA fee cover, when was the last increase, and are there any pending special assessments or reserve-fund shortfalls?
- Why hasn't it sold? Are there any deal-killer items the seller is aware of (foundation, flood, title, zoning, code violations)?
- Is there a deadline driving the sale (1031 exchange, divorce, estate, relocation)? That informs how much negotiation room exists.
- Schools are A-rated — typically a magnet for longer-tenancy family renters. What's the average tenant stay here, and is there a school-zone premium baked into asking?
- What's the average days-on-market for RENTAL listings here right now (not sales)? A rising rental-DOM trend means longer vacancies and softer asking-rent achievability than the comps imply.
- What's the recent tenant-quality profile in this submarket — average credit score on applications, eviction rate, late-payment / NSF rate, and stable-employment percentage? A property-management company in the area should have these aggregated.
- How much new for-sale + rental construction is in the pipeline within 1–3 miles? Heavy new supply typically softens prices + rents 12–24 months out; constrained supply supports both.
Investment metrics
- 1% rule
- 1.89% ✓
- Cap rate
- 12.36%
- Cash-on-cash
- 21.66%
- DSCR
- 1.96
- GRM
- 4.4
CMA / ARV
- ARV (on-the-fly)
- $163,488
- Comps found
- 3
Show comp detail 3 sales within ~0.75 mi
| Address | Dist | Beds/Ba | Sqft | Sold | Price | $/sf | Match |
|---|---|---|---|---|---|---|---|
| 39820 US Highway 19 N #180 | 0.09mi | 3/2.0 (+1) | 1,296 (+4%) | 8mo | $185,000 | $143 | 78 |
| 39820 US Highway 19 N #10 | 0.09mi | 2/2.0 | 1,320 (+6%) | 20mo | $165,000 | $125 | 70 |
| 39820 US Highway 19 N #9 | 0.09mi | 2/2.0 | 1,104 (-12%) | 11mo | $145,000 | $131 | 67 |
Match score weights: distance 35% · size 25% · config 20% · recency 20%. Top-matched comps best support the ARV.
Projected returns pro-forma
-3.0% appreciation · 0.0% rent growth · sell at horizon
- IRR
- 10.1%
- Equity multiple
- 1.38×
- Total profit
- $10,644
- Equity at exit
- $14,895
- IRR
- 15.9%
- Equity multiple
- 2.08×
- Total profit
- $30,123
- Equity at exit
- $8,638
Cash invested: $27,972 (down + closing). Projections, not guarantees.
Landlord ↔ Tenant lean methodology
- Overall (STATE)
- 87 Strongly Landlord-Friendly
- State Florida
- 87 Strongly Landlord-Friendly · R+3
- County
- — inherits STATE
- City
- — inherits STATE
ZIP-level market 34689
- Rents YoY
- -1.2%
- Active inventory
- 399
- Price-to-rent
- 4.4×
Monthly cashflow live
- Estimated rent
- $1,892 high interval (Pro) →
- Mortgage (P&I)
- −$524
- Tax from tax record
- −$44 /mo · $526/yr
- Insurance
- −$42
- HOA
- −$380
- Vacancy / Maint / Mgmt
- −$397
- Net cashflow
- $505
Break-even live
UW: 25.0% down · 7.5% · 30yr · 1.5% tax · 5.0% vac · 8.0% maint · 8.0% mgmt
Financing live
Cash to close
- Down payment
- $24,975
- Closing costs
- $2,997
- Reserves months
- —
- Total cash needed
- —
Loan-product check · same deal, 3 products live
Conventional
25% down · 7.5% · 30yr
- Down + closing
- —
- Monthly P&I
- —
- Monthly cashflow
- —
- DSCR
- —
- Eligible?
- —
Personal DTI + credit; lowest rate.
DSCR
20% down · 8.5% · 30yr
- Down + closing
- —
- Monthly P&I
- —
- Monthly cashflow
- —
- DSCR
- —
- Eligible?
- —
No personal income docs; deal must DSCR.
Hard money
10% down · 12.0% · 12mo
- Down + closing
- —
- Monthly P&I
- —
- Monthly cashflow
- —
- DSCR
- —
- Eligible?
- —
Short-term bridge; refi at stabilization.
Rent comps 26 comps
| Address | Beds | Baths | Sqft | Rent | $/sqft | DOM | Units | Dist |
|---|---|---|---|---|---|---|---|---|
| 39650 US Highway 19 N #141 Tarpon Springs, FL | 2.0 | 2.0 | 950 | $1,550 | $1.63 | 4d | 1 | 0.18mi |
| 640 Haven Pl #640 Tarpon Springs, FL | 2.0 | 1.5 | 960 | $1,595 | $1.66 | 7d | 1 | 0.39mi |
| 673 Haven Pl #673 Tarpon Springs, FL | 2.0 | 1.5 | 960 | $1,450 | $1.51 | 14d | 1 | 0.42mi |
| 501 Saint Michaels Way Unit 520 Tarpon Springs, FL | 2.0 | 2.0 | 1000 | $1,595 | $1.59 | 24d | 1 | 0.46mi |
| 605 S Disston Ave Tarpon Springs, FL | 3.0 | 1.0 | 1290 | $2,120 | $1.64 | 21d | 1 | 0.48mi |
| 524 E Lime St Tarpon Springs, FL | 2.0 | 1.0 | 775 | $1,600 | $2.06 | 24d | 1 | 0.64mi |
| 1113 E Lime St Tarpon Springs, FL | 2.0 | 1.0 | 780 | $1,200 | $1.54 | 3d | 1 | 0.70mi |
| 1185 S Pinellas Ave Tarpon Springs, FL | 1.0–3.0 | 1.0–2.0 | 1013 | $2,154 | $2.12 | 1d | 21 | 0.76mi |
| 650 E Tarpon Ave Unit C1 Tarpon Springs, FL | 3.0 | 2.0 | 900 | $2,000 | $2.22 | 7d | 1 | 0.77mi |
| 326 S Grosse Ave Apt 2 Tarpon Springs, FL | 3.0 | 2.0 | 1130 | $2,098 | $1.86 | 24d | 1 | 0.79mi |
| 320 S Grosse Ave Tarpon Springs, FL | 3.0 | 1.0 | 936 | $1,749 | $1.87 | 24d | 1 | 0.80mi |
| 401 E Boyer St Tarpon Springs, FL | 3.0 | 2.0 | 1130 | $2,099 | $1.86 | 2d | 1 | 0.81mi |
| 401 E Boyer St Unit 3 Tarpon Springs, FL | 3.0 | 2.0 | 1130 | $2,099 | $1.86 | 24d | 1 | 0.81mi |
| 401 E Boyer St Tarpon Springs, FL | 3.0 | 2.0 | 1130 | $2,299 | $2.03 | 24d | 1 | 0.81mi |
| 316 E Boyer St Tarpon Springs, FL | 3.0 | 1.0 | 936 | $1,749 | $1.87 | 24d | 1 | 0.83mi |
| 329 Moorings Cove Dr Tarpon Springs, FL | 2.0 | 2.0 | 1020 | $1,700 | $1.67 | 20d | 1 | 1.03mi |
| 825 Cypress St Tarpon Springs, FL | 1.0–2.0 | 1.0 | 750 | $1,723 | $2.30 | 2d | 6 | 1.04mi |
| 90 S Highland Ave #101 Tarpon Springs, FL | 2.0 | 2.0 | 1130 | $1,795 | $1.59 | 24d | 1 | 1.13mi |
| 1990 Carolina Ave Tarpon Springs, FL | 3.0 | 1.0 | 960 | $1,250 | $1.30 | 21d | 1 | 1.19mi |
| 610 N Walton Ave Tarpon Springs, FL | 3.0 | 2.0 | 1280 | $2,045 | $1.60 | 24d | 1 | 1.21mi |
| 103 E Park St Tarpon Springs, FL | 3.0 | 1.0 | 999 | $3,000 | $3.00 | 24d | 1 | 1.22mi |
| 707 E Spruce St Tarpon Springs, FL | 3.0 | 1.0 | 967 | $1,700 | $1.76 | 10d | 1 | 1.23mi |
| 817 Margo St Tarpon Springs, FL | 2.0 | 1.0 | 792 | $1,600 | $2.02 | 24d | 1 | 1.25mi |
| 105 S Spring Blvd Unit 10 Tarpon Springs, FL | 1.0 | 1.0 | 700 | $1,350 | $1.93 | 24d | 1 | 1.31mi |
| 2350 Cypress Pond Rd Palm Harbor, FL | 1.0–2.0 | 1.0–2.0 | 790 | $1,670 | $2.11 | 1d | 54 | 1.44mi |
| 605 Lennox Rd W Palm Harbor, FL | 2.0 | 2.0 | 1050 | $1,950 | $1.86 | 3d | 1 | 1.44mi |
HOA detail
- Monthly dues
- $380 · $4,560/yr
- Likely covers
- pool
Listing history 21 events
-
2026-06-18days on market $99,900 Active 80 DOM
-
2026-06-17days on market $99,900 Active 79 DOM
-
2026-06-16days on market $99,900 Active 78 DOM
-
2026-06-15days on market $99,900 Active 77 DOM
-
2026-06-13days on market $99,900 Active 75 DOM
-
2026-06-09days on market $99,900 Active 71 DOM
-
2026-06-08days on market $99,900 Active 70 DOM
-
2026-06-07days on market $99,900 Active 69 DOM
-
2026-06-04days on market $99,900 Active 66 DOM
-
2026-06-03days on market $99,900 Active 65 DOM
-
2026-06-01days on market $99,900 Active 63 DOM
-
2026-05-31days on market $99,900 Active 62 DOM
-
2026-04-29price $99,900
-
2026-03-30$109,000 Active
-
2008-11-19soldstatus $63,000
-
2008-11-18soldstatus $63,000 241-char remark
Show marketing remark (241 chars)
Sought after Stonehedge 55+ Co-OP. Excellent location and high and dry. The clubhouse, heated pool, and shuffleboard abound with activities. This spacious well kept home is complete with furnishings. The Co-Op share is included in the price.
-
2008-08-26$70,000 241-char remark
Show marketing remark (241 chars)
Sought after Stonehedge 55+ Co-OP. Excellent location and high and dry. The clubhouse, heated pool, and shuffleboard abound with activities. This spacious well kept home is complete with furnishings. The Co-Op share is included in the price.
-
2007-09-12$70,000
-
2007-03-05$75,000
-
2006-11-15$75,000
-
2003-08-04soldstatus $43,800
ⓘ Source: listings_history table (triggers on properties + properties_extension) + one-shot
backfill from property_details.listing_events for pre-trigger history.
Tax reassessment forecast FL · Resets to sale price
- Current annual tax
- $526 · $44/mo
- Projected year-2 tax
- $829 · $69/mo
- Expected delta
- +$303/yr (+$25/mo · 57.6%)
ⓘ Screening estimate from a state-policy table — verify with the county assessor before closing.
Climate risk First Street
- Flood 1/10 Low FEMA zone X (unshaded) · 0% chance over 30 yrs
- Wildfire 1/10 Low
- Heat 10/10 Extreme 7 d/yr ≥109°F today · 25 d/yr by 30 yrs out
- Wind 10/10 Extreme 99% chance of damaging wind over 30 yrs
- Air quality 3/10 Moderate 2 unhealthy d/yr today · 2 by 30 yrs out
Nearby sold comps map
Loading sold comps map…
Walkable amenities ~0.75 mi
Loading nearby amenities…
Taxation est. · year 1
- Rental income
- $22,699
- − Mortgage interest
- −$5,596
- − Property taxes
- −$526
- − Insurance
- −$500
- − Repairs & maintenance
- −$1,816
- − Management
- −$1,816
- − HOA
- −$4,560
- − Depreciation
- −$2,906
- Taxable income
- $4,979
- Est. tax owed @ 24.0%
- −$1,195
- After-tax cash flow
- $4,865/yr
For passive investors: Depreciation is non-cash, so a rental often shows a tax loss while cash-flowing — sheltering income. Rental losses are passive: they offset passive income freely, and up to $25,000/yr can offset ordinary (W-2) income if you actively participate and your MAGI is under $100k (phasing out to $0 by $150k); unused losses carry forward. On sale, claimed depreciation is recaptured at up to 25%, and gains may owe capital-gains tax (a 1031 exchange can defer both). Figures are a year-1 estimate at your 24.0% rate — not tax advice; consult a CPA.
Schools (NCES district)
- District
- Pinellas
- NCES district ID
- 1201560
- Math proficiency
- 51% ▼ -5.00%
- Reading proficiency
- 51% ▼ -3.00%
- Median HH income
- $46,270
- Composite
- 43.27/100
- National rank
- #3046
- State rank
- #31 of 73 in FL
Livability — Tarpon Springs
- Score
- 68/100
- State rank
- #502
- US rank
- #9244
Category grades
Schools grade is shown separately in the Schools card above.
Census & demographics
- Census place
- Tarpon Springs, FL
- County
- Pinellas County · 939,478 people
- City population
- 27,324
- Metro
- Tampa-St. Petersburg-Clearwater, FL
- Population (ZIP)
- 27,324
- Household income
- $74,854
- Rent vs Own
- Severe rent burden
- 721.0
Population outlook (Pinellas County) Hauer SSP2
- Today (2025)
- 1,027,532 people
- By 2030
- 1,063,586 · +3.5%
- By 2040
- 1,125,020 · +9.5%
- By 2050
- 1,168,637 · +13.7%
- By 2075
- 1,265,188 · +23.1%
- By 2100
- 1,260,357 · +22.7%
Race, ethnicity, and origin ACS 2023
- Neighborhood character
- Predominantly White (80%)
- Race & ethnicity
- White 80% Hispanic / Latino 10% Two or more races 7% Black 6%
- Hispanic origin (detail)
- Mexican 2% Puerto Rican 4%
- Common ancestry
- Romanian 6% Lithuanian 3% Slovak 2%
- Foreign-born
- 10% · Canada, Jamaica, Dominican Republic
- Languages at home
- 84% English-only · Other Indo-European 6% Spanish 6% French/Haitian/Cajun 1%
Political lean MEDSL · Pinellas
- 2024 margin
- Lean R (+5.2) · D 46.9% · R 52.1%
- 2008→2024 swing
- -13.5pp toward R · 2008: 8.3pp · 2024: -5.2pp
- All cycles
- 2024: R+5.2 2020: D+0.2 2016: R+1.1 2012: D+5.6 2008: D+8.3
Not yet ingested
- Civics
- —
Market trends
- HPI YoY
- ▼ -300.96%
- Current HPI
- 303.7434
- Rent YoY
- ▼ -1.16%
- Metro
- Tampa-St. Petersburg-Clearwater, FL
- State GDP YoY
- ▲ 3.28%
- F500 in state
- 36
Industry mix (Fortune 500 HQ in FL)
| Industry | F500 HQs | Revenue |
|---|---|---|
| Industrial Technology | 2 | $29B |
|
||
| Insurance | 2 | $17B |
|
||
| Retail | 1 | $60B |
|
||
| Technology Distribution | 1 | $58B |
|
||
| Homebuilding | 1 | $35B |
|
||
| Technology Manufacturing | 1 | $35B |
|
||
Price history
+128.1% since first listed9 events — show timeline
- 2026-04-29 Price Changed $99,900 Stellar MLS as Distributed by MLS Grid
- 2026-03-30 Listed $109,000 Stellar MLS as Distributed by MLS Grid
- 2008-11-19 Sold (Public Records) $63,000 Public Records
- 2008-11-18 Sold (MLS) $63,000 Stellar MLS as Distributed by MLS Grid
- 2008-08-26 Listed $70,000 Stellar MLS as Distributed by MLS Grid
- 2007-09-12 Listed $70,000 Stellar MLS as Distributed by MLS Grid
- 2007-03-05 Listed $75,000 Stellar MLS as Distributed by MLS Grid
- 2006-11-15 Listed $75,000 Stellar MLS as Distributed by MLS Grid
- 2003-08-04 Sold (Public Records) $43,800 Public Records
Property tax history
-3.6%/yrLatest (2025): $526 · +6.3% YoY. Source: county tax records.
Cash-flow waterfall
monthlySold comps — $/sqft
last 12 mo · ≤1 miLoading sold comps…