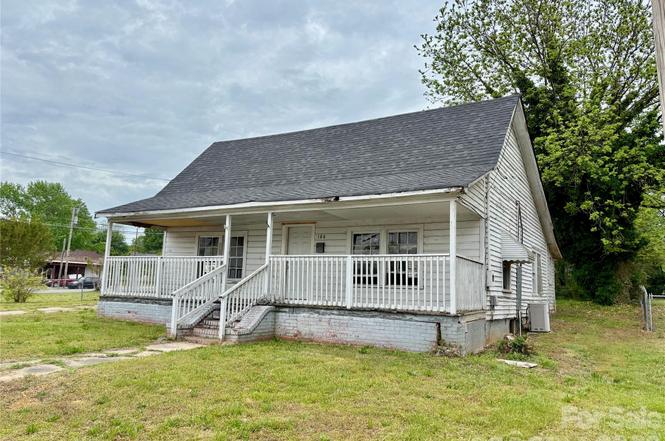
104 E Church St · Dallas, NC
Flood risk 1/10 · Minimal
- FEMA flood zone
- X (unshaded)
- Chance of flooding over 30 yrs
- 0.0%
- Est. flood insurance / yr
- $507 – $1,088
Fire risk 3/10 · Minor
- Est. fire insurance / yr
- $906 – $1,684
Heat risk 6/10 · Moderate
- Hot days now (above 104°F)
- 7 days/yr
- Hot days in 30 yrs
- 18 days/yr
Wind risk 4/10 · Minor
- Chance of severe wind over 30 yrs
- 19.0%
Air-quality risk 3/10 · Minor
- Unhealthy air days now
- 3 days/yr
- Unhealthy air days in 30 yrs
- 3 days/yr
Risk factors via First Street. Map © Google.
Why this score? — see what drove the B- grade
The composite is a weighted blend of 9 inputs, each scored 0–100. Each bar is that input's sub-score; the figure is the points it added to the 100-point composite (weight × sub-score).
- Cash flow +30.0/30.0
- DSCR +10.0/10.0
- 1% rule +9.6/10.0
- ARV discount +7.5/15.0
- Schools +3.6/10.0
- Livability +3.2/5.0
- Condition / age +2.5/5.0
- Rent growth +1.1/5.0
- Appreciation +0.0/10.0
$119,000
🖨 Deal sheet (PDF) 📄 Offer letter ✓ Due diligence
Listing remarks
Investment Opportunity! Located on a . 25 acre lot and only steps from main street, this single-family home offers potential and location value. Located in the city limits, this single family home is zoned commercial but can be used for residential purposes. Some work completed in 2024 including a new roof. Additional storage building on property. Please contact Town of Dallas for clarification of use.
Key facts
- Zoned commercial
- New roof
- 0.25 acre lot
Tags
Neighborhood map
What this means for you Summary
Snapshot
- This is a 3-bed/1.0-bath single-family listed at $119k.
Deal economics
- At list price, monthly cash flow is $624 ($7k/yr) — positive.
- The deal already cash-flows at list — no discount required.
- Meets the 1% rule at list price ($2k rent vs $119k).
- Recommended offer: $115k (3.0% below list) — sets the bar for market timing.
- Cap rate 12.6% vs local median 5.2% in Dallas — top-decile yield for the area; either an underpriced asset or a hidden risk that comps aren't pricing in. Stress-test before assuming the spread holds.
Location & tenants
- Location reads 65/100 on livability (#299 in NC) — a middle-class / working-renter tenant base. Strengths: cost of living A+, housing A+; Watch: amenities F, commute F, employment F.
- Gaston County Schools (suburban): math 44% / reading 42% proficiency, ranked #93 of 178 in NC (top 52%) — families likely to look elsewhere, expect single-tenant / working-renter base with shorter leases.
- Zoned schools: Carr Elementary (math 39% / reading 31%, grade F, #825 of 1,410 statewide, top 59%, 633 students, 100% FRL); W C Friday Middle School (math 38% / reading 42%, grade F, #222 of 475 statewide, top 49%, 605 students, 74% FRL); North Gaston High (math 49% / reading 42%, grade D-, #347 of 535 statewide, top 65%, 1,134 students, 63% FRL) — zoned schools average 79% FRL vs 37% district-wide (42 pts higher); higher-poverty schools than district average — tighter screening recommended.
- Market conditions: Rents falling (-5.5%/yr); 93 active listings in the ZIP; 12 comparable units currently listed for rent nearby; rentals at typical pace (median 23d on market — plan ~3-4 weeks tenant-placement turnaround); 2,069 units permitted in Gaston County in 2024 (142 in 5+ unit buildings).
- This rent runs 34% of the median local income ($62k/yr) — at the standard rent-burdened threshold; future hikes will face affordability resistance.
Forward outlook
- Local home prices are declining (-3.0%/yr); year-one equity from $823 of loan paydown is wiped out by about $4k of value loss. Plan a longer hold.
- Gaston County population projected at +12% by 2050 — modest demand growth; plan on rents tracking national, not racing it.
- At projected returns (-3.0% appreciation + 0.0% rent growth), your $33k cash investment doubles in ~7 years — after that, you're playing with house money.
Negotiation context
- It's been on market 36 days — a 3% lower offer ($115k) is reasonable based on typical stale-listing flexibility.
- 2 sale attempts with the ask held roughly flat each time — persistent listings suggest the price (not the market) is what's stuck; bring a comps-based counter.
Risks & watch-outs
- Watch-outs: built in 1920 — expect roof / HVAC / electrical / plumbing capex.
- Climate carrying-cost: extreme-heat days projected 7→18/yr by 2055 (HVAC capex compounding) — expect insurance premiums to compound above CPI over the hold.
Questions for the listing agent
- It's been on market 36 days. Have you received any prior offers? Is the seller open to a 3% concession, seller financing, or rate buy-down credit?
- Built in 1920 — when were the roof, HVAC, electrical panel, plumbing, and water heater last replaced?
- Is there a deadline driving the sale (1031 exchange, divorce, estate, relocation)? That informs how much negotiation room exists.
- Schools are D-rated, which usually means shorter tenancies and higher turnover. Who's the typical renter profile here, and what's been the actual vacancy rate?
- What's the average days-on-market for RENTAL listings here right now (not sales)? A rising rental-DOM trend means longer vacancies and softer asking-rent achievability than the comps imply.
- What's the recent tenant-quality profile in this submarket — average credit score on applications, eviction rate, late-payment / NSF rate, and stable-employment percentage? A property-management company in the area should have these aggregated.
- How much new for-sale + rental construction is in the pipeline within 1–3 miles? Heavy new supply typically softens prices + rents 12–24 months out; constrained supply supports both.
Investment metrics
- 1% rule
- 1.46% ✓
- Cap rate
- 12.58%
- Cash-on-cash
- 22.46%
- DSCR
- 2.00
- GRM
- 5.7
CMA / ARV
- ARV (on-the-fly)
- $250,342
- Comps found
- 12
Show comp detail 12 sales within ~0.75 mi
| Address | Dist | Beds/Ba | Sqft | Sold | Price | $/sf | Match |
|---|---|---|---|---|---|---|---|
| 104 E Church St | 0.00mi | 3/1.0 | 1,258 (0%) | 1mo | $80,000 | $64 | 100 |
| 505 E Cloninger St | 0.40mi | 3/2.0 | 1,318 (+5%) | 2mo | $262,000 | $199 | 68 |
| 507 E Cloninger St | 0.41mi | 3/2.0 | 1,282 (+2%) | 8mo | $255,000 | $199 | 67 |
| 418 S Spargo St | 0.47mi | 3/2.0 | 1,301 (+3%) | 4mo | $227,000 | $174 | 65 |
| 405 E Holly St | 0.36mi | 3/2.5 | 1,290 (+2%) | 10mo | $269,900 | $209 | 65 |
| 406 S Gaston St | 0.27mi | 2/1.0 (-1) | 1,175 (-7%) | 13mo | $205,000 | $174 | 61 |
| 110 N Davis St | 0.44mi | 2/1.5 (-1) | 1,339 (+6%) | 2mo | $239,000 | $178 | 60 |
| 504 W Church St | 0.35mi | 2/1.0 (-1) | 1,133 (-10%) | 4mo | $235,000 | $207 | 59 |
| 105 Chadwick Cir | 0.52mi | 3/2.0 | 1,096 (-13%) | 1mo | $201,500 | $184 | 49 |
| 404 W Lee St | 0.35mi | 3/2.5 | 1,436 (+14%) | 6mo | $306,000 | $213 | 49 |
| 426 Dallas Stanley Hwy | 0.62mi | 3/2.0 | 1,402 (+11%) | 2mo | $210,000 | $150 | 46 |
| 418 Dallas Stanley Hwy | 0.58mi | 3/1.0 | 1,107 (-12%) | 12mo | $249,900 | $226 | 43 |
Match score weights: distance 35% · size 25% · config 20% · recency 20%. Top-matched comps best support the ARV.
Projected returns pro-forma
-3.0% appreciation · 0.0% rent growth · sell at horizon
- IRR
- 12.0%
- Equity multiple
- 1.46×
- Total profit
- $15,329
- Equity at exit
- $17,743
- IRR
- 18.6%
- Equity multiple
- 2.34×
- Total profit
- $44,733
- Equity at exit
- $10,289
Cash invested: $33,320 (down + closing). Projections, not guarantees.
Landlord ↔ Tenant lean methodology
- Overall (STATE)
- 85 Strongly Landlord-Friendly
- State North Carolina
- 85 Strongly Landlord-Friendly · R+3
- County
- — inherits STATE
- City
- — inherits STATE
ZIP-level market 28034
- Home prices YoY
- -24.6%
- Rents YoY
- -5.5%
- Active inventory
- 93
- Price-to-rent
- 5.7×
Monthly cashflow live
- Estimated rent
- $1,739 high interval (Pro) →
- Mortgage (P&I)
- −$624
- Tax from tax record
- −$77 /mo · $918/yr
- Insurance
- −$50
- HOA
- −$0
- Vacancy / Maint / Mgmt
- −$365
- Net cashflow
- $624
Break-even live
Sensitivity live
| Price | -10% $691 | -5% $657 | +0% $624 | +5% $590 | +10% $556 |
|---|---|---|---|---|---|
| Rent | -10% $486 | -5% $555 | +0% $624 | +5% $692 | +10% $761 |
| Rate | -1.0pp $684 | -0.5pp $654 | base $624 | +0.5pp $593 | +1.0pp $562 |
UW: 25.0% down · 7.5% · 30yr · 1.5% tax · 5.0% vac · 8.0% maint · 8.0% mgmt
Financing live
Cash to close
- Down payment
- $29,750
- Closing costs
- $3,570
- Reserves months
- —
- Total cash needed
- —
Loan-product check · same deal, 3 products live
Conventional
25% down · 7.5% · 30yr
- Down + closing
- —
- Monthly P&I
- —
- Monthly cashflow
- —
- DSCR
- —
- Eligible?
- —
Personal DTI + credit; lowest rate.
DSCR
20% down · 8.5% · 30yr
- Down + closing
- —
- Monthly P&I
- —
- Monthly cashflow
- —
- DSCR
- —
- Eligible?
- —
No personal income docs; deal must DSCR.
Hard money
10% down · 12.0% · 12mo
- Down + closing
- —
- Monthly P&I
- —
- Monthly cashflow
- —
- DSCR
- —
- Eligible?
- —
Short-term bridge; refi at stabilization.
Rent comps 12 comps
| Address | Beds | Baths | Sqft | Rent | $/sqft | DOM | Units | Dist |
|---|---|---|---|---|---|---|---|---|
| 303 E Ingle St Dallas, NC | 3.0 | 1.5 | 1000 | $1,450 | $1.45 | 23d | 1 | 0.31mi |
| 405 S Starr St Unit B Dallas, NC | 2.0 | 2.0 | 998 | $1,510 | $1.51 | 25d | 1 | 0.48mi |
| 110 Stillwell St Dallas, NC | 3.0 | 1.5 | 1010 | $1,660 | $1.64 | 0d | 1 | 0.61mi |
| 1004 Davis Hills Dr Dallas, NC | 3.0 | 2.5 | 1690 | $2,100 | $1.24 | 25d | 1 | 0.66mi |
| 308 North St Dallas, NC | 3.0 | 1.0 | 1053 | $1,325 | $1.26 | 23d | 1 | 0.66mi |
| 500 Chapman Pointe Cir Dallas, NC | 2.0 | 2.0 | 950 | $1,536 | $1.62 | 0d | 3 | 0.82mi |
| 119 Evans Lake Rd Dallas, NC | 2.0 | 1.0 | 900 | $1,185 | $1.32 | 3d | 2 | 0.84mi |
| 5004 Broad Leaf Ct Dallas, NC | 3.0 | 2.5 | 1828 | $2,000 | $1.09 | 0d | 1 | 0.84mi |
| 6008 Bradford Ct Dallas, NC | 3.0 | 2.0 | 1160 | $1,719 | $1.48 | 25d | 1 | 0.95mi |
| 5703 Erin Dr Dallas, NC | 2.0 | 2.5 | 1111 | $1,565 | $1.41 | 14d | 1 | 1.06mi |
| 1116 Lower Dallas Hwy Dallas, NC | 4.0 | 1.5 | 1525 | $1,695 | $1.11 | 25d | 1 | 1.08mi |
| 1301 Limestone Ct Dallas, NC | 2.0–3.0 | 2.0 | 1393 | $2,381 | $1.71 | 0d | 6 | 1.32mi |
Listing history 4 events
-
2026-02-21status Pending
-
2026-01-16$119,000 Active
-
2025-10-13status Pending
-
2025-05-15$119,000 Active
ⓘ Source: listings_history table (triggers on properties + properties_extension) + one-shot
backfill from property_details.listing_events for pre-trigger history.
Tax reassessment forecast NC · Resets to sale price
- Current annual tax
- $918 · $77/mo
- Projected year-2 tax
- $976 · $81/mo
- Expected delta
- +$57/yr (+$5/mo · 6.3%)
ⓘ Screening estimate from a state-policy table — verify with the county assessor before closing.
Climate risk First Street
- Flood 1/10 Low FEMA zone X (unshaded) · 0% chance over 30 yrs
- Wildfire 3/10 Moderate
- Heat 6/10 Major 7 d/yr ≥104°F today · 18 d/yr by 30 yrs out
- Wind 4/10 Moderate 19% chance of damaging wind over 30 yrs
- Air quality 3/10 Moderate 3 unhealthy d/yr today · 3 by 30 yrs out
Nearby sold comps map
Loading sold comps map…
Walkable amenities ~0.75 mi
Loading nearby amenities…
Taxation est. · year 1
- Rental income
- $20,870
- − Mortgage interest
- −$6,666
- − Property taxes
- −$918
- − Insurance
- −$595
- − Repairs & maintenance
- −$1,670
- − Management
- −$1,670
- − Depreciation
- −$3,462
- Taxable income
- $5,889
- Est. tax owed @ 24.0%
- −$1,413
- After-tax cash flow
- $6,072/yr
For passive investors: Depreciation is non-cash, so a rental often shows a tax loss while cash-flowing — sheltering income. Rental losses are passive: they offset passive income freely, and up to $25,000/yr can offset ordinary (W-2) income if you actively participate and your MAGI is under $100k (phasing out to $0 by $150k); unused losses carry forward. On sale, claimed depreciation is recaptured at up to 25%, and gains may owe capital-gains tax (a 1031 exchange can defer both). Figures are a year-1 estimate at your 24.0% rate — not tax advice; consult a CPA.
Schools (NCES district)
- District
- Gaston County Schools
- NCES district ID
- 3701620
- Math proficiency
- 44% ▲ 4.00%
- Reading proficiency
- 42% ▲ 1.00%
- Median HH income
- $43,644
- Composite
- 36.39/100
- National rank
- #4680
- State rank
- #93 of 178 in NC
Livability — Dallas
- Score
- 65/100
- State rank
- #299
- US rank
- #12509
Category grades
Schools grade is shown separately in the Schools card above.
Census & demographics
- Census place
- Dallas, NC
- County
- Gaston County · 201,497 people
- City population
- 18,979
- Metro
- Charlotte-Concord-Gastonia, NC-SC
- Population (ZIP)
- 18,979
- Household income
- $62,083
- Rent vs Own
- Severe rent burden
- 383.0
Population outlook (Gaston County) Hauer SSP2
- Today (2025)
- 230,027 people
- By 2030
- 237,300 · +3.2%
- By 2040
- 249,659 · +8.5%
- By 2050
- 257,806 · +12.1%
- By 2075
- 272,163 · +18.3%
- By 2100
- 268,652 · +16.8%
Race, ethnicity, and origin ACS 2023
- Neighborhood character
- Predominantly White (69%)
- Race & ethnicity
- White 69% Black 16% Hispanic / Latino 9% Two or more races 6% Native American 1%
- Hispanic origin (detail)
- Mexican 2%
- Common ancestry
- Slovak 2% Serbian 2% Italian 1%
- Foreign-born
- 6% · Canada, Jamaica
- Languages at home
- 94% English-only · Spanish 5%
Political lean MEDSL · Gaston
- 2024 margin
- Strong R (+25.0) · D 37.0% · R 62.1%
- 2008→2024 swing
- 0.0pp no change · 2008: -25.0pp · 2024: -25.0pp
- All cycles
- 2024: R+25.0 2020: R+27.8 2016: R+32.1 2012: R+25.6 2008: R+25.0
Not yet ingested
- Civics
- —
Market trends
- HPI YoY
- ▼ -78.58%
- Current HPI
- 241.4021
- Rent YoY
- ▼ -5.47%
- Metro
- Charlotte-Concord-Gastonia, NC-SC
- State GDP YoY
- ▲ 3.28%
- F500 in state
- 26
Industry mix (Fortune 500 HQ in NC)
| Industry | F500 HQs | Revenue |
|---|---|---|
| Financial Services | 2 | $213B |
|
||
| Retail | 2 | $95B |
|
||
| Industrial Conglomerate | 1 | $38B |
|
||
| Metals / Steel | 1 | $35B |
|
||
| Utilities | 1 | $30B |
|
||
| Industrial Machinery | 1 | $19B |
|
||
Price history
+0.0% since first listed4 events — show timeline
- 2026-02-21 Pending — CANOPYMLS as Distributed by MLS Grid
- 2026-01-16 Listed $119,000 CANOPYMLS as Distributed by MLS Grid
- 2025-10-13 Pending — CANOPYMLS as Distributed by MLS Grid
- 2025-05-15 Listed $119,000 CANOPYMLS as Distributed by MLS Grid
Property tax history
+0.0%/yrLatest (2025): $918 · +34.1% YoY. Source: county tax records.
Cash-flow waterfall
monthlySold comps — $/sqft
last 12 mo · ≤1 miLoading sold comps…