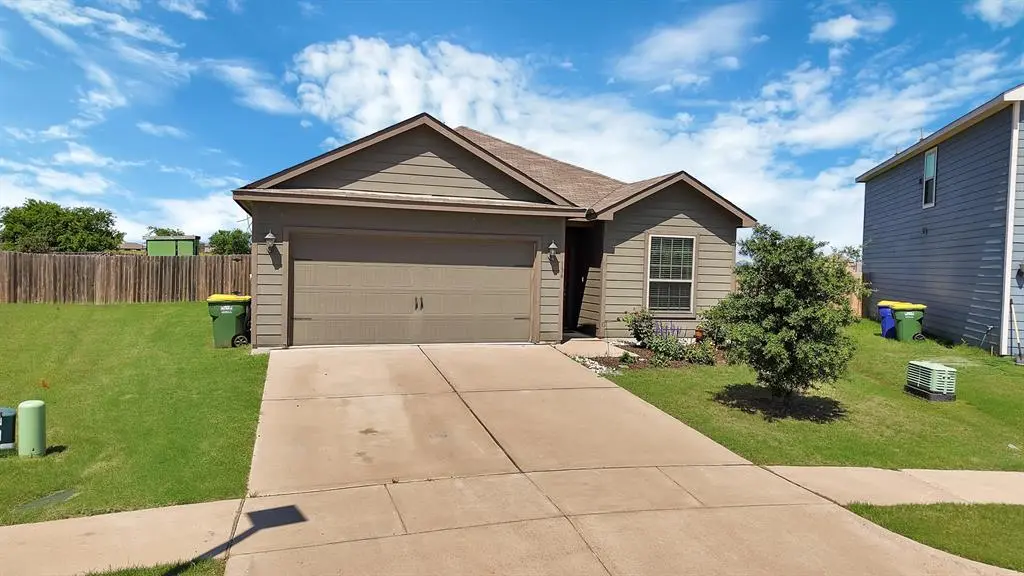
134 Yorktown Ct · Venus, TX
Flood risk 1/10 · Minimal
- FEMA flood zone
- X (unshaded)
- Chance of flooding over 30 yrs
- 0.0%
- Est. flood insurance / yr
- $507 – $1,088
Fire risk 4/10 · Minor
- Est. fire insurance / yr
- $1,222 – $2,270
Heat risk 7/10 · Major
- Hot days now (above 110°F)
- 7 days/yr
- Hot days in 30 yrs
- 25 days/yr
Wind risk 6/10 · Moderate
- Chance of severe wind over 30 yrs
- 27.0%
Air-quality risk 2/10 · Minimal
- Unhealthy air days now
- 2 days/yr
- Unhealthy air days in 30 yrs
- 2 days/yr
Risk factors via First Street. Map © Google.
Why this score? — see what drove the D grade
The composite is a weighted blend of 9 inputs, each scored 0–100. Each bar is that input's sub-score; the figure is the points it added to the 100-point composite (weight × sub-score).
- ARV discount +9.9/15.0
- Appreciation +8.7/10.0
- Cash flow +7.1/30.0
- Condition / age +4.0/5.0
- Livability +3.5/5.0
- 1% rule +3.1/10.0
- Rent growth +3.1/5.0
- Schools +2.5/10.0
- DSCR +1.3/10.0
$275,000
🖨 Deal sheet (PDF) 📄 Offer letter ✓ Due diligence
Listing remarks
Welcome to 134 Yorktown Ct in the heart of Venus, a beautifully maintained 3-bedroom, 2-bath home offering 1,605 sqft of thoughtfully designed living space. Step inside to an inviting open-concept layout featuring updated flooring that adds a modern touch throughout the home. The spacious living area flows seamlessly into the kitchen and dining space, making it perfect for both everyday living and entertaining. This home also features a functional mud room, ideal for keeping things organized and adding convenience to your daily routine. Each bedroom offers comfort and character, highlighted by unique, custom accent wall finishes that give the home a personal and stylish feel. The primary su
Key facts
- 6,970 sq ft lot
- 2 garage spots
- Built 2020
Property features AI
Finance
- Other: Listing exclusions: refrigerator and TVs; Property located in Patriot Estates Phase 7A subdivision
- Financial info: Accepts Cash, Conventional, FHA, and VA financing; No second mortgage
- HOA & community: No association; Community features include park, playground, and sidewalks
Exterior
- Parking: Attached 2-car garage; Driveway; Garage faces front; Garage door opener
- Security: Smoke detector(s); Carbon monoxide detector(s)
- Utilities: City water; Cable available; Curbs and sidewalks; Concrete streets; Electric and utilities easements
- Home design: Single family residence; One story; Built in 2020; Residential property
- Construction: Shingle roof; Slab foundation
- Exterior features: Covered porch(es); Covered patio/porch; Private yard; Storage shed(s); Grassed vegetation; Landscaped; Cul-de-sac lot; Back yard and front yard fencing (wood)
Interior
- Kitchen: Electric cooktop; Microwave; Disposal; Granite counters; Pantry
- Bedrooms: Primary bedroom on level 1 with ensuite bath and walk-in closet; Two additional bedrooms on level 1
- Flooring: Carpet; Vinyl
- Bathrooms: 2 full bathrooms
- Heating & cooling: Central air (electric); Electric heating
- Interior features: Open floorplan; Eat-in kitchen; Granite counters; Pantry; Walk-in closet(s); One living area; One dining area; Room count: 4; No fireplaces
- Laundry & utility: Full-size washer/dryer area; Washer hookup; Electric dryer hookup; Utility room; Electric water heater
Neighborhood map
What this means for you Summary
Snapshot
- This is a 3-bed/2.0-bath single-family listed at $275k. Condition is rated good.
Deal economics
- At list price, monthly cash flow is $-394 ($-5k/yr) — negative.
- To cash-flow at today's rent, offer at most $205k (25.3% below list).
- To meet the 1% rule (rent ≥ 1% of price), the offer needs to be $222k (19.3% below list).
- Recommended offer: $205k (25.3% below list) — sets the bar for cash-flow.
- Cap rate 4.6% vs local median 3.0% in Venus — top-decile yield for the area; either an underpriced asset or a hidden risk that comps aren't pricing in. Stress-test before assuming the spread holds.
Location & tenants
- Location reads 70/100 on livability (#356 in TX) — a middle-class / working-renter tenant base. Strengths: crime A+, employment A+, cost of living A+; Watch: amenities F, commute F, health & safety F.
- Venus ISD (town): math 25% / reading 32% proficiency, ranked #646 of 826 in TX (top 78%) — low school quality limits family demand, transient renter base, plan for 1-2y turnover; 60% free/reduced lunch — lower-income household profile, screen leases tightly.
- Zoned schools: Venus El (math 27% / reading 30%, grade F, #2,706 of 4,322 statewide, top 63%, 658 students, 82% FRL); Venus Middle (math 20% / reading 32%, grade F, #1,222 of 1,662 statewide, top 74%, 491 students, 80% FRL); Venus H S (math 32% / reading 35%, grade F, #1,011 of 1,632 statewide, top 63%, 725 students, 76% FRL) — zoned schools average 79% FRL vs 60% district-wide (19 pts higher); higher-poverty schools than district average — tighter screening recommended.
- Market conditions: Rents rising (+2.4%/yr); 427 active listings in the ZIP; 40 comparable units currently listed for rent nearby; rentals at typical pace (median 22d on market — plan ~3-4 weeks tenant-placement turnaround); solid renter incomes; 2,152 units permitted in Johnson County in 2024 (76 in 5+ unit buildings).
Forward outlook
- In year one you build about $22k of equity ($2k loan paydown + $20k appreciation (7.3% local appreciation)).
- Johnson County population projected at +24% by 2050 — long-run rental-demand tailwind backs the buy-and-hold thesis.
- By year 2, paydown + projected appreciation supports a ~$35k cash-out refi (75% LTV) — recoverable capital for the next deal without selling this one.
Negotiation context
- It's been on market 22 days — a 2% lower offer ($271k) is reasonable based on typical stale-listing flexibility.
Risks & watch-outs
- Watch-outs: property tax is 2.6% of price.
- Climate carrying-cost: major wind risk, 27% chance of damaging wind over 30y; extreme-heat days projected 7→25/yr by 2055 (HVAC capex compounding) — expect insurance premiums to compound above CPI over the hold.
Questions for the listing agent
- What do current leases actually rent for vs. the listed asking? Can we see a recent rent roll and the last 12 months of T-12 income?
- Property tax is high relative to price — has the assessment been appealed recently, and will the sale trigger a re-assessment?
- Is there a deadline driving the sale (1031 exchange, divorce, estate, relocation)? That informs how much negotiation room exists.
- Schools are D-rated, which usually means shorter tenancies and higher turnover. Who's the typical renter profile here, and what's been the actual vacancy rate?
- The area grade is low — what's the realistic commute time and amenity access for the typical tenant pool here? Any planned neighborhood developments (good or bad) we should know about?
- What's the average days-on-market for RENTAL listings here right now (not sales)? A rising rental-DOM trend means longer vacancies and softer asking-rent achievability than the comps imply.
- What's the recent tenant-quality profile in this submarket — average credit score on applications, eviction rate, late-payment / NSF rate, and stable-employment percentage? A property-management company in the area should have these aggregated.
- How much new for-sale + rental construction is in the pipeline within 1–3 miles? Heavy new supply typically softens prices + rents 12–24 months out; constrained supply supports both.
Investment metrics
- 1% rule
- 0.81% ✗
- Cap rate
- 4.57%
- Cash-on-cash
- -6.14%
- DSCR
- 0.73
- GRM
- 10.3
CMA / ARV
- ARV (median comp)
- $290,757
- List price
- $275,000
- Delta
- -5.42%
- Verdict
- FAIR
- Comps
- 20 within 1.0 mi
Show comp detail 12 sales within ~0.75 mi
| Address | Dist | Beds/Ba | Sqft | Sold | Price | $/sf | Match |
|---|---|---|---|---|---|---|---|
| 134 Yorktown Ct | 0.00mi | 3/2.0 | 1,605 (0%) | 1mo | $275,000 | $171 | 100 |
| 126 Patrick Henry Dr | 0.27mi | 3/2.0 | 1,606 (+0%) | 2mo | $324,890 | $202 | 86 |
| 136 Kennedy Dr | 0.30mi | 3/2.0 | 1,597 (-0%) | 1mo | $270,000 | $169 | 84 |
| 319 Julian Davis Dr | 0.27mi | 3/2.0 | 1,658 (+3%) | 2mo | $320,900 | $194 | 80 |
| 128 Patrick Henry Dr | 0.26mi | 4/2.0 (+1) | 1,553 (-3%) | 0mo | $314,890 | $203 | 77 |
| 223 Patton Ln | 0.47mi | 3/2.0 | 1,658 (+3%) | 1mo | $325,900 | $197 | 72 |
| 523 Bennie Leonard St | 0.29mi | 4/2.0 (+1) | 1,690 (+5%) | 2mo | $279,000 | $165 | 71 |
| 311 Patton Ln | 0.50mi | 3/2.0 | 1,658 (+3%) | 1mo | $325,900 | $197 | 70 |
| 210 Julian Davis Dr | 0.16mi | 3/2.0 | 1,379 (-14%) | 1mo | $307,900 | $223 | 68 |
| 317 Julian Davis Dr | 0.27mi | 3/2.0 | 1,379 (-14%) | 2mo | $307,900 | $223 | 63 |
| 502 Monroe Jackson St | 0.31mi | 4/2.0 (+1) | 1,791 (+12%) | 2mo | $274,000 | $153 | 60 |
| 303 Patton Ln | 0.49mi | 4/2.0 (+1) | 1,784 (+11%) | 1mo | $329,900 | $185 | 53 |
Match score weights: distance 35% · size 25% · config 20% · recency 20%. Top-matched comps best support the ARV.
Projected returns pro-forma
7.32% appreciation · 2.39% rent growth · sell at horizon
- IRR
- 13.5%
- Equity multiple
- 1.98×
- Total profit
- $75,210
- Equity at exit
- $196,355
- IRR
- 13.6%
- Equity multiple
- 4.05×
- Total profit
- $234,586
- Equity at exit
- $378,350
Cash invested: $77,000 (down + closing). Projections, not guarantees.
Landlord ↔ Tenant lean methodology
- Overall (STATE)
- 87 Strongly Landlord-Friendly
- State Texas
- 87 Strongly Landlord-Friendly · R+5
- County
- — inherits STATE
- City
- — inherits STATE
ZIP-level market 76084
- Home prices YoY
- 2.1%
- Rents YoY
- 2.4%
- Active inventory
- 427
- Price-to-rent
- 10.3×
Monthly cashflow live
- Estimated rent
- $2,219 high interval (Pro) →
- Mortgage (P&I)
- −$1,442
- Tax from tax record
- −$590 /mo · $7,085/yr
- Insurance
- −$115
- HOA
- −$0
- Vacancy / Maint / Mgmt
- −$466
- Net cashflow
- $-394
Break-even live
Sensitivity live
| Price | -10% $-238 | -5% $-316 | +0% $-394 | +5% $-472 | +10% $-550 |
|---|---|---|---|---|---|
| Rent | -10% $-569 | -5% $-482 | +0% $-394 | +5% $-306 | +10% $-219 |
| Rate | -1.0pp $-255 | -0.5pp $-324 | base $-394 | +0.5pp $-465 | +1.0pp $-538 |
UW: 25.0% down · 7.5% · 30yr · 1.5% tax · 5.0% vac · 8.0% maint · 8.0% mgmt
Financing live
Cash to close
- Down payment
- $68,750
- Closing costs
- $8,250
- Reserves months
- —
- Total cash needed
- —
Loan-product check · same deal, 3 products live
Conventional
25% down · 7.5% · 30yr
- Down + closing
- —
- Monthly P&I
- —
- Monthly cashflow
- —
- DSCR
- —
- Eligible?
- —
Personal DTI + credit; lowest rate.
DSCR
20% down · 8.5% · 30yr
- Down + closing
- —
- Monthly P&I
- —
- Monthly cashflow
- —
- DSCR
- —
- Eligible?
- —
No personal income docs; deal must DSCR.
Hard money
10% down · 12.0% · 12mo
- Down + closing
- —
- Monthly P&I
- —
- Monthly cashflow
- —
- DSCR
- —
- Eligible?
- —
Short-term bridge; refi at stabilization.
Rent comps 40 comps
| Address | Beds | Baths | Sqft | Rent | $/sqft | DOM | Units | Dist |
|---|---|---|---|---|---|---|---|---|
| 201 Julian Davis Dr Venus, TX | 3.0 | 2.5 | 1626 | $2,195 | $1.35 | 21d | 1 | 0.14mi |
| 147 Sammy Fowler Ave Venus, TX | 4.0 | 2.0 | 1690 | $2,250 | $1.33 | 0d | 1 | 0.16mi |
| 208 Julian Davis Dr Venus, TX | 4.0 | 2.0 | 1784 | $2,330 | $1.31 | 13d | 1 | 0.16mi |
| 214 Julian Davis Dr Venus, TX | 4.0 | 2.0 | 1784 | $2,355 | $1.32 | 45d | 1 | 0.19mi |
| 512 Albert Anthony St Venus, TX | 3.0 | 2.0 | 1658 | $1,990 | $1.20 | 1d | 1 | 0.21mi |
| 512 Albert Anthony St Venus, TX | 3.0 | 2.0 | 1658 | $1,990 | $1.20 | 24d | 1 | 0.21mi |
| 201 John Laurens Dr Venus, TX | 3.0–5.0 | 2.0–2.5 | 1975 | $2,250 | $1.14 | 0d | 1 | 0.21mi |
| 325 Condie Russell Ave Venus, TX | 4.0 | 2.5 | 2189 | $2,325 | $1.06 | 14d | 1 | 0.22mi |
| 418 Watson Ct Venus, TX | 3.0 | 2.0 | 1379 | $2,210 | $1.60 | 45d | 1 | 0.23mi |
| 523 Bennie Leonard St Venus, TX | 4.0 | 2.0 | 1690 | $2,350 | $1.39 | 0d | 1 | 0.26mi |
| 315 Julian Davis Dr Venus, TX | 4.0 | 2.0 | 1784 | $2,355 | $1.32 | 0d | 1 | 0.27mi |
| 358 Condie Russell Ave Venus, TX | 3.0 | 2.0 | 1658 | $1,995 | $1.20 | 4d | 1 | 0.29mi |
| 430 Gib Woodall Dr Venus, TX | 3.0 | 2.0 | 1379 | $2,000 | $1.45 | 5d | 1 | 0.30mi |
| 501 Gib Woodall Dr Venus, TX | 3.0 | 2.0 | 1218 | $1,945 | $1.60 | 45d | 1 | 0.34mi |
| 427 Condie Russell Ave Venus, TX | 3.0 | 2.0 | 1218 | $1,965 | $1.61 | 45d | 1 | 0.35mi |
| 170 Kennedy Dr Venus, TX | 4.0 | 2.0 | 1661 | $2,300 | $1.38 | 0d | 1 | 0.37mi |
| 428 Condie Russell Ave Venus, TX | 4.0 | 2.0 | 1784 | $2,150 | $1.21 | 26d | 1 | 0.37mi |
| 131 Mt Vernon Ln Venus, TX | 3.0 | 2.0 | 1652 | $2,169 | $1.31 | 24d | 1 | 0.48mi |
| 108 Rushmore Ln Venus, TX | 4.0 | 2.0 | 1658 | $1,969 | $1.19 | 26d | 1 | 0.48mi |
| 313 Patton Ln Venus, TX | 4.0 | 2.0 | 1784 | $2,355 | $1.32 | 9d | 1 | 0.48mi |
| 120 Mt Vernon Ln Venus, TX | 3.0 | 2.0 | 1661 | $2,149 | $1.29 | 45d | 1 | 0.49mi |
| 315 Patton Ln Venus, TX | 4.0 | 2.5 | 2173 | $2,515 | $1.16 | 5d | 1 | 0.49mi |
| 628 Blackland Dr Venus, TX | 4.0 | 2.5 | 1483 | $2,200 | $1.48 | 0d | 1 | 0.56mi |
| 645 Blackland Dr Venus, TX | 3.0 | 2.0 | 1361 | $1,950 | $1.43 | 45d | 1 | 0.56mi |
| 101 Hancock St Venus, TX | 3.0 | 2.5 | 1773 | $1,929 | $1.09 | 3d | 1 | 0.59mi |
| 640-644 Wheatfield DR Venus, TX | 4.0 | 2.0 | 1926 | $2,100 | $1.09 | 0d | 1 | 0.59mi |
| 656-660 Wheatfield DR Venus, TX | 3.0 | 2.0 | 1301 | $1,950 | $1.50 | 0d | 1 | 0.61mi |
| 663 Wheatfield Dr Venus, TX | 2.0 | 2.0 | 1274 | $1,695 | $1.33 | 0d | 1 | 0.61mi |
| 112 Liberty Ln Venus, TX | 4.0 | 2.0 | 1658 | $2,309 | $1.39 | 45d | 1 | 0.62mi |
| 135 Houston Pl Venus, TX | 3.0 | 2.0 | 1590 | $2,029 | $1.28 | 0d | 1 | 0.63mi |
| 705 Wheatfield Dr Venus, TX | 2.0 | 1.5 | 1134 | $1,500 | $1.32 | 26d | 1 | 0.63mi |
| 720 Blackland Dr Venus, TX | 4.0 | 2.5 | 1926 | $2,200 | $1.14 | 9d | 1 | 0.63mi |
| 645 Fallow Dr Venus, TX | 3.0 | 2.0 | 1301 | $1,950 | $1.50 | 9d | 1 | 0.64mi |
| 723 Wheatfield Dr Venus, TX | 2.0 | 2.0 | 1274 | $1,695 | $1.33 | 45d | 1 | 0.64mi |
| 601 Harvest Moon Dr Venus, TX | 3.0 | 2.0 | 1347 | $1,795 | $1.33 | 45d | 1 | 0.66mi |
| 733 Wheatfield Dr Venus, TX | 3.0 | 2.0 | 1347 | $1,795 | $1.33 | 26d | 1 | 0.66mi |
| 737 Wheatfield Dr Venus, TX | 2.0 | 1.5 | 1134 | $1,595 | $1.41 | 26d | 1 | 0.67mi |
| 729 Fallow Dr Venus, TX | 3.0 | 2.0 | 1301 | $1,995 | $1.53 | 45d | 1 | 0.69mi |
| 748 Wheatfield Dr Venus, TX | 3.0 | 2.0 | 1361 | $1,950 | $1.43 | 45d | 1 | 0.69mi |
| 620-616 Harvest Moon Dr Venus, TX | 3.0 | 2.0 | 1307 | $1,950 | $1.49 | 45d | 1 | 0.69mi |
Listing history 2 events
-
2026-05-13historical Active Option Contract 1170-char remark
-
2026-05-05$275,000 Active 1170-char remark
ⓘ Source: listings_history table (triggers on properties + properties_extension) + one-shot
backfill from property_details.listing_events for pre-trigger history.
Tax reassessment forecast TX · Resets to sale price
- Current annual tax
- $7,085 · $590/mo
- Projected year-2 tax
- $7,085 · $590/mo
- Expected delta
- $0/yr ($0/mo · 0.0%)
ⓘ Screening estimate from a state-policy table — verify with the county assessor before closing.
Climate risk First Street
- Flood 1/10 Low FEMA zone X (unshaded) · 0% chance over 30 yrs
- Wildfire 4/10 Moderate
- Heat 7/10 Severe 7 d/yr ≥110°F today · 25 d/yr by 30 yrs out
- Wind 6/10 Major 27% chance of damaging wind over 30 yrs
- Air quality 2/10 Low 2 unhealthy d/yr today · 2 by 30 yrs out
Nearby sold comps map
Loading sold comps map…
Walkable amenities ~0.75 mi
Loading nearby amenities…
Taxation est. · year 1
- Rental income
- $26,630
- − Mortgage interest
- −$15,404
- − Property taxes
- −$7,085
- − Insurance
- −$1,375
- − Repairs & maintenance
- −$2,130
- − Management
- −$2,130
- − Depreciation
- −$8,000
- Taxable loss
- −$9,494
- Est. tax savings @ 24.0%
- +$2,279
- After-tax cash flow
- $-2,449/yr
For passive investors: Depreciation is non-cash, so a rental often shows a tax loss while cash-flowing — sheltering income. Rental losses are passive: they offset passive income freely, and up to $25,000/yr can offset ordinary (W-2) income if you actively participate and your MAGI is under $100k (phasing out to $0 by $150k); unused losses carry forward. On sale, claimed depreciation is recaptured at up to 25%, and gains may owe capital-gains tax (a 1031 exchange can defer both). Figures are a year-1 estimate at your 24.0% rate — not tax advice; consult a CPA.
Condition & rehab AI · 12 photos
This well-maintained single-family home in Venus offers a good condition with updated features and a good curb appeal. Minor updates to the exterior and bathroom could further enhance its value.
Value-add opportunities
- Both Paint the exterior siding — Enhances curb appeal and value
- Resale Replace the shower curtain with a more neutral design — Improves the bathroom's aesthetic and resale value
- Both Add a smart thermostat — Improves energy efficiency and adds a modern touch
Renovation cost estimate screening
Value-add ROI direction
- Both Paint the exterior siding — Enhances curb appeal and value ↑
- Resale Replace the shower curtain with a more neutral design — Improves the bathroom's aesthetic and resale value ↑
- Both Add a smart thermostat — Improves energy efficiency and adds a modern touch ↑
ⓘ Cost ranges are severity-bucket heuristics (US national rule-of-thumb). Get contractor quotes + a written scope before underwriting a rehab budget.
Schools (NCES district)
- District
- Venus ISD
- NCES district ID
- 4844010
- Math proficiency
- 25% ▼ -15.00%
- Reading proficiency
- 32% ▼ -2.00%
- Median HH income
- $50,394
- Composite
- 24.97/100
- National rank
- #7563
- State rank
- #646 of 826 in TX
Livability — Venus
- Score
- 70/100
- State rank
- #356
- US rank
- #7724
Category grades
Schools grade is shown separately in the Schools card above.
Census & demographics
- Census place
- Venus, TX
- County
- Johnson County · 147,987 people
- Metro
- Dallas-Fort Worth-Arlington, TX
- Population (ZIP)
- 14,097
- Household income
- $102,115
- Rent vs Own
- Severe rent burden
- 70.0
Population outlook (Johnson County) Hauer SSP2
- Today (2025)
- 179,678 people
- By 2030
- 189,208 · +5.3%
- By 2040
- 207,261 · +15.4%
- By 2050
- 223,064 · +24.1%
- By 2075
- 259,979 · +44.7%
- By 2100
- 275,395 · +53.3%
Race, ethnicity, and origin ACS 2023
- Neighborhood character
- Diverse neighborhood (Simpson 0.63)
- Race & ethnicity
- White 52% Hispanic / Latino 30% Two or more races 24% Black 11% Asian 1%
- Hispanic origin (detail)
- Mexican 25% Puerto Rican 1%
- Common ancestry
- Romanian 2% Lithuanian 1% Slovak 1%
- Foreign-born
- 8% · Canada
- Languages at home
- 78% English-only · Spanish 18% Arabic 1% French/Haitian/Cajun 1%
Political lean MEDSL · Johnson
- 2024 margin
- Solid R (+51.4) · D 23.9% · R 75.3%
- 2008→2024 swing
- -3.9pp toward R · 2008: -47.5pp · 2024: -51.4pp
- All cycles
- 2024: R+51.4 2020: R+53.0 2016: R+58.3 2012: R+55.6 2008: R+47.5
Not yet ingested
- Civics
- —
Market trends
- HPI YoY
- ▲ 7.32%
- Current HPI
- 355.74
- Rent YoY
- ▲ 2.39%
- Metro
- Dallas-Fort Worth-Arlington, TX
- State GDP YoY
- ▲ 3.95%
- F500 in state
- 110
Industry mix (Fortune 500 HQ in TX)
| Industry | F500 HQs | Revenue |
|---|---|---|
| Energy | 16 | $1,198B |
|
||
| Technology | 5 | $198B |
|
||
| Engineering / Construction | 4 | $72B |
|
||
| Energy Services | 3 | $60B |
|
||
| Utilities | 3 | $41B |
|
||
| Healthcare | 2 | $330B |
|
||
Price history
5 events — show timeline
- 2026-06-04 Sold (Public Records) — Public Records
- 2026-06-03 Sold (MLS) — NTREIS
- 2026-05-27 Pending — NTREIS
- 2026-05-13 Contingent — NTREIS
- 2026-05-05 Listed $275,000 NTREIS
Property tax history
+84.1%/yrLatest (2025): $7,085 · +6.6% YoY. Source: county tax records.
Cash-flow waterfall
monthlySold comps — $/sqft
last 12 mo · ≤1 miLoading sold comps…