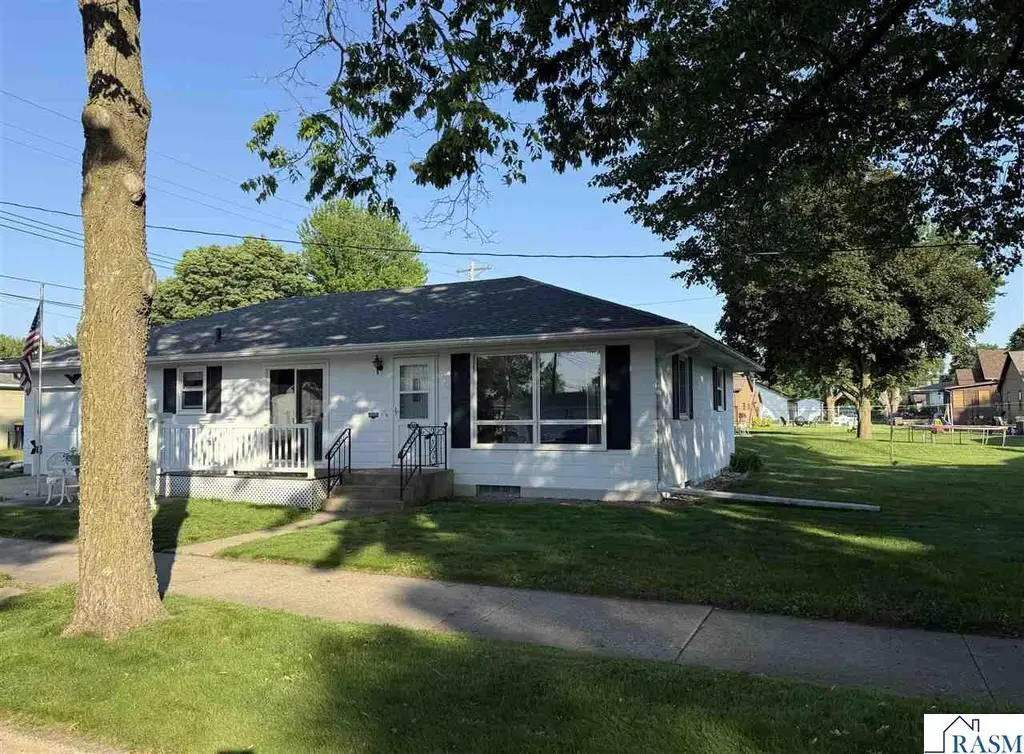
619 N 11th St · New Ulm, MN
Flood risk 1/10 · Minimal
- FEMA flood zone
- X (unshaded)
- Chance of flooding over 30 yrs
- 0.0%
- Est. flood insurance / yr
- $473 – $860
Fire risk 5/10 · Moderate
- Est. fire insurance / yr
- $888 – $1,650
Heat risk 2/10 · Minimal
- Hot days now (above 100°F)
- 7 days/yr
- Hot days in 30 yrs
- 15 days/yr
Wind risk 2/10 · Minimal
- Chance of severe wind over 30 yrs
- —
Air-quality risk 1/10 · Minimal
- Unhealthy air days now
- 0 days/yr
- Unhealthy air days in 30 yrs
- 0 days/yr
Risk factors via First Street. Map © Google.
Why this score? — see what drove the F grade
The composite is a weighted blend of 9 inputs, each scored 0–100. Each bar is that input's sub-score; the figure is the points it added to the 100-point composite (weight × sub-score).
- Cash flow +7.7/30.0
- Schools +4.4/10.0
- Livability +4.1/5.0
- Rent growth +2.5/5.0
- Condition / age +2.5/5.0
- 1% rule +1.8/10.0
- DSCR +1.8/10.0
- ARV discount +1.8/15.0
- Appreciation +0.0/10.0
$179,900
🖨 Deal sheet 📄 Offer letter ✓ Due diligence
Listing remarks MLS
2 bedroom 2 bath rambler with single attached garage.
Key facts
- Utility room
- Rec room
- 3,485 sq ft lot
Tags
Property features AI
Exterior
- Parking: Attached garage with garage door opener (1 car); Concrete driveway
- Utilities: Public water; Public sewer
- Home design: Single family residence; Residential property
- Construction: Asphalt roof
- Exterior features: Deck; Patio; Public maintained road
Interior
- Kitchen: Cooktop; Range; Microwave; Refrigerator
- Bathrooms: One full bathroom; One three-quarter bathroom
- Heating & cooling: Natural gas forced air heating; Central air; Ceiling fans
- Interior features: Kitchen island; Partially finished full basement
- Laundry & utility: Washer; Dryer; Gas water heater; Water softener
Neighborhood map
What this means for you Summary
Snapshot
- This is a 2-bed/1.0-bath single-family listed at $180k.
Deal economics
- At list price, monthly cash flow is $-207 ($-2k/yr) — negative.
- To cash-flow at today's rent, offer at most $143k (20.3% below list).
- To meet the 1% rule (rent ≥ 1% of price), the offer needs to be $123k (31.7% below list).
- Recommended offer: $123k (31.7% below list) — sets the bar for 1% rule.
Location & tenants
- Location reads 82/100 on livability (#39 in MN, #1,102 nationally) — a professional / high-income tenant draw. Strengths: crime A+, cost of living A+, housing A+; Watch: commute F.
- New Ulm Public School District (town): math 51% / reading 51% proficiency, ranked #104 of 301 in MN (top 35%) — acceptable for families but not a draw, mixed tenant base, ~2y average lease.
- Market conditions: 85 active listings in the ZIP; 1 comparable units currently listed for rent nearby; 41 units permitted in Brown County in 2024 (18 in 5+ unit buildings).
Forward outlook
- Local home prices are declining (-3.0%/yr); year-one equity from $1k of loan paydown is wiped out by about $5k of value loss. Plan a longer hold.
- Brown County population projected at -14% by 2050 — secular population decline; favor cash flow + early exit over multi-decade hold.
Negotiation context
- Only 3 days on market — expect competitive offers; lowballing is unlikely to land.
- 3 sale attempts since 14y ago with the ask held roughly flat each time — persistent listings suggest the price (not the market) is what's stuck; bring a comps-based counter.
- Current owner paid $109k; list at $180k implies a 65% gain — meaningful room to come down on a strong offer.
Risks & watch-outs
- Climate carrying-cost: moderate wildfire risk — expect insurance premiums to compound above CPI over the hold.
Questions for the listing agent
- What do current leases actually rent for vs. the listed asking? Can we see a recent rent roll and the last 12 months of T-12 income?
- Built in 1967 — when were the roof, HVAC, electrical panel, plumbing, and water heater last replaced?
- Is there a deadline driving the sale (1031 exchange, divorce, estate, relocation)? That informs how much negotiation room exists.
- Schools are B-rated — typically a magnet for longer-tenancy family renters. What's the average tenant stay here, and is there a school-zone premium baked into asking?
- The area grade is low — what's the realistic commute time and amenity access for the typical tenant pool here? Any planned neighborhood developments (good or bad) we should know about?
- What's the average days-on-market for RENTAL listings here right now (not sales)? A rising rental-DOM trend means longer vacancies and softer asking-rent achievability than the comps imply.
- What's the recent tenant-quality profile in this submarket — average credit score on applications, eviction rate, late-payment / NSF rate, and stable-employment percentage? A property-management company in the area should have these aggregated.
- How much new for-sale + rental construction is in the pipeline within 1–3 miles? Heavy new supply typically softens prices + rents 12–24 months out; constrained supply supports both.
Investment metrics
- 1% rule
- 0.68% ✗
- Cap rate
- 4.91%
- Cash-on-cash
- -4.92%
- DSCR
- 0.78
- GRM
- 12.2
CMA / ARV
- ARV (on-the-fly)
- $159,600
- Comps found
- 12
Show comp detail 12 sales within ~0.75 mi
| Address | Dist | Beds/Ba | Sqft | Sold | Price | $/sf | Match |
|---|---|---|---|---|---|---|---|
| 812 Broadway St North St | 0.20mi | 2/1.0 | 1,136 (+7%) | 2mo | $150,000 | $132 | 77 |
| 806 N Jefferson St | 0.34mi | 2/1.0 | 1,056 (-1%) | 8mo | $190,000 | $180 | 76 |
| 1326 Jefferson St North St | 0.36mi | 2/— | 1,123 (+6%) | 13mo | $200,000 | $178 | 64 |
| 519 N German St | 0.48mi | 3/1.0 (+1) | 1,099 (+3%) | 10mo | $165,000 | $150 | 59 |
| 905 N Washington St | 0.19mi | 2/1.0 | 968 (-9%) | 22mo | $179,900 | $186 | 58 |
| 818 Washington St St N | 0.21mi | 2/1.5 | 1,174 (+10%) | 18mo | $142,500 | $121 | 56 |
| 601 N Jefferson St | 0.48mi | 2/2.0 | 1,008 (-5%) | 13mo | $210,850 | $209 | 54 |
| 617 N Jefferson St | 0.46mi | 3/2.0 (+1) | 1,170 (+10%) | 1mo | $229,900 | $196 | 52 |
| 614 N Minnesota St | 0.38mi | 3/1.5 (+1) | 1,194 (+12%) | 19mo | $157,500 | $132 | 39 |
| 522 N Franklin St | 0.46mi | 3/2.0 (+1) | 1,202 (+13%) | 14mo | $119,773 | $100 | 36 |
| 1827 N Minnesota St | 0.65mi | 3/2.0 (+1) | 1,195 (+12%) | 8mo | $135,000 | $113 | 33 |
| 414 N Front St | 0.71mi | 2/1.0 | 1,174 (+10%) | 21mo | $90,000 | $77 | 32 |
Match score weights: distance 35% · size 25% · config 20% · recency 20%. Top-matched comps best support the ARV.
Projected returns pro-forma
-3.0% appreciation · 3.0% rent growth · sell at horizon
- IRR
- -24.7%
- Equity multiple
- 0.16×
- Total profit
- $-42,334
- Equity at exit
- $26,824
- IRR
- -20.4%
- Equity multiple
- -0.07×
- Total profit
- $-53,898
- Equity at exit
- $15,554
Cash invested: $50,372 (down + closing). Projections, not guarantees.
Landlord ↔ Tenant lean methodology
- Overall (STATE)
- 46 Balanced
- State Minnesota
- 46 Balanced · D+2
- County
- — inherits STATE
- City
- — inherits STATE
ZIP-level market 56073
- Active inventory
- 85
- Price-to-rent
- 12.2×
Monthly cashflow live
- Estimated rent
- $1,229 medium interval (Pro) →
- Mortgage (P&I)
- −$943
- Tax from tax record
- −$159 /mo · $1,910/yr
- Insurance
- −$75
- HOA
- −$0
- Vacancy / Maint / Mgmt
- −$258
- Net cashflow
- $-207
Break-even live
UW: 25.0% down · 7.5% · 30yr · 1.5% tax · 5.0% vac · 8.0% maint · 8.0% mgmt
Financing live
Cash to close
- Down payment
- $44,975
- Closing costs
- $5,397
- Reserves months
- —
- Total cash needed
- —
Loan-product check · same deal, 3 products live
Conventional
25% down · 7.5% · 30yr
- Down + closing
- —
- Monthly P&I
- —
- Monthly cashflow
- —
- DSCR
- —
- Eligible?
- —
Personal DTI + credit; lowest rate.
DSCR
20% down · 8.5% · 30yr
- Down + closing
- —
- Monthly P&I
- —
- Monthly cashflow
- —
- DSCR
- —
- Eligible?
- —
No personal income docs; deal must DSCR.
Hard money
10% down · 12.0% · 12mo
- Down + closing
- —
- Monthly P&I
- —
- Monthly cashflow
- —
- DSCR
- —
- Eligible?
- —
Short-term bridge; refi at stabilization.
Rent comps 1 comps
| Address | Beds | Baths | Sqft | Rent | $/sqft | DOM | Units | Dist |
|---|---|---|---|---|---|---|---|---|
| 227 N Minnesota St Unit 1 New Ulm, MN | 2.0 | 1.0 | 750 | $1,229 | $1.64 | 44d | 1 | 0.66mi |
Listing history 4 events
-
2026-06-07statusdays on market $179,900 Pending 3 DOM
-
2026-06-04days on market $179,900 Active 2 DOM
-
2026-06-02remarks 492-char remark
-
2026-06-02$179,900 Active 1 DOM
ⓘ Source: listings_history table (triggers on properties + properties_extension) + one-shot
backfill from property_details.listing_events for pre-trigger history.
Tax reassessment forecast MN · Partial reset (capped growth)
- Current annual tax
- $1,910 · $159/mo
- Projected year-2 tax
- $1,962 · $164/mo
- Expected delta
- +$52/yr (+$4/mo · 2.7%)
ⓘ Screening estimate from a state-policy table — verify with the county assessor before closing.
Climate risk First Street
- Flood 1/10 Low FEMA zone X (unshaded) · 0% chance over 30 yrs
- Wildfire 5/10 Major
- Heat 2/10 Low 7 d/yr ≥100°F today · 15 d/yr by 30 yrs out
- Wind 2/10 Low
- Air quality 1/10 Low 0 unhealthy d/yr today · 0 by 30 yrs out
Nearby sold comps map
Loading sold comps map…
Walkable amenities ~0.75 mi
Loading nearby amenities…
Taxation est. · year 1
- Rental income
- $14,748
- − Mortgage interest
- −$10,077
- − Property taxes
- −$1,910
- − Insurance
- −$900
- − Repairs & maintenance
- −$1,180
- − Management
- −$1,180
- − Depreciation
- −$5,233
- Taxable loss
- −$5,732
- Est. tax savings @ 24.0%
- +$1,376
- After-tax cash flow
- $-1,104/yr
For passive investors: Depreciation is non-cash, so a rental often shows a tax loss while cash-flowing — sheltering income. Rental losses are passive: they offset passive income freely, and up to $25,000/yr can offset ordinary (W-2) income if you actively participate and your MAGI is under $100k (phasing out to $0 by $150k); unused losses carry forward. On sale, claimed depreciation is recaptured at up to 25%, and gains may owe capital-gains tax (a 1031 exchange can defer both). Figures are a year-1 estimate at your 24.0% rate — not tax advice; consult a CPA.
Schools (NCES district)
- District
- New Ulm Public School District
- NCES district ID
- 2723490
- Math proficiency
- 51% ▼ -3.00%
- Reading proficiency
- 51% ▼ -7.00%
- Median HH income
- $53,171
- Composite
- 43.93/100
- National rank
- #2906
- State rank
- #104 of 301 in MN
Livability — New Ulm
- Score
- 82/100
- State rank
- #39
- US rank
- #1102
Category grades
Schools grade is shown separately in the Schools card above.
Census & demographics
- Census place
- New Ulm, MN
- City population
- 17,325
- Population (ZIP)
- 17,325
Population outlook (Brown County) Hauer SSP2
- Today (2025)
- 24,403 people
- By 2030
- 23,790 · -2.5%
- By 2040
- 22,309 · -8.6%
- By 2050
- 20,948 · -14.2%
- By 2075
- 19,038 · -22.0%
- By 2100
- 16,658 · -31.7%
Race, ethnicity, and origin ACS 2023
- Neighborhood character
- Predominantly White (94%)
- Race & ethnicity
- White 94% Hispanic / Latino 3% Two or more races 2%
- Common ancestry
- Portuguese 9% Lithuanian 2% Romanian 2%
- Foreign-born
- 2% · Canada, Vietnam
- Languages at home
- 96% English-only · Spanish 2% German/W. Germanic 1%
Political lean MEDSL · Brown
- 2024 margin
- Solid R (+35.2) · D 31.5% · R 66.7% · Other 1.8%
- 2008→2024 swing
- -23.1pp toward R · 2008: -12.1pp · 2024: -35.2pp
- All cycles
- 2024: R+35.2 2020: R+32.8 2016: R+36.2 2012: R+16.6 2008: R+12.1
Not yet ingested
- Civics
- —
Market trends
- HPI YoY
- ▼ -166.22%
- Current HPI
- 192.7295
- Rent YoY
- —
- Metro
- —
- State GDP YoY
- ▲ 2.41%
- F500 in state
- 34
Industry mix (Fortune 500 HQ in MN)
| Industry | F500 HQs | Revenue |
|---|---|---|
| Healthcare | 2 | $407B |
|
||
| Retail | 2 | $150B |
|
||
| Consumer Goods | 2 | $32B |
|
||
| Industrial Machinery | 2 | $6B |
|
||
| Agriculture | 1 | $40B |
|
||
| Healthcare / Medical Devices | 1 | $32B |
|
||
Price history
+117.0% since first listed8 events — show timeline
- 2026-06-01 Listed $179,900 RASM
- 2013-03-04 Sold (Public Records) $109,000 Public Records
- 2013-03-04 Sold (MLS) $109,000 NORTHSTARMLS as Distributed by MLS Grid
- 2013-02-18 Listed $109,000 NORTHSTARMLS as Distributed by MLS Grid
- 2012-06-20 Sold (MLS) $104,900 NORTHSTARMLS as Distributed by MLS Grid
- 2012-06-19 Sold (Public Records) $104,900 Public Records
- 2012-05-07 Listed $104,900 NORTHSTARMLS as Distributed by MLS Grid
- 1997-08-27 Sold (Public Records) $82,900 Public Records
Property tax history
+5.0%/yrLatest (2025): $1,910 · +9.0% YoY. Source: county tax records.
Cash-flow waterfall
monthlySold comps — $/sqft
last 12 mo · ≤1 miLoading sold comps…