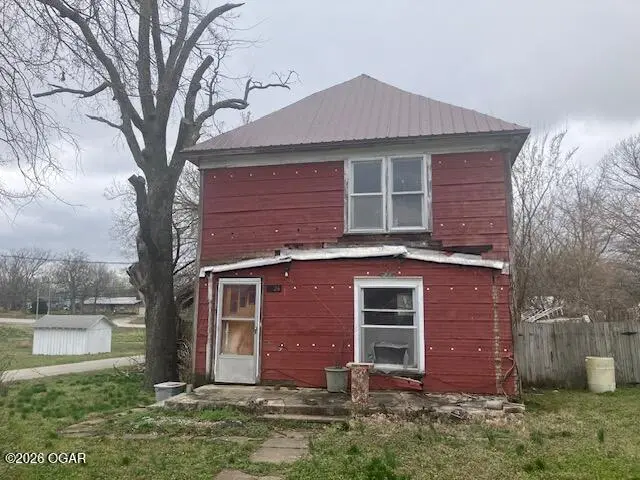
1926 Joplin St · Galena, KS
Flood risk 1/10 · Minimal
- FEMA flood zone
- X (unshaded)
- Chance of flooding over 30 yrs
- 0.0%
- Est. flood insurance / yr
- $507 – $1,088
Fire risk 5/10 · Moderate
- Est. fire insurance / yr
- $1,154 – $2,142
Heat risk 5/10 · Moderate
- Hot days now (above 107°F)
- 7 days/yr
- Hot days in 30 yrs
- 20 days/yr
Wind risk 2/10 · Minimal
- Chance of severe wind over 30 yrs
- 2.0%
Air-quality risk 2/10 · Minimal
- Unhealthy air days now
- 1 days/yr
- Unhealthy air days in 30 yrs
- 1 days/yr
Risk factors via First Street. Map © Google.
Why this score? — see what drove the D grade
The composite is a weighted blend of 9 inputs, each scored 0–100. Each bar is that input's sub-score; the figure is the points it added to the 100-point composite (weight × sub-score).
- Cash flow +15.0/30.0
- ARV discount +7.5/15.0
- 1% rule +5.0/10.0
- DSCR +5.0/10.0
- Livability +3.4/5.0
- Rent growth +2.5/5.0
- Condition / age +2.5/5.0
- Schools +2.4/10.0
- Appreciation +0.0/10.0
$20,000
🖨 Deal sheet 📄 Offer letter ✓ Due diligence
Listing remarks MLS
Looking for a challenging DIY project to test your patience? Bring your vision and give this home a new chance at life or put it out of its misery and gain a nice corner lot to build on. The choice is yours
Key facts
- Built 1910
- Listed 97 days
Neighborhood map
What this means for you Summary
Snapshot
- This is a 3-bed/2.0-bath single-family listed at $20k.
Deal economics
- At list price, monthly cash flow is $597 ($7k/yr) — positive.
- The deal already cash-flows at list — no discount required.
- Meets the 1% rule at list price ($959 rent vs $20k).
- Recommended offer: $18k (9.0% below list) — sets the bar for market timing.
Location & tenants
- Location reads 67/100 on livability (#239 in KS) — a middle-class / working-renter tenant base. Strengths: cost of living A+, health & safety A+, housing A; Watch: schools F, crime F, amenities F.
- Galena (town): math 23% / reading 35% proficiency, ranked #118 of 169 in KS (top 70%) — low school quality limits family demand, transient renter base, plan for 1-2y turnover.
- Market conditions: 55 active listings in the ZIP; 2 comparable units currently listed for rent nearby; 17 units permitted in Cherokee County in 2024 (0 in 5+ unit buildings).
Forward outlook
- Local home prices are declining (-3.0%/yr); year-one equity from $138 of loan paydown is wiped out by about $600 of value loss. Plan a longer hold.
- Cherokee County population projected at -26% by 2050 — secular population decline; favor cash flow + early exit over multi-decade hold.
- At projected returns (-3.0% appreciation + 3.0% rent growth), your $6k cash investment doubles in ~1 year — after that, you're playing with house money.
Negotiation context
- It's been on market 98 days — a 9% lower offer ($18k) is reasonable based on typical stale-listing flexibility.
- Current owner paid $15k; 33% above their basis — modest negotiation headroom, anchor on the comps not their cost.
Risks & watch-outs
- Watch-outs: property tax is 2.8% of price; built in 1910 — expect roof / HVAC / electrical / plumbing capex.
- Climate carrying-cost: moderate wildfire risk; extreme-heat days projected 7→20/yr by 2055 (HVAC capex compounding) — expect insurance premiums to compound above CPI over the hold.
Questions for the listing agent
- It's been on market 98 days. Have you received any prior offers? Is the seller open to a 9% concession, seller financing, or rate buy-down credit?
- Built in 1910 — when were the roof, HVAC, electrical panel, plumbing, and water heater last replaced?
- Property tax is high relative to price — has the assessment been appealed recently, and will the sale trigger a re-assessment?
- Why hasn't it sold? Are there any deal-killer items the seller is aware of (foundation, flood, title, zoning, code violations)?
- Is there a deadline driving the sale (1031 exchange, divorce, estate, relocation)? That informs how much negotiation room exists.
- Schools are F-rated, which usually means shorter tenancies and higher turnover. Who's the typical renter profile here, and what's been the actual vacancy rate?
- Crime grade is F in this area — have there been break-ins, vandalism, or insurance claims at this property in the last 3 years? What carrier currently insures it and at what premium?
- The area grade is low — what's the realistic commute time and amenity access for the typical tenant pool here? Any planned neighborhood developments (good or bad) we should know about?
- What's the average days-on-market for RENTAL listings here right now (not sales)? A rising rental-DOM trend means longer vacancies and softer asking-rent achievability than the comps imply.
- What's the recent tenant-quality profile in this submarket — average credit score on applications, eviction rate, late-payment / NSF rate, and stable-employment percentage? A property-management company in the area should have these aggregated.
- How much new for-sale + rental construction is in the pipeline within 1–3 miles? Heavy new supply typically softens prices + rents 12–24 months out; constrained supply supports both.
Investment metrics
- 1% rule
- 4.79% ✓
- Cap rate
- 42.13%
- Cash-on-cash
- 128.00%
- DSCR
- 6.70
- GRM
- 1.7
CMA / ARV
- ARV (median comp)
- $140,117
- List price
- $20,000
- Delta
- -85.73%
- Verdict
- UNDERPRICED
- Comps
- 20 within 1.0 mi
Show comp detail 3 sales within ~0.75 mi
| Address | Dist | Beds/Ba | Sqft | Sold | Price | $/sf | Match |
|---|---|---|---|---|---|---|---|
| 1816 Joplin St | 0.12mi | 3/2.0 | 1,404 (+10%) | 12mo | $185,000 | $132 | 67 |
| 802 E 19th St | 0.40mi | 3/2.0 | 1,308 (+3%) | 16mo | $168,000 | $128 | 63 |
| 317 W 12th St | 0.64mi | 3/1.0 | 1,401 (+10%) | 19mo | $96,500 | $69 | 34 |
Match score weights: distance 35% · size 25% · config 20% · recency 20%. Top-matched comps best support the ARV.
Projected returns pro-forma
-3.0% appreciation · 3.0% rent growth · sell at horizon
- IRR
- —
- Equity multiple
- 7.22×
- Total profit
- $34,831
- Equity at exit
- $2,982
- IRR
- —
- Equity multiple
- 15.18×
- Total profit
- $79,431
- Equity at exit
- $1,729
Cash invested: $5,600 (down + closing). Projections, not guarantees.
Landlord ↔ Tenant lean methodology
- Overall (STATE)
- 83 Strongly Landlord-Friendly
- State Kansas
- 83 Strongly Landlord-Friendly · R+10
- County
- — inherits STATE
- City
- — inherits STATE
ZIP-level market 66739
- Home prices YoY
- -15.5%
- Active inventory
- 55
- Price-to-rent
- 1.7×
Monthly cashflow live
- Estimated rent
- $959 medium interval (Pro) →
- Mortgage (P&I)
- −$105
- Tax from tax record
- −$47 /mo · $564/yr
- Insurance
- −$8
- HOA
- −$0
- Vacancy / Maint / Mgmt
- −$201
- Net cashflow
- $597
Break-even live
UW: 25.0% down · 7.5% · 30yr · 1.5% tax · 5.0% vac · 8.0% maint · 8.0% mgmt
Financing live
Cash to close
- Down payment
- $5,000
- Closing costs
- $600
- Reserves months
- —
- Total cash needed
- —
Loan-product check · same deal, 3 products live
Conventional
25% down · 7.5% · 30yr
- Down + closing
- —
- Monthly P&I
- —
- Monthly cashflow
- —
- DSCR
- —
- Eligible?
- —
Personal DTI + credit; lowest rate.
DSCR
20% down · 8.5% · 30yr
- Down + closing
- —
- Monthly P&I
- —
- Monthly cashflow
- —
- DSCR
- —
- Eligible?
- —
No personal income docs; deal must DSCR.
Hard money
10% down · 12.0% · 12mo
- Down + closing
- —
- Monthly P&I
- —
- Monthly cashflow
- —
- DSCR
- —
- Eligible?
- —
Short-term bridge; refi at stabilization.
Rent comps 2 comps
| Address | Beds | Baths | Sqft | Rent | $/sqft | DOM | Units | Dist |
|---|---|---|---|---|---|---|---|---|
| 1113 Chica Ln Unit 1 Galena, KS | 2.0 | 1.0 | 1000 | $965 | $0.96 | 43d | 1 | 0.85mi |
| 1001 E 5th St Unit B Galena, KS | 2.0 | 1.0 | 900 | $950 | $1.06 | 43d | 1 | 1.11mi |
Listing history 20 events
-
2026-06-19days on market $20,000 Active 98 DOM
-
2026-06-18days on market $20,000 Active 97 DOM
-
2026-06-17days on market $20,000 Active 96 DOM
-
2026-06-16days on market $20,000 Active 95 DOM
-
2026-06-15days on market $20,000 Active 94 DOM
-
2026-06-14days on market $20,000 Active 92 DOM
-
2026-06-13days on market $20,000 Active 91 DOM
-
2026-06-10days on market $20,000 Active 89 DOM
-
2026-06-09days on market $20,000 Active 88 DOM
-
2026-06-08days on market $20,000 Active 87 DOM
-
2026-06-07days on market $20,000 Active 86 DOM
-
2026-06-05days on market $20,000 Active 83 DOM
-
2026-06-03days on market $20,000 Active 82 DOM
-
2026-06-02days on market $20,000 Active 81 DOM
-
2026-06-01days on market $20,000 Active 80 DOM
-
2026-05-31days on market $20,000 Active 79 DOM
-
2026-05-30days on market $20,000 Active 78 DOM
-
2026-03-12$20,000 Active 206-char remark
Show marketing remark (206 chars)
Looking for a challenging DIY project to test your patience? Bring your vision and give this home a new chance at life or put it out of its misery and gain a nice corner lot to build on. The choice is yours
-
1998-05-01soldstatus $15,000
-
1997-06-01soldstatus $15,000
ⓘ Source: listings_history table (triggers on properties + properties_extension) + one-shot
backfill from property_details.listing_events for pre-trigger history.
Tax reassessment forecast KS · Resets to sale price
- Current annual tax
- $564 · $47/mo
- Projected year-2 tax
- $564 · $47/mo
- Expected delta
- $0/yr ($0/mo · 0.0%)
ⓘ Screening estimate from a state-policy table — verify with the county assessor before closing.
Climate risk First Street
- Flood 1/10 Low FEMA zone X (unshaded) · 0% chance over 30 yrs
- Wildfire 5/10 Major
- Heat 5/10 Major 7 d/yr ≥107°F today · 20 d/yr by 30 yrs out
- Wind 2/10 Low 2% chance of damaging wind over 30 yrs
- Air quality 2/10 Low 1 unhealthy d/yr today · 1 by 30 yrs out
Nearby sold comps map
Loading sold comps map…
Walkable amenities ~0.75 mi
Loading nearby amenities…
Taxation est. · year 1
- Rental income
- $11,507
- − Mortgage interest
- −$1,120
- − Property taxes
- −$564
- − Insurance
- −$100
- − Repairs & maintenance
- −$921
- − Management
- −$921
- − Depreciation
- −$582
- Taxable income
- $7,300
- Est. tax owed @ 24.0%
- −$1,752
- After-tax cash flow
- $5,416/yr
For passive investors: Depreciation is non-cash, so a rental often shows a tax loss while cash-flowing — sheltering income. Rental losses are passive: they offset passive income freely, and up to $25,000/yr can offset ordinary (W-2) income if you actively participate and your MAGI is under $100k (phasing out to $0 by $150k); unused losses carry forward. On sale, claimed depreciation is recaptured at up to 25%, and gains may owe capital-gains tax (a 1031 exchange can defer both). Figures are a year-1 estimate at your 24.0% rate — not tax advice; consult a CPA.
Schools (NCES district)
- District
- Galena
- NCES district ID
- 2006360
- Math proficiency
- 23% ▼ -1.00%
- Reading proficiency
- 35% ▲ 6.00%
- Median HH income
- $38,223
- Composite
- 24.21/100
- National rank
- #7727
- State rank
- #118 of 169 in KS
Livability — Galena
- Score
- 67/100
- State rank
- #239
- US rank
- #10647
Category grades
Schools grade is shown separately in the Schools card above.
Census & demographics
- Census place
- Galena, KS
- Population (ZIP)
- 5,240
Population outlook (Cherokee County) Hauer SSP2
- Today (2025)
- 18,848 people
- By 2030
- 17,862 · -5.2%
- By 2040
- 15,850 · -15.9%
- By 2050
- 13,915 · -26.2%
- By 2075
- 10,102 · -46.4%
- By 2100
- 6,977 · -63.0%
Race, ethnicity, and origin ACS 2023
- Neighborhood character
- Predominantly White (83%)
- Race & ethnicity
- White 83% Two or more races 11% Native American 2% Hispanic / Latino 2%
- Common ancestry
- Slovak 4% Italian 2% Swedish 2%
- Foreign-born
- 2% · China, Canada
- Languages at home
- 99% English-only · Chinese 1%
Political lean MEDSL · Cherokee
- 2024 margin
- Solid R (+52.9) · D 22.6% · R 75.5% · Other 1.9%
- 2008→2024 swing
- -29.2pp toward R · 2008: -23.7pp · 2024: -52.9pp
- All cycles
- 2024: R+52.9 2020: R+49.9 2016: R+48.4 2012: R+29.5 2008: R+23.7
Not yet ingested
- Civics
- —
Market trends
- HPI YoY
- ▼ -31.57%
- Current HPI
- 172.0001
- Rent YoY
- —
- Metro
- —
- State GDP YoY
- —
- F500 in state
- 0
Price history
+33.3% since first listed3 events — show timeline
- 2026-03-12 Listed $20,000 OGAR
- 1998-05-01 Sold (Public Records) $15,000 Public Records
- 1997-06-01 Sold (Public Records) $15,000 Public Records
Property tax history
+7.6%/yrLatest (2025): $564 · +7.9% YoY. Source: county tax records.
Cash-flow waterfall
monthlySold comps — $/sqft
last 12 mo · ≤1 miLoading sold comps…