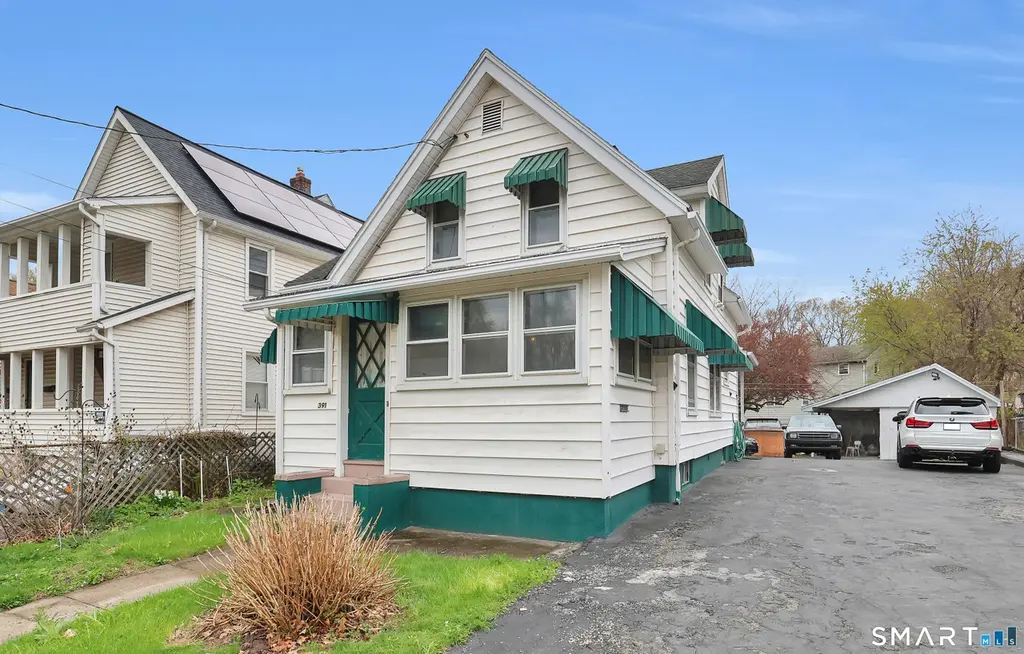
391 Park St · Bristol, CT
Flood risk 1/10 · Minimal
- FEMA flood zone
- X (unshaded)
- Chance of flooding over 30 yrs
- 0.0%
- Est. flood insurance / yr
- $473 – $860
Fire risk 1/10 · Minimal
- Est. fire insurance / yr
- $829 – $1,539
Heat risk 5/10 · Moderate
- Hot days now (above 95°F)
- 8 days/yr
- Hot days in 30 yrs
- 17 days/yr
Wind risk 6/10 · Moderate
- Chance of severe wind over 30 yrs
- 27.0%
Air-quality risk 2/10 · Minimal
- Unhealthy air days now
- 1 days/yr
- Unhealthy air days in 30 yrs
- 1 days/yr
Risk factors via First Street. Map © Google.
Why this score? — see what drove the D grade
The composite is a weighted blend of 9 inputs, each scored 0–100. Each bar is that input's sub-score; the figure is the points it added to the 100-point composite (weight × sub-score).
- ARV discount +15.0/15.0
- Cash flow +10.0/30.0
- Livability +4.0/5.0
- Rent growth +3.9/5.0
- Schools +3.2/10.0
- DSCR +2.9/10.0
- 1% rule +2.8/10.0
- Condition / age +2.5/5.0
- Appreciation +0.0/10.0
$230,000
🖨 Deal sheet (PDF) 📄 Offer letter ✓ Due diligence
Listing remarks
391 Park St offers the perfect blend of classic New England charm, functionality, and affordability in the heart of Bristol. This inviting home features a spacious living room, formal dining room, eat-in kitchen, full bathroom, and a convenient back entry mudroom with laundry area on the main level. Upstairs, you'll find a generously sized landing ideal for a small office, sitting area, or flex space, along with two bedrooms and an additional full bathroom. The home also offers additional finished space in the basement, perfect for a recreation room, home office, gym, or extra storage. Enjoy the enclosed front porch, detached garage, private driveway, and a side carport that can be utilized
Key facts
- 4,791 sq ft lot
- 2 garage spots
- Built 1900
Property features AI
Finance
- Other: Property listed as single family for sale
Exterior
- Parking: Detached garage; Carport; Driveway parking; Total of 8 parking spaces; 2 garages
- Utilities: Public water connected; Public sewer connected
- Home design: Single-family home; Frame construction; White exterior siding
- Construction: Asphalt shingle roof; Vinyl siding; Concrete and stone foundation; Built with frame construction
- Exterior features: Level lot; Private driveway
Interior
- Kitchen: Gas range; Oven/Range; Refrigerator
- Bedrooms: 2 bedrooms
- Bathrooms: 2 full bathrooms
- Heating & cooling: Hot water heating fueled by natural gas; Window unit cooling
- Interior features: 6 total rooms; Full, partially finished basement; Attic with access via hatch; Window air conditioning units
- Laundry & utility: Washer; Dryer; Main level laundry
Neighborhood map
What this means for you Summary
Snapshot
- This is a 2-bed/1.5-bath single-family listed at $230k.
Deal economics
- At list price, monthly cash flow is $-138 ($-2k/yr) — negative.
- To cash-flow at today's rent, offer at most $206k (10.6% below list).
- To meet the 1% rule (rent ≥ 1% of price), the offer needs to be $179k (22.0% below list).
- Recommended offer: $179k (22.0% below list) — sets the bar for 1% rule.
- Cap rate 5.6% vs local median 3.3% in Bristol — top-decile yield for the area; either an underpriced asset or a hidden risk that comps aren't pricing in. Stress-test before assuming the spread holds.
Location & tenants
- Location reads 81/100 on livability (#21 in CT, #1,585 nationally) — a professional / high-income tenant draw. Strengths: crime A+, housing A+, health & safety A+; Watch: commute F.
- Bristol School District (suburban): math 28% / reading 44% proficiency, ranked #109 of 153 in CT (top 71%) — families likely to look elsewhere, expect single-tenant / working-renter base with shorter leases.
- Zoned schools: West Bristol School (math 19% / reading 32%, grade F, #418 of 553 statewide, top 76%, 819 students, 65% FRL); Bristol Central High School (math 25% / reading 55%, grade F, #106 of 194 statewide, top 54%, 1,246 students, 52% FRL) — zoned schools average 58% FRL vs 37% district-wide (21 pts higher); higher-poverty schools than district average — tighter screening recommended.
- Market conditions: Rents rising fast (+5.4%/yr); 222 active listings in the ZIP; 40 comparable units currently listed for rent nearby; rentals at typical pace (median 26d on market — plan ~3-4 weeks tenant-placement turnaround); 40% of comp listings sitting > 30 days — soft ceiling on asking rent; solid renter incomes; 502 units permitted in Naugatuck Valley Planning Region in 2024 (171 in 5+ unit buildings).
Forward outlook
- Local home prices are declining (-3.0%/yr); year-one equity from $2k of loan paydown is wiped out by about $7k of value loss. Plan a longer hold.
Negotiation context
- Only 10 days on market — expect competitive offers; lowballing is unlikely to land.
- 2 sale attempts with the ask held roughly flat each time — persistent listings suggest the price (not the market) is what's stuck; bring a comps-based counter.
Risks & watch-outs
- Watch-outs: built in 1900 — expect roof / HVAC / electrical / plumbing capex.
- Climate carrying-cost: major wind risk, 27% chance of damaging wind over 30y; extreme-heat days projected 8→17/yr by 2055 (HVAC capex compounding) — expect insurance premiums to compound above CPI over the hold.
Questions for the listing agent
- What do current leases actually rent for vs. the listed asking? Can we see a recent rent roll and the last 12 months of T-12 income?
- Built in 1900 — when were the roof, HVAC, electrical panel, plumbing, and water heater last replaced?
- Is there a deadline driving the sale (1031 exchange, divorce, estate, relocation)? That informs how much negotiation room exists.
- The area grade is low — what's the realistic commute time and amenity access for the typical tenant pool here? Any planned neighborhood developments (good or bad) we should know about?
- What's the average days-on-market for RENTAL listings here right now (not sales)? A rising rental-DOM trend means longer vacancies and softer asking-rent achievability than the comps imply.
- What's the recent tenant-quality profile in this submarket — average credit score on applications, eviction rate, late-payment / NSF rate, and stable-employment percentage? A property-management company in the area should have these aggregated.
- How much new for-sale + rental construction is in the pipeline within 1–3 miles? Heavy new supply typically softens prices + rents 12–24 months out; constrained supply supports both.
Investment metrics
- 1% rule
- 0.78% ✗
- Cap rate
- 5.57%
- Cash-on-cash
- -2.57%
- DSCR
- 0.89
- GRM
- 10.7
CMA / ARV
- ARV (median comp)
- $286,120
- List price
- $230,000
- Delta
- -19.61%
- Verdict
- UNDERPRICED
- Comps
- 20 within 1.0 mi
Show comp detail 11 sales within ~0.75 mi
| Address | Dist | Beds/Ba | Sqft | Sold | Price | $/sf | Match |
|---|---|---|---|---|---|---|---|
| 28 Tulip St | 0.39mi | 2/1.5 | 1,084 (-5%) | 4mo | $237,500 | $219 | 70 |
| 176 Rockwell Ave | 0.33mi | 3/2.0 (+1) | 1,200 (+5%) | 5mo | $419,900 | $350 | 65 |
| 19 Steele Rd | 0.51mi | 1/1.5 (-1) | 1,109 (-3%) | 4mo | $235,000 | $212 | 63 |
| 46 Cherry St | 0.46mi | 3/1.0 (+1) | 1,201 (+5%) | 8mo | $325,000 | $271 | 56 |
| 67 Judson Ave | 0.73mi | 3/2.0 (+1) | 1,152 (+1%) | 4mo | $356,000 | $309 | 54 |
| 28 Talmadge St | 0.50mi | 3/1.5 (+1) | 1,093 (-4%) | 14mo | $310,000 | $284 | 53 |
| 1 Ridgewood St | 0.47mi | 2/1.5 | 1,250 (+10%) | 14mo | $262,000 | $210 | 50 |
| 63 Sherman St | 0.70mi | 3/1.0 (+1) | 1,139 (0%) | 18mo | $270,000 | $237 | 45 |
| 115 South ST EXT | 0.71mi | 3/2.5 (+1) | 1,200 (+5%) | 8mo | $320,000 | $267 | 43 |
| 13 Benjamin St | 0.65mi | 3/1.0 (+1) | 974 (-14%) | 2mo | $285,000 | $293 | 37 |
| 87 Magnolia Ave | 0.68mi | 2/1.0 | 988 (-13%) | 16mo | $255,000 | $258 | 31 |
Match score weights: distance 35% · size 25% · config 20% · recency 20%. Top-matched comps best support the ARV.
Projected returns pro-forma
-3.0% appreciation · 5.41% rent growth · sell at horizon
- IRR
- -18.0%
- Equity multiple
- 0.35×
- Total profit
- $-41,596
- Equity at exit
- $34,294
- IRR
- -6.2%
- Equity multiple
- 0.56×
- Total profit
- $-28,312
- Equity at exit
- $19,886
Cash invested: $64,400 (down + closing). Projections, not guarantees.
Landlord ↔ Tenant lean methodology
- Overall (STATE)
- 27 Tenant-Leaning
- State Connecticut
- 27 Tenant-Leaning · D+7
- County
- — inherits STATE
- City
- — inherits STATE
ZIP-level market 06010
- Rents YoY
- 5.4%
- Active inventory
- 222
- Price-to-rent
- 10.7×
Monthly cashflow live
- Estimated rent
- $1,793 high interval (Pro) →
- Mortgage (P&I)
- −$1,206
- Tax from tax record
- −$253 /mo · $3,032/yr
- Insurance
- −$96
- HOA
- −$0
- Vacancy / Maint / Mgmt
- −$377
- Net cashflow
- $-138
Break-even live
Sensitivity live
| Price | -10% $-8 | -5% $-73 | +0% $-138 | +5% $-203 | +10% $-268 |
|---|---|---|---|---|---|
| Rent | -10% $-280 | -5% $-209 | +0% $-138 | +5% $-67 | +10% $4 |
| Rate | -1.0pp $-22 | -0.5pp $-79 | base $-138 | +0.5pp $-198 | +1.0pp $-258 |
UW: 25.0% down · 7.5% · 30yr · 1.5% tax · 5.0% vac · 8.0% maint · 8.0% mgmt
Financing live
Cash to close
- Down payment
- $57,500
- Closing costs
- $6,900
- Reserves months
- —
- Total cash needed
- —
Loan-product check · same deal, 3 products live
Conventional
25% down · 7.5% · 30yr
- Down + closing
- —
- Monthly P&I
- —
- Monthly cashflow
- —
- DSCR
- —
- Eligible?
- —
Personal DTI + credit; lowest rate.
DSCR
20% down · 8.5% · 30yr
- Down + closing
- —
- Monthly P&I
- —
- Monthly cashflow
- —
- DSCR
- —
- Eligible?
- —
No personal income docs; deal must DSCR.
Hard money
10% down · 12.0% · 12mo
- Down + closing
- —
- Monthly P&I
- —
- Monthly cashflow
- —
- DSCR
- —
- Eligible?
- —
Short-term bridge; refi at stabilization.
Rent comps 40 comps
| Address | Beds | Baths | Sqft | Rent | $/sqft | DOM | Units | Dist |
|---|---|---|---|---|---|---|---|---|
| 24 MacArthur Ct Bristol, CT | 3.0 | 1.0 | 950 | $2,300 | $2.42 | 3d | 1 | 0.35mi |
| 171 Newell Ave Bristol, CT | 3.0 | 1.0 | 1040 | $2,300 | $2.21 | 3d | 1 | 0.38mi |
| 174 Newell Ave Bristol, CT | 3.0 | 1.0 | 1100 | $3,000 | $2.73 | 12d | 1 | 0.38mi |
| 72 Colony St Apt 2 Bristol, CT | 2.0 | 1.0 | 1000 | $1,500 | $1.50 | 25d | 1 | 0.40mi |
| 193 Newell Ave Unit 2nd Floor Bristol, CT | 2.0 | 1.0 | 1000 | $1,950 | $1.95 | 12d | 1 | 0.42mi |
| 182 Greene St Unit 2 Bristol, CT | 2.0 | 1.0 | 850 | $1,500 | $1.76 | 45d | 1 | 0.47mi |
| 66 Talmadge St Bristol, CT | 1.0 | 1.0 | 1232 | $1,350 | $1.10 | 45d | 1 | 0.53mi |
| 66 Talmadge St Bristol, CT | 1.0 | 1.0 | 1232 | $1,350 | $1.10 | 25d | 1 | 0.53mi |
| 50 Hillside Pl Unit 3 Bristol, CT | 3.0 | 1.0 | 858 | $1,600 | $1.86 | 45d | 1 | 0.60mi |
| 25 Pratt St Unit 3 Bristol, CT | 2.0 | 1.0 | 1068 | $1,375 | $1.29 | 25d | 1 | 0.68mi |
| 218 West St Unit B2 Bristol, CT | 2.0 | 1.0 | 1000 | $1,550 | $1.55 | 25d | 1 | 0.75mi |
| 218 West St Unit B1 Bristol, CT | 2.0 | 1.0 | 1000 | $1,525 | $1.52 | 25d | 1 | 0.75mi |
| 403 West St Unit 1st FL Bristol, CT | 2.0 | 1.0 | 1044 | $1,375 | $1.32 | 46d | 1 | 0.78mi |
| 407 West St Unit 2nd Floor Bristol, CT | 3.0 | 1.0 | 1100 | $1,425 | $1.30 | 45d | 1 | 0.79mi |
| 34 Center St Unit 2 Bristol, CT | 2.0 | 1.0 | 900 | $1,350 | $1.50 | 45d | 1 | 0.81mi |
| 57 Kelley St Unit 3 Bristol, CT | 2.0 | 1.0 | 952 | $1,550 | $1.63 | 12d | 1 | 0.83mi |
| 44 Kelley St Unit 1 Bristol, CT | 2.0 | 1.0 | 762 | $1,400 | $1.84 | 25d | 1 | 0.85mi |
| 46 Woodard Dr Bristol, CT | 2.0 | 1.5 | 912 | $1,556 | $1.71 | 3d | 2 | 0.86mi |
| 5 Franklin St Unit 2nd Fl Bristol, CT | 1.0 | 1.0 | 700 | $1,200 | $1.71 | 18d | 1 | 0.92mi |
| 484 West St Unit 3rd Floor Bristol, CT | 2.0 | 1.0 | 1256 | $1,850 | $1.47 | 45d | 1 | 0.94mi |
| 484 West St Unit 2nd Floor Bristol, CT | 2.0 | 1.0 | 1256 | $1,900 | $1.51 | 45d | 1 | 0.94mi |
| 130 Church St Bristol, CT | 3.0 | 1.5 | 1422 | $1,900 | $1.34 | 13d | 1 | 0.96mi |
| 130 N Main St Unit 130-310 Bristol, CT | 2.0 | 1.0 | 1101 | $2,300 | $2.09 | 45d | 1 | 0.96mi |
| 130 N Main St Unit 130-411 Bristol, CT | 2.0 | 2.0 | 1310 | $2,600 | $1.98 | 45d | 1 | 0.96mi |
| 130 N Main St Unit 107 Bristol, CT | 2.0 | 2.0 | 1383 | $2,600 | $1.88 | 16d | 1 | 0.96mi |
| 130 N Main St Unit 130-409 Bristol, CT | 1.0 | 1.0 | 866 | $1,950 | $2.25 | 45d | 1 | 0.96mi |
| 130 N Main St Unit 130-211 Bristol, CT | 2.0 | 2.0 | 1310 | $2,500 | $1.91 | 45d | 1 | 0.96mi |
| 130 N Main St Unit 130-209 Bristol, CT | 1.0 | 1.0 | 866 | $1,900 | $2.19 | 25d | 1 | 0.96mi |
| 130 N Main St Unit 130-206 Bristol, CT | 3.0 | 2.0 | 1441 | $2,700 | $1.87 | 25d | 1 | 0.96mi |
| 7 Upson St Unit 5 Bristol, CT | 1.0 | 1.0 | 700 | $1,190 | $1.70 | 25d | 1 | 0.97mi |
| 5 Upson St Unit 5 Bristol, CT | 1.0 | 1.0 | 800 | $1,300 | $1.62 | 4d | 1 | 0.97mi |
| 100 N Main St Unit 105 Bristol, CT | 2.0 | 2.0 | 1441 | $2,600 | $1.80 | 21d | 1 | 0.99mi |
| 100 N Main St Bristol, CT | 1.0 | 1.0 | 840 | $1,900 | $2.26 | 3d | 1 | 0.99mi |
| 100 N Main St Unit 211 Bristol, CT | 2.0 | 2.0 | 1310 | $2,500 | $1.91 | 45d | 1 | 0.99mi |
| 34 Terryville Ave Unit 1 Bristol, CT | 2.0 | 1.0 | 1176 | $1,350 | $1.15 | 25d | 1 | 0.99mi |
| 411 N Main St Unit 8 Bristol, CT | 2.0 | 1.0 | 1012 | $1,595 | $1.58 | 45d | 1 | 1.01mi |
| 411 N Main St #15 Bristol, CT | 2.0 | 1.0 | 875 | $1,595 | $1.82 | 25d | 1 | 1.01mi |
| 425 N Main St Bristol, CT | 2.0 | 1.0 | 900 | $1,595 | $1.77 | 45d | 1 | 1.02mi |
| 435 N Main St Unit 5 Bristol, CT | 2.0 | 1.0 | 800 | $1,400 | $1.75 | 23d | 1 | 1.02mi |
| 431 N Main St Unit 8 Bristol, CT | 2.0 | 1.0 | 850 | $1,595 | $1.88 | 45d | 1 | 1.02mi |
Listing history 7 events
-
2026-06-05statusdays on market $230,000 Under Contract 10 DOM
-
2026-06-03days on market $230,000 Active 9 DOM
-
2026-06-02days on market $230,000 Active 8 DOM
-
2026-06-01days on market $230,000 Active 7 DOM
-
2026-05-31days on market $230,000 Active 6 DOM
-
2026-05-16$230,000 Active 1173-char remark
-
2026-05-15historical $230,000 1173-char remark
ⓘ Source: listings_history table (triggers on properties + properties_extension) + one-shot
backfill from property_details.listing_events for pre-trigger history.
Tax reassessment forecast CT · Partial reset (capped growth)
- Current annual tax
- $3,032 · $253/mo
- Projected year-2 tax
- $3,977 · $331/mo
- Expected delta
- +$945/yr (+$79/mo · 31.2%)
ⓘ Screening estimate from a state-policy table — verify with the county assessor before closing.
Climate risk First Street
- Flood 1/10 Low FEMA zone X (unshaded) · 0% chance over 30 yrs
- Wildfire 1/10 Low
- Heat 5/10 Major 8 d/yr ≥95°F today · 17 d/yr by 30 yrs out
- Wind 6/10 Major 27% chance of damaging wind over 30 yrs
- Air quality 2/10 Low 1 unhealthy d/yr today · 1 by 30 yrs out
Nearby sold comps map
Loading sold comps map…
Walkable amenities ~0.75 mi
Loading nearby amenities…
Taxation est. · year 1
- Rental income
- $21,520
- − Mortgage interest
- −$12,884
- − Property taxes
- −$3,032
- − Insurance
- −$1,150
- − Repairs & maintenance
- −$1,722
- − Management
- −$1,722
- − Depreciation
- −$6,691
- Taxable loss
- −$5,680
- Est. tax savings @ 24.0%
- +$1,363
- After-tax cash flow
- $-292/yr
For passive investors: Depreciation is non-cash, so a rental often shows a tax loss while cash-flowing — sheltering income. Rental losses are passive: they offset passive income freely, and up to $25,000/yr can offset ordinary (W-2) income if you actively participate and your MAGI is under $100k (phasing out to $0 by $150k); unused losses carry forward. On sale, claimed depreciation is recaptured at up to 25%, and gains may owe capital-gains tax (a 1031 exchange can defer both). Figures are a year-1 estimate at your 24.0% rate — not tax advice; consult a CPA.
Schools (NCES district)
- District
- Bristol School District
- NCES district ID
- 0900510
- Math proficiency
- 28% ▼ -10.00%
- Reading proficiency
- 44% ▼ -5.00%
- Median HH income
- $59,953
- Composite
- 32.07/100
- National rank
- #5814
- State rank
- #109 of 153 in CT
Livability — Bristol
- Score
- 81/100
- State rank
- #21
- US rank
- #1585
Category grades
Schools grade is shown separately in the Schools card above.
Census & demographics
- Census place
- Bristol, CT
- County
- Hartford County · 754,208 people
- City population
- 61,684
- Metro
- Hartford-East Hartford-Middletown, CT
- Population (ZIP)
- 61,684
- Household income
- $79,314
- Rent vs Own
- Severe rent burden
- 2172.0
Population outlook (Naugatuck Valley County) Hauer SSP2
- By 2040
- 496,846
Race, ethnicity, and origin ACS 2023
- Neighborhood character
- Majority White (65%)
- Race & ethnicity
- White 65% Hispanic / Latino 19% Two or more races 13% Black 7% Asian 5%
- Hispanic origin (detail)
- Mexican 2% Puerto Rican 13%
- Common ancestry
- Lithuanian 11% Romanian 10% Slovak 1%
- Foreign-born
- 10% · Canada
- Languages at home
- 79% English-only · Spanish 11% Other Indo-European 3% Russian/Polish/Slavic 2%
Political lean MEDSL · Naugatuck Valley
- 2024 margin
- Lean R (+7.4) · D 45.6% · R 53.0% · Other 1.4%
- All cycles
- 2024: R+7.4
Not yet ingested
- Civics
- —
Market trends
- HPI YoY
- ▼ -293.55%
- Current HPI
- 255.5419
- Rent YoY
- ▲ 5.41%
- Metro
- Hartford-East Hartford-Middletown, CT
- State GDP YoY
- ▲ 1.06%
- F500 in state
- 38
Industry mix (Fortune 500 HQ in CT)
| Industry | F500 HQs | Revenue |
|---|---|---|
| Industrial Machinery | 4 | $38B |
|
||
| Insurance | 3 | $71B |
|
||
| Financial Services | 2 | $25B |
|
||
| Transportation / Logistics | 2 | $18B |
|
||
| Healthcare | 1 | $247B |
|
||
| Telecommunications | 1 | $55B |
|
||
Price history
+0.0% since first listed5 events — show timeline
- 2026-06-04 Pending — Smart MLS
- 2026-05-29 Relisted — Smart MLS
- 2026-05-19 Pending — Smart MLS
- 2026-05-16 Listed $230,000 Smart MLS
- 2026-05-15 Coming Soon $230,000 Smart MLS
Property tax history
+2.2%/yrLatest (2025): $3,032 · +5.9% YoY. Source: county tax records.
Cash-flow waterfall
monthlySold comps — $/sqft
last 12 mo · ≤1 miLoading sold comps…