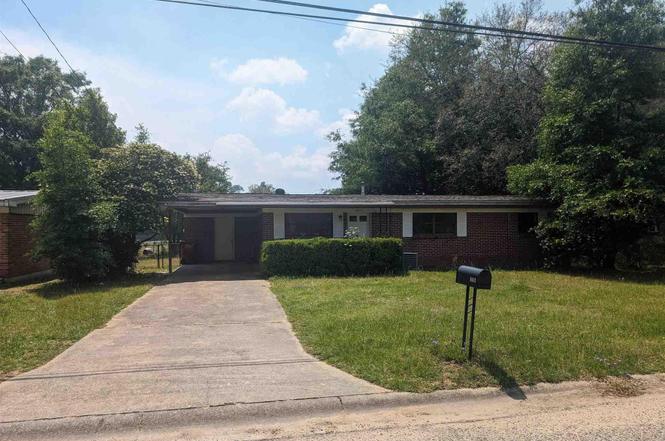
6411 Julia Dr · Milton, FL
Flood risk 8/10 · Major
- FEMA flood zone
- X (unshaded)
- Chance of flooding over 30 yrs
- 0.99%
- Est. flood insurance / yr
- $507 – $1,088
Fire risk 3/10 · Minor
- Est. fire insurance / yr
- $947 – $1,759
Heat risk 9/10 · Severe
- Hot days now (above 106°F)
- 7 days/yr
- Hot days in 30 yrs
- 20 days/yr
Wind risk 9/10 · Severe
- Chance of severe wind over 30 yrs
- 99.0%
Air-quality risk 1/10 · Minimal
- Unhealthy air days now
- 0 days/yr
- Unhealthy air days in 30 yrs
- 0 days/yr
Risk factors via First Street. Map © Google.
Why this score? — see what drove the B- grade
The composite is a weighted blend of 9 inputs, each scored 0–100. Each bar is that input's sub-score; the figure is the points it added to the 100-point composite (weight × sub-score).
- Cash flow +26.0/30.0
- ARV discount +13.4/15.0
- DSCR +8.8/10.0
- 1% rule +6.1/10.0
- Schools +5.3/10.0
- Livability +3.9/5.0
- Rent growth +3.2/5.0
- Condition / age +2.5/5.0
- Appreciation +0.0/10.0
$169,900
🖨 Deal sheet (PDF) 📄 Offer letter ✓ Due diligence
Listing remarks MLS
Will be a Neat Little Home after seller has repairs done (new carpet and paint) to be done right away. Centrally located, good for investors or 1st time home buyers. Sold "AS IS" "WHERE IS" with no guarantees.
Key facts
- Brick home
- New kitchen cabinets
- New kitchen sink
Tags
Property features AI
Finance
- Other: Publicly maintained road access
- HOA & community: No homeowners association
Exterior
- Parking: Carport (covered, 1 covered space; total 1 parking space)
- Utilities: Public water; Public sewer; Electric service with circuit breakers and copper wiring
- Home design: Single-story (one level); Detached property; Frame construction
- Construction: Shingle roof; Slab foundation
- Exterior features: Porch; Chain link fencing; Interior lot
Interior
- Kitchen: Remodeled kitchen; Kitchen cabinets replaced December 2023; Includes dishwasher and refrigerator; Electric water heater
- Bedrooms: Primary bedroom on the first floor, approximately 12' x 11'
- Flooring: Tile
- Bathrooms: 1 full bathroom
- Heating & cooling: Central heating; Central air conditioning
- Interior features: Tile flooring; Some blinds
- Laundry & utility: Washer/dryer hookups
Neighborhood map
What this means for you Summary
Snapshot
- This is a 3-bed/1.0-bath single-family listed at $170k.
Deal economics
- At list price, monthly cash flow is $358 ($4k/yr) — positive.
- The deal already cash-flows at list — no discount required.
- Meets the 1% rule at list price ($2k rent vs $170k).
- Recommended offer: $150k (12.0% below list) — sets the bar for market timing.
- Cap rate 9.3% vs local median 4.6% in Milton — top-decile yield for the area; either an underpriced asset or a hidden risk that comps aren't pricing in. Stress-test before assuming the spread holds.
Location & tenants
- Location reads 78/100 on livability (#166 in FL, #2,480 nationally) — a middle-class / working-renter tenant base. Strengths: cost of living A+, housing A+, health & safety A+; Watch: amenities D-, commute F.
- Santa Rosa (suburban): math 63% / reading 60% proficiency, ranked #8 of 73 in FL (top 11%) — acceptable for families but not a draw, mixed tenant base, ~2y average lease.
- Zoned schools: W. H. Rhodes Elementary School (math 55% / reading 47%, grade C-, #1,043 of 2,144 statewide, top 49%, 812 students, 79% FRL); Martin Luther King Middle School (math 38% / reading 41%, grade F, #373 of 571 statewide, top 66%, 660 students, 69% FRL); Milton High School (math 44% / reading 42%, grade F, #255 of 667 statewide, top 39%, 2,085 students, 54% FRL) — zoned schools average 67% FRL vs 36% district-wide (31 pts higher); higher-poverty schools than district average — tighter screening recommended.
- Zoned-school proficiency averages 44% at this address vs 62% district-wide (-17 pts) — the specific schools serving this property underperform the Santa Rosa average; the district grade overstates school quality for this exact location.
- Market conditions: Rents rising (+2.7%/yr); 360 active listings in the ZIP; 2 comparable units currently listed for rent nearby; solid renter incomes; 1,983 units permitted in Santa Rosa County in 2024 (128 in 5+ unit buildings).
Forward outlook
- Local home prices are declining (-3.0%/yr); year-one equity from $1k of loan paydown is wiped out by about $5k of value loss. Plan a longer hold.
- Santa Rosa County population projected at +31% by 2050 — long-run rental-demand tailwind backs the buy-and-hold thesis.
Negotiation context
- It's been on market 804 days — a 12% lower offer ($150k) is reasonable based on typical stale-listing flexibility.
- 3 sale attempts since 25y ago; this cycle's ask has dropped $20k (11%) from the opening price — seller is motivated, your offer sets the floor, not the list.
- Current owner paid $60k; list at $170k implies a 183% gain — meaningful room to come down on a strong offer.
Risks & watch-outs
- Watch-outs: flood insurance adds $66/mo.
- Climate carrying-cost: severe flood risk; severe wind risk, 99% chance of damaging wind over 30y; extreme-heat days projected 7→20/yr by 2055 (HVAC capex compounding) — expect insurance premiums to compound above CPI over the hold.
Questions for the listing agent
- It's been on market 804 days. Have you received any prior offers? Is the seller open to a 12% concession, seller financing, or rate buy-down credit?
- Built in 1961 — when were the roof, HVAC, electrical panel, plumbing, and water heater last replaced?
- What's the actual annual flood-insurance premium (NFIP or private), and is the property in a SFHA with mandatory coverage?
- Why hasn't it sold? Are there any deal-killer items the seller is aware of (foundation, flood, title, zoning, code violations)?
- Is there a deadline driving the sale (1031 exchange, divorce, estate, relocation)? That informs how much negotiation room exists.
- Schools are B-rated — typically a magnet for longer-tenancy family renters. What's the average tenant stay here, and is there a school-zone premium baked into asking?
- What's the average days-on-market for RENTAL listings here right now (not sales)? A rising rental-DOM trend means longer vacancies and softer asking-rent achievability than the comps imply.
- What's the recent tenant-quality profile in this submarket — average credit score on applications, eviction rate, late-payment / NSF rate, and stable-employment percentage? A property-management company in the area should have these aggregated.
- How much new for-sale + rental construction is in the pipeline within 1–3 miles? Heavy new supply typically softens prices + rents 12–24 months out; constrained supply supports both.
Investment metrics
- 1% rule
- 1.11% ✓
- Cap rate
- 9.29%
- Cash-on-cash
- 10.70%
- DSCR
- 1.48
- GRM
- 7.5
CMA / ARV
- ARV (on-the-fly)
- $195,775
- Comps found
- 12
Show comp detail 12 sales within ~0.75 mi
| Address | Dist | Beds/Ba | Sqft | Sold | Price | $/sf | Match |
|---|---|---|---|---|---|---|---|
| 6409 Julia Dr | 0.01mi | 3/1.0 | 1,000 (-2%) | 12mo | $191,000 | $191 | 86 |
| 6464 Magnolia St | 0.55mi | 3/1.0 | 1,051 (+2%) | 2mo | $215,000 | $205 | 68 |
| 5869 Byrom St | 0.57mi | 2/1.0 (-1) | 1,000 (-2%) | 3mo | $183,000 | $183 | 62 |
| 6444 Walnut St | 0.64mi | 3/1.0 | 1,075 (+5%) | 2mo | $190,000 | $177 | 60 |
| 5910 Independence Dr | 0.42mi | 2/1.0 (-1) | 995 (-3%) | 14mo | $167,000 | $168 | 59 |
| 6124 Patricia Ave | 0.34mi | 3/1.0 | 913 (-11%) | 10mo | $144,500 | $158 | 58 |
| 6094 Syrcle Ave | 0.30mi | 3/2.0 | 1,120 (+9%) | 11mo | $233,000 | $208 | 58 |
| 5996 Savannah Dr | 0.29mi | 3/2.0 | 1,144 (+12%) | 8mo | $199,900 | $175 | 57 |
| 6456 Gaynell Ave | 0.42mi | 3/1.0 | 1,152 (+12%) | 5mo | $178,000 | $155 | 56 |
| 6003 Savannah Dr | 0.28mi | 3/2.0 | 1,153 (+12%) | 11mo | $249,000 | $216 | 53 |
| 5982 Queen St | 0.29mi | 2/1.0 (-1) | 874 (-15%) | 7mo | $175,000 | $200 | 51 |
| 6400 Gaynell Ave | 0.36mi | 3/2.0 | 1,167 (+14%) | 12mo | $229,000 | $196 | 46 |
Match score weights: distance 35% · size 25% · config 20% · recency 20%. Top-matched comps best support the ARV.
Projected returns pro-forma
-3.0% appreciation · 2.7% rent growth · sell at horizon
- IRR
- -3.0%
- Equity multiple
- 0.89×
- Total profit
- $-5,303
- Equity at exit
- $25,333
- IRR
- 6.4%
- Equity multiple
- 1.47×
- Total profit
- $22,423
- Equity at exit
- $14,690
Cash invested: $47,572 (down + closing). Projections, not guarantees.
Landlord ↔ Tenant lean methodology
- Overall (STATE)
- 87 Strongly Landlord-Friendly
- State Florida
- 87 Strongly Landlord-Friendly · R+3
- County
- — inherits STATE
- City
- — inherits STATE
ZIP-level market 32570
- Home prices YoY
- -15.1%
- Rents YoY
- 2.7%
- Active inventory
- 360
- Price-to-rent
- 7.5×
Monthly cashflow live
- Estimated rent
- $1,879 medium interval (Pro) →
- Mortgage (P&I)
- −$891
- Tax from tax record
- −$98 /mo · $1,178/yr
- Insurance
- −$71
- Flood insurance flood zone
- −$66 /mo · $798/yr
- HOA
- −$0
- Vacancy / Maint / Mgmt
- −$395
- Net cashflow
- $358
Break-even live
Sensitivity live
| Price | -10% $454 | -5% $406 | +0% $358 | +5% $310 | +10% $262 |
|---|---|---|---|---|---|
| Rent | -10% $209 | -5% $284 | +0% $358 | +5% $432 | +10% $506 |
| Rate | -1.0pp $443 | -0.5pp $401 | base $358 | +0.5pp $314 | +1.0pp $269 |
UW: 25.0% down · 7.5% · 30yr · 1.5% tax · 5.0% vac · 8.0% maint · 8.0% mgmt
Financing live
Cash to close
- Down payment
- $42,475
- Closing costs
- $5,097
- Reserves months
- —
- Total cash needed
- —
Loan-product check · same deal, 3 products live
Conventional
25% down · 7.5% · 30yr
- Down + closing
- —
- Monthly P&I
- —
- Monthly cashflow
- —
- DSCR
- —
- Eligible?
- —
Personal DTI + credit; lowest rate.
DSCR
20% down · 8.5% · 30yr
- Down + closing
- —
- Monthly P&I
- —
- Monthly cashflow
- —
- DSCR
- —
- Eligible?
- —
No personal income docs; deal must DSCR.
Hard money
10% down · 12.0% · 12mo
- Down + closing
- —
- Monthly P&I
- —
- Monthly cashflow
- —
- DSCR
- —
- Eligible?
- —
Short-term bridge; refi at stabilization.
Rent comps 2 comps
| Address | Beds | Baths | Sqft | Rent | $/sqft | DOM | Units | Dist |
|---|---|---|---|---|---|---|---|---|
| 6460 Stewart St Milton, FL | 1.0–3.0 | 1.0–2.0 | 872 | $1,500 | $1.72 | 25d | 1 | 0.71mi |
| 6593 Lee St Unit B Milton, FL | 2.0 | 1.0 | 750 | $1,300 | $1.73 | 22d | 1 | 0.78mi |
Listing history 33 events
-
2026-06-22days on market $169,900 Active 804 DOM
-
2026-06-18days on market $169,900 Active 801 DOM
-
2026-06-17days on market $169,900 Active 800 DOM
-
2026-06-16days on market $169,900 Active 799 DOM
-
2026-06-15days on market $169,900 Active 798 DOM
-
2026-06-14days on market $169,900 Active 796 DOM
-
2026-06-10days on market $169,900 Active 793 DOM
-
2026-06-09days on market $169,900 Active 792 DOM
-
2026-06-08days on market $169,900 Active 791 DOM
-
2026-06-07days on market $169,900 Active 790 DOM
-
2026-06-05days on market $169,900 Active 787 DOM
-
2026-06-03days on market $169,900 Active 786 DOM
-
2026-06-02days on market $169,900 Active 785 DOM
-
2026-06-01days on market $169,900 Active 784 DOM
-
2026-05-31days on market $169,900 Active 783 DOM
-
2026-05-31days on market $169,900 Active 782 DOM
-
2026-04-09price $169,900
-
2025-03-18price $174,900
-
2025-02-26price $179,900
-
2024-04-08$189,900 Active
-
2005-04-25soldstatus $60,000 230-char remark
Show marketing remark (230 chars)
Will be a Neat Little Home after seller has repairs done (new carpet and paint) to be done right away. Centrally located, good for investors or 1st time home buyers. Sold "AS IS" "WHERE IS" with no guarantees.
-
2005-03-18$60,000 230-char remark
Show marketing remark (230 chars)
Will be a Neat Little Home after seller has repairs done (new carpet and paint) to be done right away. Centrally located, good for investors or 1st time home buyers. Sold "AS IS" "WHERE IS" with no guarantees.
-
2003-12-03soldstatus $52,400
-
2003-11-17soldstatus $52,400
-
2003-11-17soldstatus $26,200
-
2002-04-17soldstatus $53,000
-
2002-04-15soldstatus $53,000 427-char remark
Show marketing remark (427 chars)
THIS HOME IS REMARKABLE IT IS SO VERY NICE. 0WNERS MADE THE REMODELING SHINE.VERY NICE TILE FLOOR AND WALLS IN BATH WITH NICE LARGE CABINETS. kITCHEN COUNTERS AND CABINETS ARE GREAT. TOP OF THE LINE REF. AND STOVE WHIRLPOOL .. DOUBLE PANEWINDOWS. GOOD STORAGE INSIDE AND OUT. THE HOUSE ISW FAR ABOVE THE ADVERAGE . PRICED TO SELL. LB ON CARPORT DOOR. KEYS TO LAUNDRY AND STORAGE IN 2ND KIT DRAWER.
-
2001-10-30$52,300 427-char remark
Show marketing remark (427 chars)
THIS HOME IS REMARKABLE IT IS SO VERY NICE. 0WNERS MADE THE REMODELING SHINE.VERY NICE TILE FLOOR AND WALLS IN BATH WITH NICE LARGE CABINETS. kITCHEN COUNTERS AND CABINETS ARE GREAT. TOP OF THE LINE REF. AND STOVE WHIRLPOOL .. DOUBLE PANEWINDOWS. GOOD STORAGE INSIDE AND OUT. THE HOUSE ISW FAR ABOVE THE ADVERAGE . PRICED TO SELL. LB ON CARPORT DOOR. KEYS TO LAUNDRY AND STORAGE IN 2ND KIT DRAWER.
-
1989-12-01soldstatus $22,500
-
1988-10-01soldstatus $26,800
-
1977-07-01soldstatus $24,000
-
1975-04-01soldstatus $19,000
-
1973-06-01soldstatus $11,500
ⓘ Source: listings_history table (triggers on properties + properties_extension) + one-shot
backfill from property_details.listing_events for pre-trigger history.
Tax reassessment forecast FL · Resets to sale price
- Current annual tax
- $1,178 · $98/mo
- Projected year-2 tax
- $1,410 · $118/mo
- Expected delta
- +$232/yr (+$19/mo · 19.7%)
ⓘ Screening estimate from a state-policy table — verify with the county assessor before closing.
Climate risk First Street
- Flood 8/10 Severe FEMA zone X (unshaded) · 99% chance over 30 yrs
- Wildfire 3/10 Moderate
- Heat 9/10 Extreme 7 d/yr ≥106°F today · 20 d/yr by 30 yrs out
- Wind 9/10 Extreme 99% chance of damaging wind over 30 yrs
- Air quality 1/10 Low 0 unhealthy d/yr today · 0 by 30 yrs out
Nearby sold comps map
Loading sold comps map…
Walkable amenities ~0.75 mi
Loading nearby amenities…
Taxation est. · year 1
- Rental income
- $22,546
- − Mortgage interest
- −$9,517
- − Property taxes
- −$1,178
- − Insurance
- −$1,647
- − Repairs & maintenance
- −$1,804
- − Management
- −$1,804
- − Depreciation
- −$4,943
- Taxable income
- $1,654
- Est. tax owed @ 24.0%
- −$397
- After-tax cash flow
- $3,898/yr
For passive investors: Depreciation is non-cash, so a rental often shows a tax loss while cash-flowing — sheltering income. Rental losses are passive: they offset passive income freely, and up to $25,000/yr can offset ordinary (W-2) income if you actively participate and your MAGI is under $100k (phasing out to $0 by $150k); unused losses carry forward. On sale, claimed depreciation is recaptured at up to 25%, and gains may owe capital-gains tax (a 1031 exchange can defer both). Figures are a year-1 estimate at your 24.0% rate — not tax advice; consult a CPA.
Schools (NCES district)
- District
- Santa Rosa
- NCES district ID
- 1201650
- Math proficiency
- 63% ▼ -6.00%
- Reading proficiency
- 60% ▼ -5.00%
- Median HH income
- $58,161
- Composite
- 53.12/100
- National rank
- #1511
- State rank
- #8 of 73 in FL
Livability — Milton
- Score
- 78/100
- State rank
- #166
- US rank
- #2480
Category grades
Schools grade is shown separately in the Schools card above.
Census & demographics
- County
- Santa Rosa County · 194,764 people
- City population
- 69,025
- Metro
- Pensacola-Ferry Pass-Brent, FL
- Population (ZIP)
- 37,197
- Household income
- $77,222
- Rent vs Own
- Severe rent burden
- 590.0
Population outlook (Santa Rosa County) Hauer SSP2
- Today (2025)
- 195,978 people
- By 2030
- 209,782 · +7.0%
- By 2040
- 235,293 · +20.1%
- By 2050
- 256,408 · +30.8%
- By 2075
- 298,074 · +52.1%
- By 2100
- 303,216 · +54.7%
Race, ethnicity, and origin ACS 2023
- Neighborhood character
- Predominantly White (80%)
- Race & ethnicity
- White 80% Two or more races 7% Black 6% Hispanic / Latino 6% Asian 1%
- Hispanic origin (detail)
- Mexican 2% Puerto Rican 2%
- Common ancestry
- Italian 4% Lithuanian 3% Portuguese 2%
- Foreign-born
- 4% · Canada
- Languages at home
- 94% English-only · Spanish 4% Other Asian/Pacific 1%
Political lean MEDSL · Santa Rosa
- 2024 margin
- Solid R (+51.0) · D 24.1% · R 75.0%
- 2008→2024 swing
- -3.0pp toward R · 2008: -47.9pp · 2024: -51.0pp
- All cycles
- 2024: R+51.0 2020: R+46.5 2016: R+53.5 2012: R+52.6 2008: R+47.9
Not yet ingested
- Civics
- —
Market trends
- HPI YoY
- ▼ -51.06%
- Current HPI
- 287.7469
- Rent YoY
- ▲ 2.70%
- Metro
- Pensacola-Ferry Pass-Brent, FL
- State GDP YoY
- ▲ 3.28%
- F500 in state
- 36
Industry mix (Fortune 500 HQ in FL)
| Industry | F500 HQs | Revenue |
|---|---|---|
| Industrial Technology | 2 | $29B |
|
||
| Insurance | 2 | $17B |
|
||
| Retail | 1 | $60B |
|
||
| Technology Distribution | 1 | $58B |
|
||
| Homebuilding | 1 | $35B |
|
||
| Technology Manufacturing | 1 | $35B |
|
||
Price history
+1377.4% since first listed17 events — show timeline
- 2026-04-09 Price Changed $169,900 PARMLS
- 2025-03-18 Price Changed $174,900 PARMLS
- 2025-02-26 Price Changed $179,900 PARMLS
- 2024-04-08 Listed $189,900 PARMLS
- 2005-04-25 Sold (MLS) $60,000 PARMLS
- 2005-03-18 Listed $60,000 PARMLS
- 2003-12-03 Sold (Public Records) $52,400 Public Records
- 2003-11-17 Sold (Public Records) $26,200 Public Records
- 2003-11-17 Sold (Public Records) $52,400 Public Records
- 2002-04-17 Sold (Public Records) $53,000 Public Records
- 2002-04-15 Sold (MLS) $53,000 PARMLS
- 2001-10-30 Listed $52,300 PARMLS
- 1989-12-01 Sold (Public Records) $22,500 Public Records
- 1988-10-01 Sold (Public Records) $26,800 Public Records
- 1977-07-01 Sold (Public Records) $24,000 Public Records
- 1975-04-01 Sold (Public Records) $19,000 Public Records
- 1973-06-01 Sold (Public Records) $11,500 Public Records
Property tax history
+5.9%/yrLatest (2025): $1,178 · +13.9% YoY. Source: county tax records.
Cash-flow waterfall
monthlySold comps — $/sqft
last 12 mo · ≤1 miLoading sold comps…