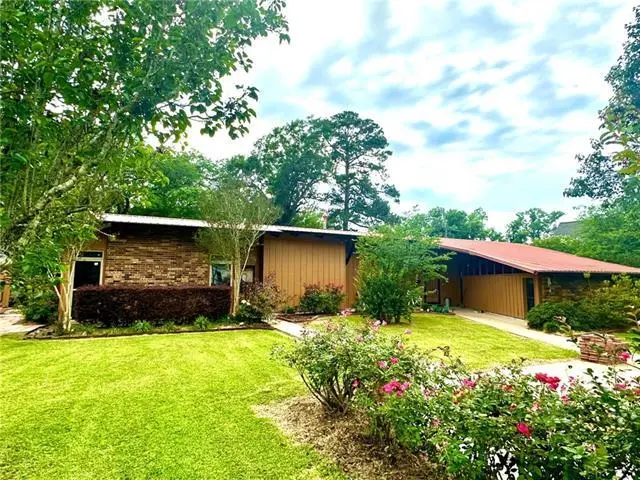
705 Third St · Colfax, LA
Flood risk 1/10 · Minimal
- FEMA flood zone
- X (shaded)
- Chance of flooding over 30 yrs
- 0.0%
- Est. flood insurance / yr
- $507 – $1,088
Fire risk 1/10 · Minimal
- Est. fire insurance / yr
- $1,269 – $2,357
Heat risk 8/10 · Major
- Hot days now (above 111°F)
- 7 days/yr
- Hot days in 30 yrs
- 20 days/yr
Wind risk 8/10 · Major
- Chance of severe wind over 30 yrs
- 92.0%
Air-quality risk 1/10 · Minimal
- Unhealthy air days now
- 0 days/yr
- Unhealthy air days in 30 yrs
- 0 days/yr
Risk factors via First Street. Map © Google.
Why this score? — see what drove the D grade
The composite is a weighted blend of 9 inputs, each scored 0–100. Each bar is that input's sub-score; the figure is the points it added to the 100-point composite (weight × sub-score).
- Cash flow +10.6/30.0
- Appreciation +8.0/10.0
- ARV discount +7.5/15.0
- Livability +3.3/5.0
- DSCR +3.1/10.0
- Schools +2.6/10.0
- Rent growth +2.5/5.0
- Condition / age +2.5/5.0
- 1% rule +2.4/10.0
$175,000
🖨 Deal sheet (PDF) 📄 Offer letter ✓ Due diligence
Listing remarks
Don't miss this unique mid-century home! It features beautiful wood tongue and groove ceiling along with granite countertops throughout, and new windows through most of the home. There space for everyone in this one with 4 bedrooms, 2 bathrooms, and a separate office and sits on a large beautifully landscaped yard. This unique home is a must see it offers plenty of space for everyone at a steal of a deal. This home is listed below recent appraised value.
Key facts
- Separate office
- Landscaped yard
- Granite countertops
Tags
Property features AI
Exterior
- Parking: Attached parking
- Home design: Single family residence; Corner lot location (Third & North)
- Construction: Metal roof; Wood siding construction
- Exterior features: Wood fence; Workshop on property
Interior
- Kitchen: Dishwasher
- Bedrooms: Bedroom 1 (main level); Bedroom 2 (main level); Bedroom 3 (main level)
- Bathrooms: 2 full bathrooms
- Heating & cooling: Central heating; Central air conditioning; Multiple cooling units
- Interior features: Vaulted ceilings; Dining room; Living room; Kitchen; Bathroom; Bedrooms (see Bedrooms section)
Neighborhood map
What this means for you Summary
Snapshot
- This is a 4-bed/2.0-bath single-family listed at $175k.
Deal economics
- At list price, monthly cash flow is $-86 ($-1k/yr) — negative.
- To cash-flow at today's rent, offer at most $160k (8.7% below list).
- To meet the 1% rule (rent ≥ 1% of price), the offer needs to be $130k (25.8% below list).
- Recommended offer: $130k (25.8% below list) — sets the bar for 1% rule.
Location & tenants
- Location reads 66/100 on livability (#122 in LA) — a middle-class / working-renter tenant base. Strengths: cost of living A+, health & safety A+, housing B+; Watch: amenities F, commute F, employment F.
- Grant Parish (rural): math 27% / reading 34% proficiency, ranked #43 of 98 in LA (top 44%) — families likely to look elsewhere, expect single-tenant / working-renter base with shorter leases.
- Zoned schools: Colfax Elementary School (math 2% / reading 8%, grade F, #633 of 646 statewide, top 99%, 126 students, 88% FRL); Grant Junior High School (math 29% / reading 34%, grade F, #108 of 218 statewide, top 50%, 504 students, 73% FRL); Grant High School (math 42% / reading 52%, grade D-, #45 of 265 statewide, top 20%, 658 students, 68% FRL) — zoned schools average 76% FRL vs 59% district-wide (17 pts higher); higher-poverty schools than district average — tighter screening recommended.
- Market conditions: 24 active listings in the ZIP; 5 units permitted in Grant Parish in 2024 (0 in 5+ unit buildings).
Forward outlook
- In year one you build about $12k of equity ($1k loan paydown + $10k appreciation (6.0% local appreciation)).
- Grant County population projected to shrink 4% by 2050 — rents likely to lag national; underwrite the cash flow, not the appreciation.
- By year 4, paydown + projected appreciation supports a ~$40k cash-out refi (75% LTV) — recoverable capital for the next deal without selling this one.
Negotiation context
- It's been on market 23 days — a 2% lower offer ($172k) is reasonable based on typical stale-listing flexibility.
- Current owner paid $49k; list at $175k implies a 257% gain — meaningful room to come down on a strong offer.
Risks & watch-outs
- Climate carrying-cost: severe wind risk, 92% chance of damaging wind over 30y; extreme-heat days projected 7→20/yr by 2055 (HVAC capex compounding) — expect insurance premiums to compound above CPI over the hold.
Questions for the listing agent
- What do current leases actually rent for vs. the listed asking? Can we see a recent rent roll and the last 12 months of T-12 income?
- Built in 1962 — when were the roof, HVAC, electrical panel, plumbing, and water heater last replaced?
- Is there a deadline driving the sale (1031 exchange, divorce, estate, relocation)? That informs how much negotiation room exists.
- Schools are F-rated, which usually means shorter tenancies and higher turnover. Who's the typical renter profile here, and what's been the actual vacancy rate?
- The area grade is low — what's the realistic commute time and amenity access for the typical tenant pool here? Any planned neighborhood developments (good or bad) we should know about?
- What's the average days-on-market for RENTAL listings here right now (not sales)? A rising rental-DOM trend means longer vacancies and softer asking-rent achievability than the comps imply.
- What's the recent tenant-quality profile in this submarket — average credit score on applications, eviction rate, late-payment / NSF rate, and stable-employment percentage? A property-management company in the area should have these aggregated.
- How much new for-sale + rental construction is in the pipeline within 1–3 miles? Heavy new supply typically softens prices + rents 12–24 months out; constrained supply supports both.
Investment metrics
- 1% rule
- 0.74% ✗
- Cap rate
- 5.70%
- Cash-on-cash
- -2.11%
- DSCR
- 0.91
- GRM
- 11.2
CMA / ARV
No comps found within radius.
Projected returns pro-forma
5.95% appreciation · 3.0% rent growth · sell at horizon
- IRR
- 13.5%
- Equity multiple
- 1.91×
- Total profit
- $44,429
- Equity at exit
- $109,411
- IRR
- 14.0%
- Equity multiple
- 3.76×
- Total profit
- $135,053
- Equity at exit
- $197,896
Cash invested: $49,000 (down + closing). Projections, not guarantees.
Landlord ↔ Tenant lean methodology
- Overall (STATE)
- 90 Strongly Landlord-Friendly
- State Louisiana
- 90 Strongly Landlord-Friendly · R+12
- County
- — inherits STATE
- City
- — inherits STATE
ZIP-level market 71417
- Home prices YoY
- 5.2%
- Active inventory
- 24
- Price-to-rent
- 11.2×
Monthly cashflow live
- Estimated rent
- $1,298 medium interval (Pro) →
- Mortgage (P&I)
- −$918
- Tax from tax record
- −$121 /mo · $1,453/yr
- Insurance
- −$73
- HOA
- −$0
- Vacancy / Maint / Mgmt
- −$273
- Net cashflow
- $-86
Break-even live
Sensitivity live
| Price | -10% $13 | -5% $-37 | +0% $-86 | +5% $-136 | +10% $-185 |
|---|---|---|---|---|---|
| Rent | -10% $-189 | -5% $-138 | +0% $-86 | +5% $-35 | +10% $16 |
| Rate | -1.0pp $2 | -0.5pp $-42 | base $-86 | +0.5pp $-132 | +1.0pp $-178 |
UW: 25.0% down · 7.5% · 30yr · 1.5% tax · 5.0% vac · 8.0% maint · 8.0% mgmt
Financing live
Cash to close
- Down payment
- $43,750
- Closing costs
- $5,250
- Reserves months
- —
- Total cash needed
- —
Loan-product check · same deal, 3 products live
Conventional
25% down · 7.5% · 30yr
- Down + closing
- —
- Monthly P&I
- —
- Monthly cashflow
- —
- DSCR
- —
- Eligible?
- —
Personal DTI + credit; lowest rate.
DSCR
20% down · 8.5% · 30yr
- Down + closing
- —
- Monthly P&I
- —
- Monthly cashflow
- —
- DSCR
- —
- Eligible?
- —
No personal income docs; deal must DSCR.
Hard money
10% down · 12.0% · 12mo
- Down + closing
- —
- Monthly P&I
- —
- Monthly cashflow
- —
- DSCR
- —
- Eligible?
- —
Short-term bridge; refi at stabilization.
Listing history 12 events
-
2026-06-13statusdays on market $175,000 Pending 23 DOM
-
2026-06-10days on market $175,000 Active 21 DOM
-
2026-06-09days on market $175,000 Active 20 DOM
-
2026-06-08days on market $175,000 Active 19 DOM
-
2026-06-07days on market $175,000 Active 18 DOM
-
2026-06-05days on market $175,000 Active 15 DOM
-
2026-06-02days on market $175,000 Active 13 DOM
-
2026-06-01days on market $175,000 Active 12 DOM
-
2026-05-31days on market $175,000 Active 11 DOM
-
2026-05-30days on market $175,000 Active 10 DOM
-
2026-05-20$175,000 Active
-
2010-07-23soldstatus $48,988
ⓘ Source: listings_history table (triggers on properties + properties_extension) + one-shot
backfill from property_details.listing_events for pre-trigger history.
Tax reassessment forecast LA · Resets to sale price
- Current annual tax
- $1,453 · $121/mo
- Projected year-2 tax
- $1,453 · $121/mo
- Expected delta
- $0/yr ($0/mo · -0.0%)
ⓘ Screening estimate from a state-policy table — verify with the county assessor before closing.
Climate risk First Street
- Flood 1/10 Low FEMA zone X (shaded) · 0% chance over 30 yrs
- Wildfire 1/10 Low
- Heat 8/10 Severe 7 d/yr ≥111°F today · 20 d/yr by 30 yrs out
- Wind 8/10 Severe 92% chance of damaging wind over 30 yrs
- Air quality 1/10 Low 0 unhealthy d/yr today · 0 by 30 yrs out
Nearby sold comps map
Loading sold comps map…
Walkable amenities ~0.75 mi
Loading nearby amenities…
Taxation est. · year 1
- Rental income
- $15,577
- − Mortgage interest
- −$9,803
- − Property taxes
- −$1,453
- − Insurance
- −$875
- − Repairs & maintenance
- −$1,246
- − Management
- −$1,246
- − Depreciation
- −$5,091
- Taxable loss
- −$4,137
- Est. tax savings @ 24.0%
- +$993
- After-tax cash flow
- $-42/yr
For passive investors: Depreciation is non-cash, so a rental often shows a tax loss while cash-flowing — sheltering income. Rental losses are passive: they offset passive income freely, and up to $25,000/yr can offset ordinary (W-2) income if you actively participate and your MAGI is under $100k (phasing out to $0 by $150k); unused losses carry forward. On sale, claimed depreciation is recaptured at up to 25%, and gains may owe capital-gains tax (a 1031 exchange can defer both). Figures are a year-1 estimate at your 24.0% rate — not tax advice; consult a CPA.
Schools (NCES district)
- District
- Grant Parish
- NCES district ID
- 2200690
- Math proficiency
- 27% ▼ -41.00%
- Reading proficiency
- 34% ▼ -40.00%
- Median HH income
- $39,458
- Composite
- 25.59/100
- National rank
- #7420
- State rank
- #43 of 98 in LA
Livability — Colfax
- Score
- 66/100
- State rank
- #122
- US rank
- #11590
Category grades
Schools grade is shown separately in the Schools card above.
Census & demographics
- Census place
- Colfax, LA
- Population (ZIP)
- 4,681
Population outlook (Grant County) Hauer SSP2
- Today (2025)
- 22,478 people
- By 2030
- 22,656 · +0.8%
- By 2040
- 22,488 · +0.0%
- By 2050
- 21,631 · -3.8%
- By 2075
- 18,569 · -17.4%
- By 2100
- 14,621 · -35.0%
Race, ethnicity, and origin ACS 2023
- Neighborhood character
- Predominantly White (65%)
- Race & ethnicity
- White 65% Black 30% Two or more races 3% Asian 2% Hispanic / Latino 1%
- Common ancestry
- Lithuanian 4% Slovak 1% Serbian 1%
- Foreign-born
- 2% · South Korea, China
- Languages at home
- 97% English-only · Chinese 2% French/Haitian/Cajun 0%
Political lean MEDSL · Grant
- 2024 margin
- Solid R (+76.8) · D 11.0% · R 87.9% · Other 1.1%
- 2008→2024 swing
- -13.4pp toward R · 2008: -63.5pp · 2024: -76.8pp
- All cycles
- 2024: R+76.8 2020: R+74.1 2016: R+70.6 2012: R+65.3 2008: R+63.5
Not yet ingested
- Civics
- —
Market trends
- HPI YoY
- ▲ 5.95%
- Current HPI
- 120.0524
- Rent YoY
- —
- Metro
- —
- State GDP YoY
- ▲ 3.29%
- F500 in state
- 10
Industry mix (Fortune 500 HQ in LA)
| Industry | F500 HQs | Revenue |
|---|---|---|
| Telecommunications | 2 | $23B |
|
||
| Utilities | 1 | $12B |
|
||
| Wholesale / Distribution | 1 | $5B |
|
||
| Advertising | 1 | $2B |
|
||
Price history
+257.2% since first listed2 events — show timeline
- 2026-05-20 Listed $175,000 AcadianaMLS
- 2010-07-23 Sold (Public Records) $48,988 Public Records
Property tax history
+0.8%/yrLatest (2025): $1,453 · -4.0% YoY. Source: county tax records.
Cash-flow waterfall
monthlySold comps — $/sqft
last 12 mo · ≤1 miLoading sold comps…