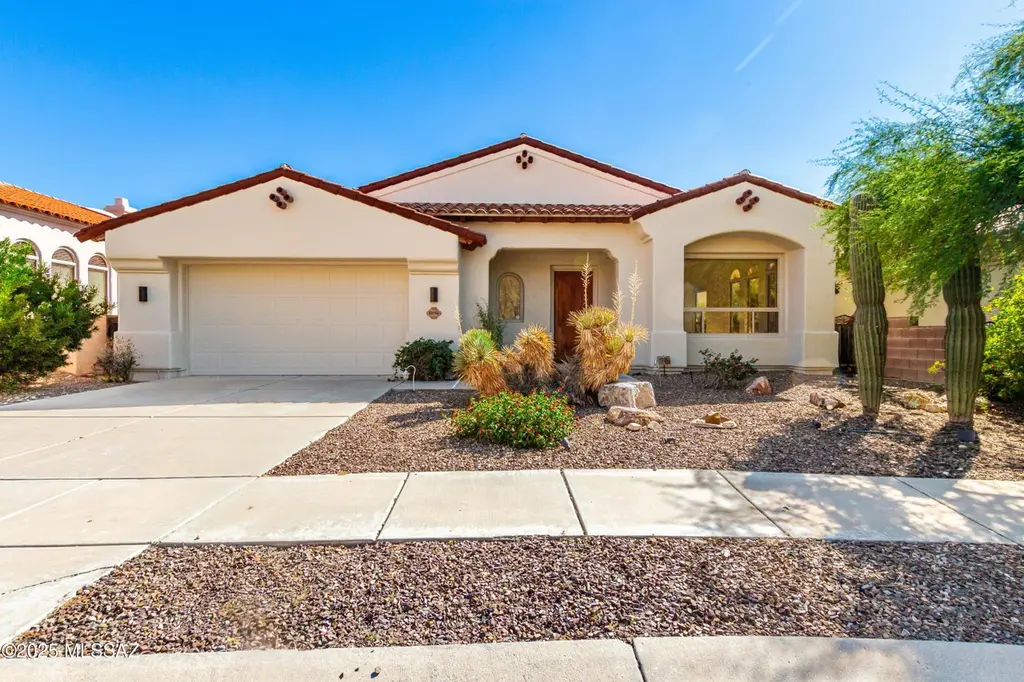
10094 E Stone Spring Pl · Tanque Verde, AZ
Flood risk 1/10 · Minimal
- FEMA flood zone
- X (unshaded)
- Chance of flooding over 30 yrs
- 0.0%
- Est. flood insurance / yr
- $507 – $1,088
Fire risk 6/10 · Moderate
- Est. fire insurance / yr
- $610 – $1,132
Heat risk 7/10 · Major
- Hot days now (above 106°F)
- 8 days/yr
- Hot days in 30 yrs
- 25 days/yr
Wind risk 1/10 · Minimal
- Chance of severe wind over 30 yrs
- —
Air-quality risk 1/10 · Minimal
- Unhealthy air days now
- 0 days/yr
- Unhealthy air days in 30 yrs
- 0 days/yr
Risk factors via First Street. Map © Google.
Why this score? — see what drove the D- grade
The composite is a weighted blend of 9 inputs, each scored 0–100. Each bar is that input's sub-score; the figure is the points it added to the 100-point composite (weight × sub-score).
- Cash flow +12.6/30.0
- ARV discount +9.6/15.0
- DSCR +3.8/10.0
- Rent growth +3.4/5.0
- Livability +3.1/5.0
- 1% rule +2.9/10.0
- Condition / age +2.5/5.0
- Schools +1.6/10.0
- Appreciation +0.0/10.0
$560,000
🖨 Deal sheet (PDF) 📄 Offer letter ✓ Due diligence
Listing remarks MLS
Nestled within one of Tucson's exclusive 24/7 guarded/gated golf communities, this impeccable home radiates sophistication and comfort. Soaring vaulted ceilings, dramatic archways, and an abundance of natural light create a bright, airy atmosphere throughout the open-concept design. The home features multiple bedroom en-suites, offering ultimate privacy and luxury for family or guests, and an additional room as a bedroom/den/office. Step outside and relax in the backyard oasis with an exposed wood beam patio and a perfectly sized spool flanked by desert landscaping. Last but not least, residents enjoy resort-caliber amenities including security, a sparkling community pool, elegant clubhouse, and access to Arizona National Golf Club.
Key facts
- Backyard oasis
- Elegant clubhouse
- Guard and gated
Tags
Neighborhood map
What this means for you Summary
Snapshot
- This is a 3-bed/3.0-bath single-family listed at $560k.
Deal economics
- At list price, monthly cash flow is $-68 ($-811/yr) — negative.
- To cash-flow at today's rent, offer at most $548k (2.1% below list).
- To meet the 1% rule (rent ≥ 1% of price), the offer needs to be $444k (20.6% below list).
- Recommended offer: $444k (20.6% below list) — sets the bar for 1% rule.
- Cap rate 6.1% vs local median 1.8% in Tanque Verde — top-decile yield for the area; either an underpriced asset or a hidden risk that comps aren't pricing in. Stress-test before assuming the spread holds.
Location & tenants
- Location reads 62/100 on livability (#140 in AZ) — a middle-class / working-renter tenant base. Strengths: employment A+, housing A+, crime A; Watch: amenities F, commute F, cost of living F.
- Tucson Unified District (4403) (urban): math 14% / reading 23% proficiency, ranked #190 of 249 in AZ (top 76%) — low school quality limits family demand, transient renter base, plan for 1-2y turnover.
- Zoned schools: Collier Elementary School (math 44% / reading 54%, grade D, #271 of 1,109 statewide, top 26%, 115 students, 44% FRL); Magee Middle School (math 13% / reading 25%, grade F, #139 of 218 statewide, top 64%, 350 students, 63% FRL); Sabino High School (math 27% / reading 37%, grade F, #104 of 381 statewide, top 28%, 862 students, 25% FRL) — zoned schools average 44% FRL vs 60% district-wide (16 pts lower); this property's tenant base skews higher-income than the district average.
- Zoned-school proficiency averages 34% at this address vs 18% district-wide (+15 pts) — the actual schools serving this property are materially stronger than the Tucson Unified District (4403) average implies; a family-tenant draw the district grade alone would hide.
- Market conditions: Rents rising (+3.5%/yr); 153 active listings in the ZIP; 3 comparable units currently listed for rent nearby; rentals leasing fast (median 0d on market — plan ~1-2 weeks tenant-placement turnaround); solid renter incomes; 5,268 units permitted in Pima County in 2024 (996 in 5+ unit buildings).
- At $4,445/mo this rent would consume 49% of the median local household income ($109k/yr) (locally 251% of renters already pay >50% of income on rent) — very limited rent-growth headroom before tenants either downsize or default.
Forward outlook
- Local home prices are declining (-3.0%/yr); year-one equity from $4k of loan paydown is wiped out by about $17k of value loss. Plan a longer hold.
- Pima County population projected at +8% by 2050 — modest demand growth; plan on rents tracking national, not racing it.
Negotiation context
- It's been on market 179 days — a 12% lower offer ($493k) is reasonable based on typical stale-listing flexibility.
- 6 sale attempts since 23y ago; this cycle's ask has dropped $80k (12%) from the opening price — seller is motivated, your offer sets the floor, not the list.
- Current owner paid $412k; 36% above their basis — modest negotiation headroom, anchor on the comps not their cost.
Risks & watch-outs
- Climate carrying-cost: major wildfire risk; extreme-heat days projected 8→25/yr by 2055 (HVAC capex compounding) — expect insurance premiums to compound above CPI over the hold.
Questions for the listing agent
- What do current leases actually rent for vs. the listed asking? Can we see a recent rent roll and the last 12 months of T-12 income?
- It's been on market 179 days. Have you received any prior offers? Is the seller open to a 21% concession, seller financing, or rate buy-down credit?
- Why hasn't it sold? Are there any deal-killer items the seller is aware of (foundation, flood, title, zoning, code violations)?
- Is there a deadline driving the sale (1031 exchange, divorce, estate, relocation)? That informs how much negotiation room exists.
- The area grade is low — what's the realistic commute time and amenity access for the typical tenant pool here? Any planned neighborhood developments (good or bad) we should know about?
- What's the average days-on-market for RENTAL listings here right now (not sales)? A rising rental-DOM trend means longer vacancies and softer asking-rent achievability than the comps imply.
- What's the recent tenant-quality profile in this submarket — average credit score on applications, eviction rate, late-payment / NSF rate, and stable-employment percentage? A property-management company in the area should have these aggregated.
- How much new for-sale + rental construction is in the pipeline within 1–3 miles? Heavy new supply typically softens prices + rents 12–24 months out; constrained supply supports both.
Investment metrics
- 1% rule
- 0.79% ✗
- Cap rate
- 6.15%
- Cash-on-cash
- -0.52%
- DSCR
- 0.98
- GRM
- 10.5
CMA / ARV
- ARV (median comp)
- $587,093
- List price
- $560,000
- Delta
- -4.61%
- Verdict
- FAIR
- Comps
- 20 within 1.0 mi
Show comp detail 12 sales within ~0.75 mi
| Address | Dist | Beds/Ba | Sqft | Sold | Price | $/sf | Match |
|---|---|---|---|---|---|---|---|
| 5362 N Ridge Spring Pl | 0.23mi | 4/3.0 (+1) | 2,587 (-0%) | 4mo | $634,000 | $245 | 80 |
| 5334 N Fairway Heights Dr | 0.26mi | 3/3.0 | 2,391 (-8%) | 1mo | $675,000 | $282 | 74 |
| 5259 N Fairway Heights Dr | 0.16mi | 3/2.5 | 2,371 (-9%) | 4mo | $698,000 | $294 | 73 |
| 5304 N Spring View Dr | 0.40mi | 3/3.0 | 2,809 (+8%) | 1mo | $498,000 | $177 | 67 |
| 5202 N Spring View Dr | 0.49mi | 3/3.0 | 2,374 (-8%) | 1mo | $475,000 | $200 | 62 |
| 5286 N Spring View Dr | 0.42mi | 4/3.0 (+1) | 2,367 (-9%) | 1mo | $600,000 | $253 | 60 |
| 10451 E Plumeria Rd | 0.59mi | 2/3.0 (-1) | 2,704 (+4%) | 2mo | $1,100,000 | $407 | 58 |
| 5331 N Spring Canyon Pl | 0.50mi | 3/2.5 | 2,373 (-8%) | 3mo | $644,420 | $272 | 58 |
| 9760 E Spring Ridge Pl | 0.46mi | 3/3.5 | 2,888 (+11%) | 1mo | $600,000 | $208 | 57 |
| 10030 E Sabino Estates Dr | 0.44mi | 3/3.0 | 2,959 (+14%) | 3mo | $1,470,000 | $497 | 54 |
| 9770 E Spring Hill Pl | 0.45mi | 4/3.0 (+1) | 2,885 (+11%) | 4mo | $490,000 | $170 | 52 |
| 9980 E Sabino Estates Dr | 0.45mi | 4/2.5 (+1) | 2,904 (+12%) | 2mo | $1,095,000 | $377 | 50 |
Match score weights: distance 35% · size 25% · config 20% · recency 20%. Top-matched comps best support the ARV.
Projected returns pro-forma
-3.0% appreciation · 3.47% rent growth · sell at horizon
- IRR
- -16.7%
- Equity multiple
- 0.41×
- Total profit
- $-93,050
- Equity at exit
- $83,498
- IRR
- -7.8%
- Equity multiple
- 0.50×
- Total profit
- $-78,276
- Equity at exit
- $48,419
Cash invested: $156,800 (down + closing). Projections, not guarantees.
Landlord ↔ Tenant lean methodology
- Overall (STATE)
- 87 Strongly Landlord-Friendly
- State Arizona
- 87 Strongly Landlord-Friendly · R+3
- County
- — inherits STATE
- City
- — inherits STATE
ZIP-level market 85749
- Rents YoY
- 3.5%
- Active inventory
- 153
- Price-to-rent
- 10.5×
Monthly cashflow live
- Estimated rent
- $4,445 medium interval (Pro) →
- Mortgage (P&I)
- −$2,937
- Tax from tax record
- −$409 /mo · $4,908/yr
- Insurance
- −$233
- HOA
- −$0
- Lot rent
- −$0
- Vacancy / Maint / Mgmt
- −$933
- Net cashflow
- $-68
Break-even live
Sensitivity live
| Price | -10% $249 | -5% $91 | +0% $-68 | +5% $-226 | +10% $-385 |
|---|---|---|---|---|---|
| Rent | -10% $-419 | -5% $-243 | +0% $-68 | +5% $108 | +10% $284 |
| Rate | -1.0pp $214 | -0.5pp $75 | base $-68 | +0.5pp $-213 | +1.0pp $-360 |
UW: 25.0% down · 7.5% · 30yr · 1.5% tax · 5.0% vac · 8.0% maint · 8.0% mgmt
Financing live
Cash to close
- Down payment
- $140,000
- Closing costs
- $16,800
- Reserves months
- —
- Total cash needed
- —
Loan-product check · same deal, 3 products live
Conventional
25% down · 7.5% · 30yr
- Down + closing
- —
- Monthly P&I
- —
- Monthly cashflow
- —
- DSCR
- —
- Eligible?
- —
Personal DTI + credit; lowest rate.
DSCR
20% down · 8.5% · 30yr
- Down + closing
- —
- Monthly P&I
- —
- Monthly cashflow
- —
- DSCR
- —
- Eligible?
- —
No personal income docs; deal must DSCR.
Hard money
10% down · 12.0% · 12mo
- Down + closing
- —
- Monthly P&I
- —
- Monthly cashflow
- —
- DSCR
- —
- Eligible?
- —
Short-term bridge; refi at stabilization.
Rent comps 3 comps
| Address | Beds | Baths | Sqft | Rent | $/sqft | DOM | Units | Dist |
|---|---|---|---|---|---|---|---|---|
| 5405 N Houghton Rd Tucson, AZ | 4.0 | 4.0 | 3500 | $7,400 | $2.11 | 0d | 1 | 0.35mi |
| 4750 N Bonanza Ave Tucson, AZ | 4.0 | 4.0 | 3300 | $3,900 | $1.18 | 0d | 1 | 0.59mi |
| 9431 E Walnut Tree Cir Tucson, AZ | 4.0 | 2.0 | 1974 | $2,700 | $1.37 | 18d | 1 | 0.95mi |
Listing history 24 events
-
2026-06-05days on market $560,000 Active 179 DOM
-
2026-06-03days on market $560,000 Active 178 DOM
-
2026-06-02days on market $560,000 Active 177 DOM
-
2026-06-01days on market $560,000 Active 176 DOM
-
2026-05-31days on market $560,000 Active 175 DOM
-
2026-04-11price $560,000 743-char remark
Show marketing remark (743 chars)
Nestled within one of Tucson's exclusive 24/7 guarded/gated golf communities, this impeccable home radiates sophistication and comfort. Soaring vaulted ceilings, dramatic archways, and an abundance of natural light create a bright, airy atmosphere throughout the open-concept design. The home features multiple bedroom en-suites, offering ultimate privacy and luxury for family or guests, and an additional room as a bedroom/den/office. Step outside and relax in the backyard oasis with an exposed wood beam patio and a perfectly sized spool flanked by desert landscaping. Last but not least, residents enjoy resort-caliber amenities including security, a sparkling community pool, elegant clubhouse, and access to Arizona National Golf Club.
-
2026-02-04price $575,000 743-char remark
Show marketing remark (743 chars)
Nestled within one of Tucson's exclusive 24/7 guarded/gated golf communities, this impeccable home radiates sophistication and comfort. Soaring vaulted ceilings, dramatic archways, and an abundance of natural light create a bright, airy atmosphere throughout the open-concept design. The home features multiple bedroom en-suites, offering ultimate privacy and luxury for family or guests, and an additional room as a bedroom/den/office. Step outside and relax in the backyard oasis with an exposed wood beam patio and a perfectly sized spool flanked by desert landscaping. Last but not least, residents enjoy resort-caliber amenities including security, a sparkling community pool, elegant clubhouse, and access to Arizona National Golf Club.
-
2025-12-07$640,000 Active 743-char remark
Show marketing remark (743 chars)
Nestled within one of Tucson's exclusive 24/7 guarded/gated golf communities, this impeccable home radiates sophistication and comfort. Soaring vaulted ceilings, dramatic archways, and an abundance of natural light create a bright, airy atmosphere throughout the open-concept design. The home features multiple bedroom en-suites, offering ultimate privacy and luxury for family or guests, and an additional room as a bedroom/den/office. Step outside and relax in the backyard oasis with an exposed wood beam patio and a perfectly sized spool flanked by desert landscaping. Last but not least, residents enjoy resort-caliber amenities including security, a sparkling community pool, elegant clubhouse, and access to Arizona National Golf Club.
-
2017-10-07historical
-
2017-06-28price $464,900
-
2017-04-11price $469,000
-
2017-02-24$479,000 Active
-
2010-09-20historical
-
2010-06-25$469,000
-
2005-06-29soldstatus $412,000
-
2005-06-28soldstatus $412,000
-
2005-05-17$418,000
-
2004-02-12soldstatus $319,000
-
2004-02-11soldstatus $319,000
-
2003-09-09$319,900
-
2003-09-09historical
-
2003-01-27$349,900
-
2000-01-19soldstatus $308,957
-
1998-12-29soldstatus $999,000
ⓘ Source: listings_history table (triggers on properties + properties_extension) + one-shot
backfill from property_details.listing_events for pre-trigger history.
Tax reassessment forecast AZ · Resets to sale price
- Current annual tax
- $4,908 · $409/mo
- Projected year-2 tax
- $4,908 · $409/mo
- Expected delta
- $0/yr ($0/mo · 0.0%)
ⓘ Screening estimate from a state-policy table — verify with the county assessor before closing.
Climate risk First Street
- Flood 1/10 Low FEMA zone X (unshaded) · 0% chance over 30 yrs
- Wildfire 6/10 Major
- Heat 7/10 Severe 8 d/yr ≥106°F today · 25 d/yr by 30 yrs out
- Wind 1/10 Low
- Air quality 1/10 Low 0 unhealthy d/yr today · 0 by 30 yrs out
Nearby sold comps map
Loading sold comps map…
Walkable amenities ~0.75 mi
Loading nearby amenities…
Taxation est. · year 1
- Rental income
- $53,339
- − Mortgage interest
- −$31,369
- − Property taxes
- −$4,908
- − Insurance
- −$2,800
- − Repairs & maintenance
- −$4,267
- − Management
- −$4,267
- − Depreciation
- −$16,291
- Taxable loss
- −$10,564
- Est. tax savings @ 24.0%
- +$2,535
- After-tax cash flow
- $1,724/yr
For passive investors: Depreciation is non-cash, so a rental often shows a tax loss while cash-flowing — sheltering income. Rental losses are passive: they offset passive income freely, and up to $25,000/yr can offset ordinary (W-2) income if you actively participate and your MAGI is under $100k (phasing out to $0 by $150k); unused losses carry forward. On sale, claimed depreciation is recaptured at up to 25%, and gains may owe capital-gains tax (a 1031 exchange can defer both). Figures are a year-1 estimate at your 24.0% rate — not tax advice; consult a CPA.
Schools (NCES district)
- District
- Tucson Unified District (4403)
- NCES district ID
- 0408800
- Math proficiency
- 14% ▼ -17.00%
- Reading proficiency
- 23% ▼ -11.00%
- Median HH income
- $40,962
- Composite
- 15.78/100
- National rank
- #9270
- State rank
- #190 of 249 in AZ
Livability — Tanque Verde
- Score
- 62/100
- State rank
- #140
- US rank
- #16884
Category grades
Schools grade is shown separately in the Schools card above.
Census & demographics
- Census place
- Tanque Verde, AZ
- County
- Pima County · 1,012,107 people
- City population
- 18,257
- Metro
- Tucson, AZ
- Population (ZIP)
- 18,843
- Household income
- $109,219
- Rent vs Own
- Severe rent burden
- 251.0
Population outlook (Pima County) Hauer SSP2
- Today (2025)
- 1,066,056 people
- By 2030
- 1,086,684 · +1.9%
- By 2040
- 1,117,160 · +4.8%
- By 2050
- 1,149,778 · +7.9%
- By 2075
- 1,271,480 · +19.3%
- By 2100
- 1,321,160 · +23.9%
Race, ethnicity, and origin ACS 2023
- Neighborhood character
- Predominantly White (76%)
- Race & ethnicity
- White 76% Hispanic / Latino 13% Two or more races 11% Asian 3% Black 1%
- Hispanic origin (detail)
- Mexican 11%
- Common ancestry
- Romanian 5% Italian 3% Lithuanian 3%
- Foreign-born
- 6% · Canada, China
- Languages at home
- 93% English-only · Spanish 5% German/W. Germanic 1%
Political lean MEDSL · Pima
- 2024 margin
- D (+15.2) · D 57.0% · R 41.8% · Other 1.2%
- 2008→2024 swing
- +9.1pp toward D · 2008: 6.1pp · 2024: 15.2pp
- All cycles
- 2024: D+15.2 2020: D+18.7 2016: D+13.5 2012: D+5.8 2008: D+6.1
Not yet ingested
- Civics
- —
Market trends
- HPI YoY
- ▼ -381.35%
- Current HPI
- 248.007
- Rent YoY
- ▲ 3.47%
- Metro
- Tucson, AZ
- State GDP YoY
- ▲ 4.54%
- F500 in state
- 20
Industry mix (Fortune 500 HQ in AZ)
| Industry | F500 HQs | Revenue |
|---|---|---|
| Technology | 2 | $13B |
|
||
| Mining / Metals | 1 | $23B |
|
||
| Environmental Services | 1 | $16B |
|
||
| Metals / Steel | 1 | $14B |
|
||
| Technology Distribution | 1 | $9B |
|
||
| Homebuilding | 1 | $8B |
|
||
Price history
-43.9% since first listed19 events — show timeline
- 2026-04-11 Price Changed $560,000 MLSSAZ
- 2026-02-04 Price Changed $575,000 MLSSAZ
- 2025-12-07 Listed $640,000 MLSSAZ
- 2017-10-07 Listing Removed — MLSSAZ
- 2017-06-28 Price Changed $464,900 MLSSAZ
- 2017-04-11 Price Changed $469,000 MLSSAZ
- 2017-02-24 Listed $479,000 MLSSAZ
- 2010-09-20 Listing Removed — MLSSAZ
- 2010-06-25 Listed $469,000 MLSSAZ
- 2005-06-29 Sold (MLS) $412,000 MLSSAZ
- 2005-06-28 Sold (Public Records) $412,000 Public Records
- 2005-05-17 Listed $418,000 MLSSAZ
- 2004-02-12 Sold (Public Records) $319,000 Public Records
- 2004-02-11 Sold (MLS) $319,000 MLSSAZ
- 2003-09-09 Listing Removed — MLSSAZ
- 2003-09-09 Listed $319,900 MLSSAZ
- 2003-01-27 Listed $349,900 MLSSAZ
- 2000-01-19 Sold (Public Records) $308,957 Public Records
- 1998-12-29 Sold (Public Records) $999,000 Public Records
Property tax history
+1.6%/yrLatest (2025): $4,908 · +4.5% YoY. Source: county tax records.
Cash-flow waterfall
monthlySold comps — $/sqft
last 12 mo · ≤1 miLoading sold comps…