14208 Lily Orchard Rd · Big Point, MS
Flood risk 1/10 · Minimal
- FEMA flood zone
- X (shaded)
- Chance of flooding over 30 yrs
- 0.0%
- Est. flood insurance / yr
- $507 – $1,088
Fire risk 9/10 · Severe
- Est. fire insurance / yr
- $1,241 – $2,305
Heat risk 9/10 · Severe
- Hot days now (above 106°F)
- 7 days/yr
- Hot days in 30 yrs
- 21 days/yr
Wind risk 9/10 · Severe
- Chance of severe wind over 30 yrs
- 99.0%
Air-quality risk 2/10 · Minimal
- Unhealthy air days now
- 1 days/yr
- Unhealthy air days in 30 yrs
- 2 days/yr
Risk factors via First Street. Map © Google.
Why this score? — see what drove the B- grade
The composite is a weighted blend of 9 inputs, each scored 0–100. Each bar is that input's sub-score; the figure is the points it added to the 100-point composite (weight × sub-score).
- Cash flow +28.4/30.0
- ARV discount +11.9/15.0
- DSCR +10.0/10.0
- 1% rule +6.7/10.0
- Schools +4.4/10.0
- Livability +3.1/5.0
- Rent growth +2.5/5.0
- Condition / age +2.5/5.0
- Appreciation +0.0/10.0
$112,000
🖨 Deal sheet 📄 Offer letter ✓ Due diligence
Listing remarks MLS
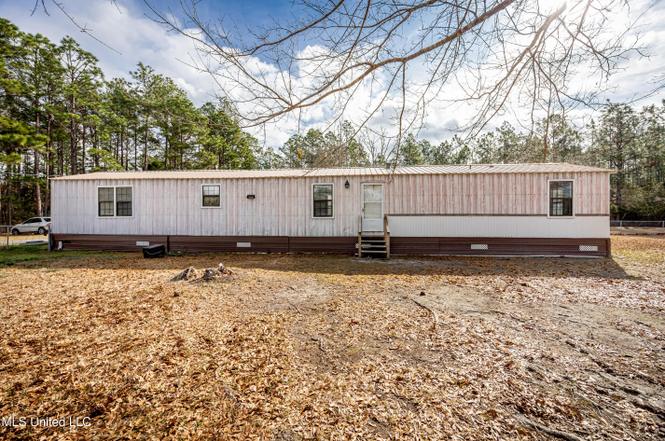
3/2 mobile home located on 2 acres of land! Renovated and move-in ready! Excellent rental for an investor and great opportunity for a new home buyer. Priced to sell!
Key facts
- Large soaking tub
- Bonus room
- Single carport
Tags
Neighborhood map
What this means for you Summary
Snapshot
- This is a 2-bed/2.0-bath manufactured listed at $112k.
Deal economics
- At list price, monthly cash flow is $361 ($4k/yr) — positive.
- The deal already cash-flows at list — no discount required.
- Meets the 1% rule at list price ($1k rent vs $112k).
- Recommended offer: $109k (3.0% below list) — sets the bar for market timing.
Location & tenants
- Location reads 62/100 on livability (#184 in MS) — a middle-class / working-renter tenant base. Strengths: crime A+, cost of living A+; Watch: health & safety D+, amenities F, commute F.
- Jackson County School District (rural): math 53% / reading 48% proficiency, ranked #10 of 130 in MS (top 8%) — acceptable for families but not a draw, mixed tenant base, ~2y average lease.
- Zoned schools: East Central Lower Elementary (576 students, 100% FRL); East Central Middle School (math 64% / reading 54%, grade B, #8 of 179 statewide, top 4%, 600 students, 100% FRL); East Central High School (math 52% / reading 53%, grade C-, #12 of 197 statewide, top 6%, 787 students, 100% FRL) — zoned schools average 100% FRL vs 50% district-wide (50 pts higher); higher-poverty schools than district average — tighter screening recommended.
- Market conditions: 109 active listings in the ZIP; 516 units permitted in Jackson County in 2024 (6 in 5+ unit buildings).
Forward outlook
- Local home prices are declining (-3.0%/yr); year-one equity from $774 of loan paydown is wiped out by about $3k of value loss. Plan a longer hold.
- At projected returns (-3.0% appreciation + 3.0% rent growth), your $31k cash investment doubles in ~9 years — after that, you're playing with house money.
Negotiation context
- It's been on market 52 days — a 3% lower offer ($109k) is reasonable based on typical stale-listing flexibility.
- 3 sale attempts since 4y ago with the ask held roughly flat each time — persistent listings suggest the price (not the market) is what's stuck; bring a comps-based counter.
Risks & watch-outs
- Climate carrying-cost: severe wind risk, 99% chance of damaging wind over 30y; severe wildfire risk; extreme-heat days projected 7→21/yr by 2055 (HVAC capex compounding) — expect insurance premiums to compound above CPI over the hold.
Questions for the listing agent
- It's been on market 52 days. Have you received any prior offers? Is the seller open to a 3% concession, seller financing, or rate buy-down credit?
- Is there a deadline driving the sale (1031 exchange, divorce, estate, relocation)? That informs how much negotiation room exists.
- Schools are F-rated, which usually means shorter tenancies and higher turnover. Who's the typical renter profile here, and what's been the actual vacancy rate?
- What's the average days-on-market for RENTAL listings here right now (not sales)? A rising rental-DOM trend means longer vacancies and softer asking-rent achievability than the comps imply.
- What's the recent tenant-quality profile in this submarket — average credit score on applications, eviction rate, late-payment / NSF rate, and stable-employment percentage? A property-management company in the area should have these aggregated.
- How much new for-sale + rental construction is in the pipeline within 1–3 miles? Heavy new supply typically softens prices + rents 12–24 months out; constrained supply supports both.
Investment metrics
- 1% rule
- 1.17% ✓
- Cap rate
- 10.16%
- Cash-on-cash
- 13.82%
- DSCR
- 1.62
- GRM
- 7.1
CMA / ARV
- ARV (on-the-fly)
- $124,032
- Comps found
- 1
Show comp detail 1 sale within ~0.75 mi
| Address | Dist | Beds/Ba | Sqft | Sold | Price | $/sf | Match |
|---|---|---|---|---|---|---|---|
| 14208 Lily Orchard Rd | 0.00mi | 2/2.0 | 1,100 (-10%) | 0mo | $112,000 | $102 | 84 |
Match score weights: distance 35% · size 25% · config 20% · recency 20%. Top-matched comps best support the ARV.
Projected returns pro-forma
-3.0% appreciation · 3.0% rent growth · sell at horizon
- IRR
- 4.0%
- Equity multiple
- 1.15×
- Total profit
- $4,820
- Equity at exit
- $16,700
- IRR
- 13.5%
- Equity multiple
- 2.07×
- Total profit
- $33,661
- Equity at exit
- $9,684
Cash invested: $31,360 (down + closing). Projections, not guarantees.
Landlord ↔ Tenant lean methodology
- Overall (STATE)
- 90 Strongly Landlord-Friendly
- State Mississippi
- 90 Strongly Landlord-Friendly · R+11
- County
- — inherits STATE
- City
- — inherits STATE
ZIP-level market 39562
- Home prices YoY
- -25.6%
- Active inventory
- 109
- Price-to-rent
- 7.1×
Monthly cashflow live
- Estimated rent
- $1,313 medium interval (Pro) →
- Mortgage (P&I)
- −$587
- Tax from tax record
- −$42 /mo · $504/yr
- Insurance
- −$47
- HOA
- −$0
- Vacancy / Maint / Mgmt
- −$276
- Net cashflow
- $361
Break-even live
UW: 25.0% down · 7.5% · 30yr · 1.5% tax · 5.0% vac · 8.0% maint · 8.0% mgmt
Financing live
Cash to close
- Down payment
- $28,000
- Closing costs
- $3,360
- Reserves months
- —
- Total cash needed
- —
Loan-product check · same deal, 3 products live
Conventional
25% down · 7.5% · 30yr
- Down + closing
- —
- Monthly P&I
- —
- Monthly cashflow
- —
- DSCR
- —
- Eligible?
- —
Personal DTI + credit; lowest rate.
DSCR
20% down · 8.5% · 30yr
- Down + closing
- —
- Monthly P&I
- —
- Monthly cashflow
- —
- DSCR
- —
- Eligible?
- —
No personal income docs; deal must DSCR.
Hard money
10% down · 12.0% · 12mo
- Down + closing
- —
- Monthly P&I
- —
- Monthly cashflow
- —
- DSCR
- —
- Eligible?
- —
Short-term bridge; refi at stabilization.
Listing history 11 events
-
2026-04-15status Pending
-
2026-04-03status Active
-
2026-04-01status Pending
-
2026-03-14price $112,000
-
2026-02-19$114,000 Active
-
2022-05-12soldstatus
-
2022-05-12soldstatus
-
2022-05-11soldstatus Closed 165-char remark
Show marketing remark (165 chars)
3/2 mobile home located on 2 acres of land! Renovated and move-in ready! Excellent rental for an investor and great opportunity for a new home buyer. Priced to sell!
-
2022-04-27status Pending 165-char remark
Show marketing remark (165 chars)
3/2 mobile home located on 2 acres of land! Renovated and move-in ready! Excellent rental for an investor and great opportunity for a new home buyer. Priced to sell!
-
2022-04-25price $67,500 165-char remark
Show marketing remark (165 chars)
3/2 mobile home located on 2 acres of land! Renovated and move-in ready! Excellent rental for an investor and great opportunity for a new home buyer. Priced to sell!
-
2022-04-13$69,900 Active 165-char remark
Show marketing remark (165 chars)
3/2 mobile home located on 2 acres of land! Renovated and move-in ready! Excellent rental for an investor and great opportunity for a new home buyer. Priced to sell!
ⓘ Source: listings_history table (triggers on properties + properties_extension) + one-shot
backfill from property_details.listing_events for pre-trigger history.
Tax reassessment forecast MS · Resets to sale price
- Current annual tax
- $504 · $42/mo
- Projected year-2 tax
- $885 · $74/mo
- Expected delta
- +$381/yr (+$32/mo · 75.7%)
ⓘ Screening estimate from a state-policy table — verify with the county assessor before closing.
Climate risk First Street
- Flood 1/10 Low FEMA zone X (shaded) · 0% chance over 30 yrs
- Wildfire 9/10 Extreme
- Heat 9/10 Extreme 7 d/yr ≥106°F today · 21 d/yr by 30 yrs out
- Wind 9/10 Extreme 99% chance of damaging wind over 30 yrs
- Air quality 2/10 Low 1 unhealthy d/yr today · 2 by 30 yrs out
Nearby sold comps map
Loading sold comps map…
Walkable amenities ~0.75 mi
Loading nearby amenities…
Taxation est. · year 1
- Rental income
- $15,756
- − Mortgage interest
- −$6,274
- − Property taxes
- −$504
- − Insurance
- −$560
- − Repairs & maintenance
- −$1,260
- − Management
- −$1,260
- − Depreciation
- −$3,258
- Taxable income
- $2,639
- Est. tax owed @ 24.0%
- −$633
- After-tax cash flow
- $3,702/yr
For passive investors: Depreciation is non-cash, so a rental often shows a tax loss while cash-flowing — sheltering income. Rental losses are passive: they offset passive income freely, and up to $25,000/yr can offset ordinary (W-2) income if you actively participate and your MAGI is under $100k (phasing out to $0 by $150k); unused losses carry forward. On sale, claimed depreciation is recaptured at up to 25%, and gains may owe capital-gains tax (a 1031 exchange can defer both). Figures are a year-1 estimate at your 24.0% rate — not tax advice; consult a CPA.
Schools (NCES district)
- District
- Jackson County School District
- NCES district ID
- 2802160
- Math proficiency
- 53% ▼ -5.00%
- Reading proficiency
- 48% ▼ -5.00%
- Median HH income
- $53,569
- Composite
- 43.57/100
- National rank
- #2980
- State rank
- #10 of 130 in MS
Livability — Big Point
- Score
- 62/100
- State rank
- #184
- US rank
- #17257
Category grades
Schools grade is shown separately in the Schools card above.
Census & demographics
- Population (ZIP)
- 17,142
Population outlook (Jackson County) Hauer SSP2
- Today (2025)
- 146,926 people
- By 2030
- 148,442 · +1.0%
- By 2040
- 149,631 · +1.8%
- By 2050
- 148,723 · +1.2%
- By 2075
- 147,845 · +0.6%
- By 2100
- 144,510 · -1.6%
Race, ethnicity, and origin ACS 2023
- Neighborhood character
- Predominantly White (89%)
- Race & ethnicity
- White 89% Black 6% Two or more races 2% Hispanic / Latino 2%
- Common ancestry
- Slovak 2% Italian 2% Lithuanian 2%
- Foreign-born
- 2% · Canada
- Languages at home
- 97% English-only · Spanish 2% Russian/Polish/Slavic 1%
Political lean MEDSL · Jackson
- 2024 margin
- Solid R (+39.9) · D 29.5% · R 69.4% · Other 1.1%
- 2008→2024 swing
- -6.4pp toward R · 2008: -33.5pp · 2024: -39.9pp
- All cycles
- 2024: R+39.9 2020: R+34.6 2016: R+39.9 2012: R+36.1 2008: R+33.5
Not yet ingested
- Civics
- —
Market trends
- HPI YoY
- ▼ -62.87%
- Current HPI
- 182.2784
- Rent YoY
- —
- Metro
- —
- State GDP YoY
- —
- F500 in state
- 0
Price history
+60.2% since first listed11 events — show timeline
- 2026-04-15 Pending — MLSU
- 2026-04-03 Relisted — MLSU
- 2026-04-01 Pending — MLSU
- 2026-03-14 Price Changed $112,000 MLSU
- 2026-02-19 Listed $114,000 MLSU
- 2022-05-12 Sold (Public Records) — Public Records
- 2022-05-12 Sold (Public Records) — Public Records
- 2022-05-11 Sold (MLS) — MLSU
- 2022-04-27 Pending — MLSU
- 2022-04-25 Price Changed $67,500 MLSU
- 2022-04-13 Listed $69,900 MLSU
Property tax history
+10.0%/yrLatest (2025): $504 · +16.4% YoY. Source: county tax records.
Cash-flow waterfall
monthlySold comps — $/sqft
last 12 mo · ≤1 miLoading sold comps…