 Triplex
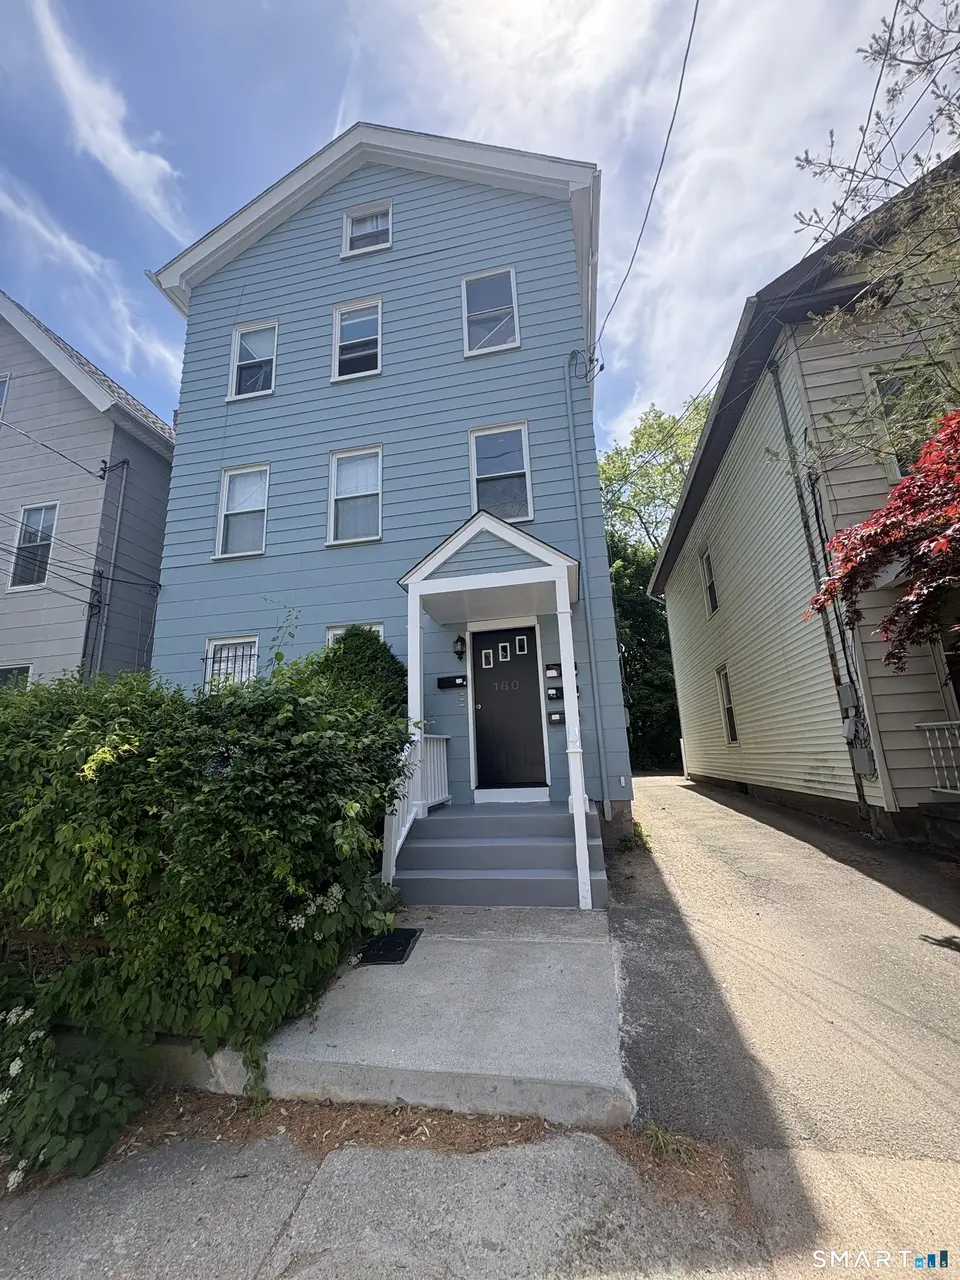
180 Willow St · New Haven, CT
Flood risk 1/10 · Minimal
- FEMA flood zone
- X (unshaded)
- Chance of flooding over 30 yrs
- 0.0%
- Est. flood insurance / yr
- $473 – $860
Fire risk 1/10 · Minimal
- Est. fire insurance / yr
- $829 – $1,539
Heat risk 6/10 · Moderate
- Hot days now (above 99°F)
- 7 days/yr
- Hot days in 30 yrs
- 16 days/yr
Wind risk 6/10 · Moderate
- Chance of severe wind over 30 yrs
- 61.0%
Air-quality risk 5/10 · Moderate
- Unhealthy air days now
- 6 days/yr
- Unhealthy air days in 30 yrs
- 8 days/yr
Risk factors via First Street. Map © Google.
Why this score? — see what drove the D+ grade
The composite is a weighted blend of 9 inputs, each scored 0–100. Each bar is that input's sub-score; the figure is the points it added to the 100-point composite (weight × sub-score).
- Cash flow +18.5/30.0
- ARV discount +7.5/15.0
- DSCR +5.8/10.0
- 1% rule +5.2/10.0
- Livability +4.0/5.0
- Rent growth +3.2/5.0
- Condition / age +2.5/5.0
- Schools +1.5/10.0
- Appreciation +0.0/10.0
$699,500
🖨 Deal sheet (PDF) 📄 Offer letter ✓ Due diligence
Multi-family units
County records classify this as Multi-Family (2-4 Unit). Listing-text estimate: 3 units. confirmed
Listing remarks MLS
Prime location rental property. 1St and 2nd floor recently renovated. Deep yardbehind parking. Shared driveway. Solid income. Walk to everything! Eligible foryale homebuyer program.
Key facts
- 3,484 sq ft lot
- 4 parking spots
- Built 1900
Property features AI
Exterior
- Parking: Parking lot and driveway; 4 total parking spaces
- Utilities: Public water connected; Public sewer connected; Natural gas domestic hot water
- Home design: Multi-family property (3-family); Multi-family for sale; Light blue exterior color; Shared paved asphalt driveway
- Construction: Frame, concrete and masonry construction; Brick/masonry foundation
- Exterior features: Asphalt shingle roof; Asbestos siding; Sidewalk; Fruit trees; Gutters; Garden area; Exterior lighting; City views; Treed, level lot; Walk to water
Interior
- Bedrooms: 7 bedrooms total
- Bathrooms: 3 full bathrooms
- Heating & cooling: Hot air heat; Natural gas hot water and heat
- Interior features: Thermostat(s); Window unit cooling; Programmable thermostat; Storm doors and storm windows; Full unfinished basement with interior access, concrete floor, storage, shared basement areas and a full hatchway
- Laundry & utility: Common laundry area in the basement
Neighborhood map
What this means for you Summary
Snapshot
- This is a 3 × 2-bed/1.0-bath units multifamily listed at $700k.
Deal economics
- At list price, monthly cash flow is $664 ($8k/yr) — positive. Per door: $221/mo.
- The deal already cash-flows at list — no discount required.
- Meets the 1% rule at list price ($7k rent vs $700k).
- Cap rate 7.4% vs local median 4.8% in New Haven — top-decile yield for the area; either an underpriced asset or a hidden risk that comps aren't pricing in. Stress-test before assuming the spread holds.
Location & tenants
- Location reads 79/100 on livability (#31 in CT, #2,190 nationally) — a middle-class / working-renter tenant base. Strengths: amenities A+, commute A+, health & safety A+; Watch: employment D, crime F.
- New Haven School District (urban): math 12% / reading 25% proficiency, ranked #147 of 153 in CT (top 96%) — low school quality limits family demand, transient renter base, plan for 1-2y turnover; 66% free/reduced lunch — lower-income household profile, screen leases tightly.
- Zoned schools: Worthington Hooker School (math 55% / reading 70%, grade B, #134 of 553 statewide, top 24%, 371 students, 25% FRL); Wilbur Cross High School (math 17% / reading 37%, grade F, #147 of 194 statewide, top 78%, 1,633 students, 76% FRL) — zoned schools average 50% FRL vs 66% district-wide (15 pts lower); this property's tenant base skews higher-income than the district average.
- Zoned-school proficiency averages 45% at this address vs 18% district-wide (+26 pts) — the actual schools serving this property are materially stronger than the New Haven School District average implies; a family-tenant draw the district grade alone would hide.
- Market conditions: Rents rising (+2.6%/yr); 137 active listings in the ZIP; 1 comparable units currently listed for rent nearby; 1,059 units permitted in South Central Connecticut Planning Region in 2024 (779 in 5+ unit buildings).
- At $7,113/mo this rent would consume 142% of the median local household income ($60k/yr) (locally 4999% of renters already pay >50% of income on rent) — very limited rent-growth headroom before tenants either downsize or default.
Forward outlook
- Local home prices are declining (-3.0%/yr); year-one equity from $5k of loan paydown is wiped out by about $21k of value loss. Plan a longer hold.
Negotiation context
- Only 1 days on market — expect competitive offers; lowballing is unlikely to land.
- 2 sale attempts since 26y ago; this cycle's ask is 268% above the opening price — seller raised mid-cycle; expect resistance to lowballs.
- Current owner paid $190k; list at $700k implies a 268% gain — meaningful room to come down on a strong offer.
Risks & watch-outs
- Watch-outs: built in 1900 — expect roof / HVAC / electrical / plumbing capex.
- Climate carrying-cost: major wind risk, 61% chance of damaging wind over 30y; extreme-heat days projected 7→16/yr by 2055 (HVAC capex compounding) — expect insurance premiums to compound above CPI over the hold.
Questions for the listing agent
- Can we see the unit-by-unit rent roll, current vacancy, and any below-market leases? What's the average tenancy length?
- What capital expenditures (roof, boiler, parking lot, exteriors) have been made in the last 5 years, and what's planned in the next 2?
- Built in 1900 — when were the roof, HVAC, electrical panel, plumbing, and water heater last replaced?
- Is there a deadline driving the sale (1031 exchange, divorce, estate, relocation)? That informs how much negotiation room exists.
- Schools are D-rated, which usually means shorter tenancies and higher turnover. Who's the typical renter profile here, and what's been the actual vacancy rate?
- Crime grade is F in this area — have there been break-ins, vandalism, or insurance claims at this property in the last 3 years? What carrier currently insures it and at what premium?
- The area grade is low — what's the realistic commute time and amenity access for the typical tenant pool here? Any planned neighborhood developments (good or bad) we should know about?
- What's the average days-on-market for RENTAL listings here right now (not sales)? A rising rental-DOM trend means longer vacancies and softer asking-rent achievability than the comps imply.
- What's the recent tenant-quality profile in this submarket — average credit score on applications, eviction rate, late-payment / NSF rate, and stable-employment percentage? A property-management company in the area should have these aggregated.
- How much new apartment / multifamily construction is in the pipeline within 1–3 miles? Heavy new supply (>2% of stock underway) typically softens rents 12–24 months out; light construction supports rent growth.
Investment metrics
- 1% rule
- 1.02% ✓
- Cap rate
- 7.43%
- Cash-on-cash
- 4.07%
- DSCR
- 1.18
- GRM
- 8.2
CMA / ARV
- ARV (on-the-fly)
- $414,932
- Comps found
- 6
Show comp detail 6 sales within ~0.75 mi
| Address | Dist | Beds/Ba | Sqft | Sold | Price | $/sf | Match |
|---|---|---|---|---|---|---|---|
| 76 Edwards St | 0.32mi | 7/3.0 (-1) | 3,077 (+8%) | 11mo | $925,000 | $301 | 57 |
| 1380 State St | 0.64mi | 7/3.0 (-1) | 3,101 (+9%) | 1mo | $415,000 | $134 | 49 |
| 549 Lombard St | 0.61mi | 8/3.0 | 3,135 (+10%) | 6mo | $350,000 | $112 | 49 |
| 590 Whitney Ave | 0.49mi | 9/3.0 (+1) | 3,103 (+9%) | 18mo | $799,000 | $257 | 42 |
| 485 East St | 0.61mi | 9/3.0 (+1) | 2,616 (-8%) | 15mo | $380,000 | $145 | 40 |
| 423 Blatchley Ave | 0.71mi | 9/3.0 (+1) | 2,540 (-11%) | 14mo | $370,000 | $146 | 32 |
Match score weights: distance 35% · size 25% · config 20% · recency 20%. Top-matched comps best support the ARV.
Projected returns pro-forma
-3.0% appreciation · 2.6% rent growth · sell at horizon
- IRR
- -10.4%
- Equity multiple
- 0.62×
- Total profit
- $-73,746
- Equity at exit
- $104,298
- IRR
- -1.6%
- Equity multiple
- 0.89×
- Total profit
- $-20,651
- Equity at exit
- $60,480
Cash invested: $195,860 (down + closing). Projections, not guarantees.
Landlord ↔ Tenant lean methodology
- Overall (STATE)
- 27 Tenant-Leaning
- State Connecticut
- 27 Tenant-Leaning · D+7
- County
- — inherits STATE
- City
- — inherits STATE
ZIP-level market 06511
- Home prices YoY
- -20.8%
- Rents YoY
- 2.6%
- Active inventory
- 137
- Price-to-rent
- 24.6×
Monthly cashflow live
- Estimated rent
- $7,113 high interval (Pro) →
- Mortgage (P&I)
- −$3,668
- Tax from tax record
- −$996 /mo · $11,950/yr
- Insurance
- −$291
- HOA
- −$0
- Vacancy / Maint / Mgmt
- −$1,494
- Net cashflow
- $664
Break-even live
Sensitivity live
| Price | -10% $1,060 | -5% $862 | +0% $664 | +5% $466 | +10% $268 |
|---|---|---|---|---|---|
| Rent | -10% $102 | -5% $383 | +0% $664 | +5% $945 | +10% $1,226 |
| Rate | -1.0pp $1,016 | -0.5pp $842 | base $664 | +0.5pp $482 | +1.0pp $298 |
3-unit breakdown (identical units grouped — click to expand)
| Units | Beds | Baths | Est. rent |
|---|---|---|---|
| 3× units | 2 | 1 | $7,113 |
| #1 | 2 | 1 | $2,371 |
| #2 | 2 | 1 | $2,371 |
| #3 | 2 | 1 | $2,371 |
| Total (3 units) | $7,113 | ||
UW: 25.0% down · 7.5% · 30yr · 1.5% tax · 5.0% vac · 8.0% maint · 8.0% mgmt
Financing live
Cash to close
- Down payment
- $174,875
- Closing costs
- $20,985
- Reserves months
- —
- Total cash needed
- —
Loan-product check · same deal, 3 products live
Conventional
25% down · 7.5% · 30yr
- Down + closing
- —
- Monthly P&I
- —
- Monthly cashflow
- —
- DSCR
- —
- Eligible?
- —
Personal DTI + credit; lowest rate.
DSCR
20% down · 8.5% · 30yr
- Down + closing
- —
- Monthly P&I
- —
- Monthly cashflow
- —
- DSCR
- —
- Eligible?
- —
No personal income docs; deal must DSCR.
Hard money
10% down · 12.0% · 12mo
- Down + closing
- —
- Monthly P&I
- —
- Monthly cashflow
- —
- DSCR
- —
- Eligible?
- —
Short-term bridge; refi at stabilization.
Rent comps 1 comps
| Address | Beds | Baths | Sqft | Rent | $/sqft | DOM | Units | Dist |
|---|---|---|---|---|---|---|---|---|
| 67 Edgewood Ave New Haven, CT | 7.0 | 2.5 | 2000 | $6,100 | $3.05 | 44d | 1 | 1.48mi |
Listing history 12 events
-
2026-06-19statusdays on market $699,500 Active 1 DOM
-
2026-06-18days on market $699,500 Coming Soon 13 DOM
-
2026-06-17days on market $699,500 Coming Soon 12 DOM
-
2026-06-16days on market $699,500 Coming Soon 11 DOM
-
2026-06-15days on market $699,500 Coming Soon 10 DOM
-
2026-06-14days on market $699,500 Coming Soon 8 DOM
-
2026-06-13days on market $699,500 Coming Soon 7 DOM
-
2026-06-10days on market $699,500 Coming Soon 5 DOM
-
2026-06-09days on market $699,500 Coming Soon 4 DOM
-
2026-06-08days on market $699,500 Coming Soon 3 DOM
-
2026-06-07remarks 691-char remark
-
2026-06-07$699,500 Coming Soon 2 DOM
ⓘ Source: listings_history table (triggers on properties + properties_extension) + one-shot
backfill from property_details.listing_events for pre-trigger history.
Tax reassessment forecast CT · Partial reset (capped growth)
- Current annual tax
- $11,950 · $996/mo
- Projected year-2 tax
- $13,460 · $1,122/mo
- Expected delta
- +$1,510/yr (+$126/mo · 12.6%)
ⓘ Screening estimate from a state-policy table — verify with the county assessor before closing.
Climate risk First Street
- Flood 1/10 Low FEMA zone X (unshaded) · 0% chance over 30 yrs
- Wildfire 1/10 Low
- Heat 6/10 Major 7 d/yr ≥99°F today · 16 d/yr by 30 yrs out
- Wind 6/10 Major 61% chance of damaging wind over 30 yrs
- Air quality 5/10 Major 6 unhealthy d/yr today · 8 by 30 yrs out
Nearby sold comps map
Loading sold comps map…
Walkable amenities ~0.75 mi
Loading nearby amenities…
Taxation est. · year 1
- Rental income
- $85,356
- − Mortgage interest
- −$39,183
- − Property taxes
- −$11,950
- − Insurance
- −$3,498
- − Repairs & maintenance
- −$6,828
- − Management
- −$6,828
- − Depreciation
- −$20,349
- Taxable loss
- −$3,280
- Est. tax savings @ 24.0%
- +$787
- After-tax cash flow
- $8,752/yr
For passive investors: Depreciation is non-cash, so a rental often shows a tax loss while cash-flowing — sheltering income. Rental losses are passive: they offset passive income freely, and up to $25,000/yr can offset ordinary (W-2) income if you actively participate and your MAGI is under $100k (phasing out to $0 by $150k); unused losses carry forward. On sale, claimed depreciation is recaptured at up to 25%, and gains may owe capital-gains tax (a 1031 exchange can defer both). Figures are a year-1 estimate at your 24.0% rate — not tax advice; consult a CPA.
Schools (NCES district)
- District
- New Haven School District
- NCES district ID
- 0902790
- Math proficiency
- 12% ▼ -10.00%
- Reading proficiency
- 25% ▼ -10.00%
- Median HH income
- $38,058
- Composite
- 15.48/100
- National rank
- #9308
- State rank
- #147 of 153 in CT
Livability — New Haven
- Score
- 79/100
- State rank
- #31
- US rank
- #2190
Category grades
Schools grade is shown separately in the Schools card above.
Census & demographics
- Census place
- New Haven, CT
- County
- New Haven County · 688,236 people
- City population
- 132,813
- Metro
- New Haven-Milford, CT
- Population (ZIP)
- 54,730
- Household income
- $59,969
- Rent vs Own
- Severe rent burden
- 4999.0
Population outlook (South Central Connecticut County) Hauer SSP2
- By 2040
- 608,362
Race, ethnicity, and origin ACS 2023
- Neighborhood character
- Highly diverse neighborhood (Simpson 0.73)
- Race & ethnicity
- Black 34% White 32% Hispanic / Latino 21% Two or more races 8% Asian 7%
- Hispanic origin (detail)
- Mexican 4% Puerto Rican 10% Dominican 2%
- Common ancestry
- Romanian 2% Lithuanian 1% Russian 1%
- Foreign-born
- 17% · Canada, China, South Korea
- Languages at home
- 74% English-only · Spanish 15% Chinese 3% Other Indo-European 2%
Political lean MEDSL · South Central Connecticut
- 2024 margin
- Strong D (+20.1) · D 59.0% · R 38.9% · Other 2.1%
- All cycles
- 2024: D+20.1
Not yet ingested
- Civics
- —
Market trends
- HPI YoY
- ▼ -86.05%
- Current HPI
- 328.1353
- Rent YoY
- ▲ 2.60%
- Metro
- New Haven-Milford, CT
- State GDP YoY
- ▲ 1.06%
- F500 in state
- 38
Industry mix (Fortune 500 HQ in CT)
| Industry | F500 HQs | Revenue |
|---|---|---|
| Industrial Machinery | 4 | $38B |
|
||
| Insurance | 3 | $71B |
|
||
| Financial Services | 2 | $25B |
|
||
| Transportation / Logistics | 2 | $18B |
|
||
| Healthcare | 1 | $247B |
|
||
| Telecommunications | 1 | $55B |
|
||
Price history
+284.3% since first listed7 events — show timeline
- 2026-06-05 Coming Soon $699,500 Smart MLS
- 2001-11-29 Sold (MLS) $190,000 Smart MLS
- 2001-08-21 Listed $189,900 Smart MLS
- 2000-12-29 Sold (MLS) $87,000 Smart MLS
- 2000-02-14 Listed $125,000 Smart MLS
- 1989-10-16 Sold (Public Records) $239,500 Public Records
- 1989-01-30 Sold (Public Records) $182,000 Public Records
Property tax history
+2.9%/yrLatest (2023): $11,950 · -6.4% YoY. Source: county tax records.
Cash-flow waterfall
monthlySold comps — $/sqft
last 12 mo · ≤1 miLoading sold comps…