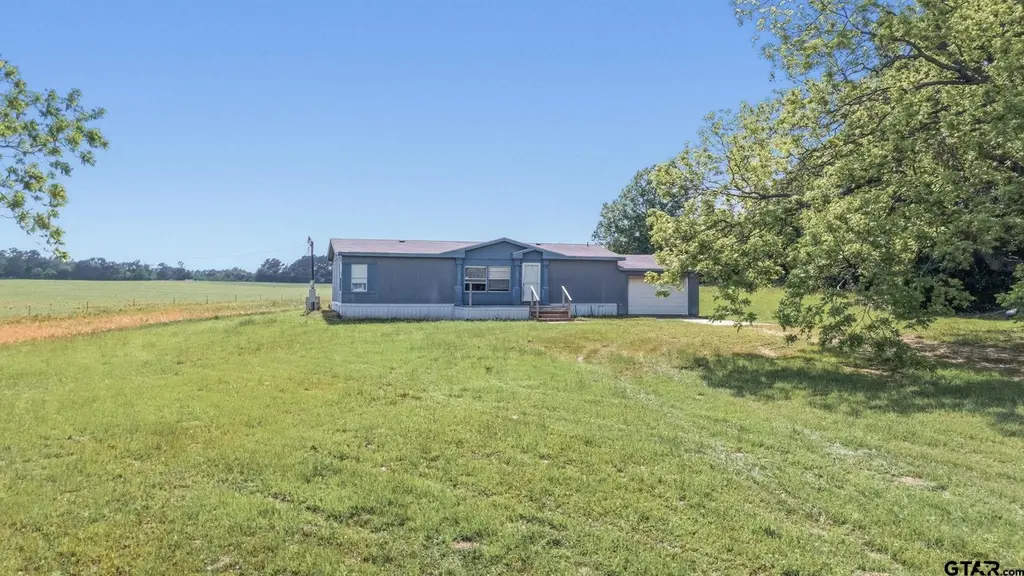
21550 Hwy 64 E · Arp, TX
Flood risk 1/10 · Minimal
- FEMA flood zone
- X (unshaded)
- Chance of flooding over 30 yrs
- 0.0%
- Est. flood insurance / yr
- $507 – $1,088
Fire risk 6/10 · Moderate
- Est. fire insurance / yr
- $1,222 – $2,270
Heat risk 7/10 · Major
- Hot days now (above 109°F)
- 7 days/yr
- Hot days in 30 yrs
- 25 days/yr
Wind risk 6/10 · Moderate
- Chance of severe wind over 30 yrs
- 67.0%
Air-quality risk 1/10 · Minimal
- Unhealthy air days now
- 0 days/yr
- Unhealthy air days in 30 yrs
- 0 days/yr
Risk factors via First Street. Map © Google.
Why this score? — see what drove the B+ grade
The composite is a weighted blend of 9 inputs, each scored 0–100. Each bar is that input's sub-score; the figure is the points it added to the 100-point composite (weight × sub-score).
- Cash flow +29.1/30.0
- DSCR +10.0/10.0
- Appreciation +10.0/10.0
- ARV discount +7.5/15.0
- 1% rule +6.8/10.0
- Schools +3.5/10.0
- Livability +3.5/5.0
- Rent growth +2.5/5.0
- Condition / age +2.5/5.0
$118,000
🖨 Deal sheet 📄 Offer letter ✓ Due diligence
Listing remarks
If you’ve been looking for land in East Texas, this one might be worth a second look. Sitting on just over 3 acres at 21550 Hwy 64 E, Arp, TX, this property offers the kind of space that’s getting harder to find at this price point. There’s an older mobile home on the property that could use some TLC, but the real value here is in the land. Whether you’re thinking investment, rental potential, or a spot to build or bring in something new… you’ve got options. The property is being sold as-is, cash or conventional loan only. If you are ready to invest in land in East Texas with all the potential in the world, this one is it! Call for more info.
Key facts
- Rental potential
- Over 3 acres
- Investment potential
Tags
Property features AI
Finance
- Other: Approximately 3.25 acres; Located in the Williams subdivision; Directions: From Tyler take Hwy 64 east toward Arp. Just before the bridge at Hwy 64 and Hwy 135 the property is on the right.
Exterior
- Home design: Single-story manufactured (mobile) home; Residential property
- Construction: Manufactured (mobile) construction
- Exterior features: Deck; Composition roof
Interior
- Kitchen: Electric oven; Electric range
- Flooring: Carpet
- Bathrooms: 2 full bathrooms
- Interior features: Ceiling fan(s); Central air conditioning; Central electric heating
Neighborhood map
What this means for you Summary
Snapshot
- This is a 3-bed/2.0-bath manufactured listed at $118k.
Deal economics
- At list price, monthly cash flow is $406 ($5k/yr) — positive.
- The deal already cash-flows at list — no discount required.
- Meets the 1% rule at list price ($1k rent vs $118k).
- Recommended offer: $116k (1.5% below list) — sets the bar for market timing.
Location & tenants
- Location reads 69/100 on livability (#442 in TX) — a middle-class / working-renter tenant base. Strengths: cost of living A+, housing A+, crime B+; Watch: employment D, amenities F, commute F.
- Arp ISD (rural): math 37% / reading 43% proficiency, ranked #400 of 826 in TX (top 48%) — families likely to look elsewhere, expect single-tenant / working-renter base with shorter leases.
- Zoned schools: Arp El (math 32% / reading 37%, grade F, #1,995 of 4,322 statewide, top 50%, 473 students, 60% FRL); Arp J H (math 30% / reading 45%, grade F, #736 of 1,662 statewide, top 45%, 219 students, 62% FRL); Arp H S (math 72% / reading 57%, grade B-, #199 of 1,632 statewide, top 14%, 293 students, 40% FRL) — zoned schools at 54% FRL track the district average.
- Market conditions: 61 active listings in the ZIP; 1 comparable units currently listed for rent nearby; 595 units permitted in Smith County in 2024 (45 in 5+ unit buildings).
Forward outlook
- In year one you build about $13k of equity ($816 loan paydown + $12k appreciation (10.0% local appreciation)).
- Smith County population projected at +24% by 2050 — long-run rental-demand tailwind backs the buy-and-hold thesis.
- At projected returns (10.0% appreciation + 3.0% rent growth), your $33k cash investment doubles in ~2 years — after that, you're playing with house money.
- By year 3, paydown + projected appreciation supports a ~$32k cash-out refi (75% LTV) — recoverable capital for the next deal without selling this one.
Negotiation context
- It's been on market 24 days — a 2% lower offer ($116k) is reasonable based on typical stale-listing flexibility.
Risks & watch-outs
- Climate carrying-cost: major wind risk, 67% chance of damaging wind over 30y; major wildfire risk; extreme-heat days projected 7→25/yr by 2055 (HVAC capex compounding) — expect insurance premiums to compound above CPI over the hold.
Questions for the listing agent
- Is there a deadline driving the sale (1031 exchange, divorce, estate, relocation)? That informs how much negotiation room exists.
- Schools are D-rated, which usually means shorter tenancies and higher turnover. Who's the typical renter profile here, and what's been the actual vacancy rate?
- What's the average days-on-market for RENTAL listings here right now (not sales)? A rising rental-DOM trend means longer vacancies and softer asking-rent achievability than the comps imply.
- What's the recent tenant-quality profile in this submarket — average credit score on applications, eviction rate, late-payment / NSF rate, and stable-employment percentage? A property-management company in the area should have these aggregated.
- How much new for-sale + rental construction is in the pipeline within 1–3 miles? Heavy new supply typically softens prices + rents 12–24 months out; constrained supply supports both.
Investment metrics
- 1% rule
- 1.18% ✓
- Cap rate
- 10.42%
- Cash-on-cash
- 14.74%
- DSCR
- 1.66
- GRM
- 7.0
CMA / ARV
No comps found within radius.
Projected returns pro-forma
10.0% appreciation · 3.0% rent growth · sell at horizon
- IRR
- 35.1%
- Equity multiple
- 3.73×
- Total profit
- $90,070
- Equity at exit
- $106,304
- IRR
- 30.3%
- Equity multiple
- 8.41×
- Total profit
- $244,804
- Equity at exit
- $229,248
Cash invested: $33,040 (down + closing). Projections, not guarantees.
Landlord ↔ Tenant lean methodology
- Overall (STATE)
- 87 Strongly Landlord-Friendly
- State Texas
- 87 Strongly Landlord-Friendly · R+5
- County
- — inherits STATE
- City
- — inherits STATE
ZIP-level market 75750
- Home prices YoY
- 12.3%
- Active inventory
- 61
- Price-to-rent
- 7.0×
Monthly cashflow live
- Estimated rent
- $1,395 medium interval (Pro) →
- Mortgage (P&I)
- −$619
- Tax from tax record
- −$28 /mo · $337/yr
- Insurance
- −$49
- HOA
- −$0
- Vacancy / Maint / Mgmt
- −$293
- Net cashflow
- $406
Break-even live
UW: 25.0% down · 7.5% · 30yr · 1.5% tax · 5.0% vac · 8.0% maint · 8.0% mgmt
Financing live
Cash to close
- Down payment
- $29,500
- Closing costs
- $3,540
- Reserves months
- —
- Total cash needed
- —
Loan-product check · same deal, 3 products live
Conventional
25% down · 7.5% · 30yr
- Down + closing
- —
- Monthly P&I
- —
- Monthly cashflow
- —
- DSCR
- —
- Eligible?
- —
Personal DTI + credit; lowest rate.
DSCR
20% down · 8.5% · 30yr
- Down + closing
- —
- Monthly P&I
- —
- Monthly cashflow
- —
- DSCR
- —
- Eligible?
- —
No personal income docs; deal must DSCR.
Hard money
10% down · 12.0% · 12mo
- Down + closing
- —
- Monthly P&I
- —
- Monthly cashflow
- —
- DSCR
- —
- Eligible?
- —
Short-term bridge; refi at stabilization.
Rent comps 1 comps
| Address | Beds | Baths | Sqft | Rent | $/sqft | DOM | Units | Dist |
|---|---|---|---|---|---|---|---|---|
| 109 Cook St #2 Arp, TX | 3.0 | 2.0 | 1098 | $1,395 | $1.27 | 13d | 1 | 1.33mi |
Listing history 2 events
-
2026-05-18status Pending 688-char remark
-
2026-04-24$118,000 Active 688-char remark
ⓘ Source: listings_history table (triggers on properties + properties_extension) + one-shot
backfill from property_details.listing_events for pre-trigger history.
Tax reassessment forecast TX · Resets to sale price
- Current annual tax
- $337 · $28/mo
- Projected year-2 tax
- $2,159 · $180/mo
- Expected delta
- +$1,822/yr (+$152/mo · 540.2%)
ⓘ Screening estimate from a state-policy table — verify with the county assessor before closing.
Climate risk First Street
- Flood 1/10 Low FEMA zone X (unshaded) · 0% chance over 30 yrs
- Wildfire 6/10 Major
- Heat 7/10 Severe 7 d/yr ≥109°F today · 25 d/yr by 30 yrs out
- Wind 6/10 Major 67% chance of damaging wind over 30 yrs
- Air quality 1/10 Low 0 unhealthy d/yr today · 0 by 30 yrs out
Nearby sold comps map
Loading sold comps map…
Walkable amenities ~0.75 mi
Loading nearby amenities…
Taxation est. · year 1
- Rental income
- $16,740
- − Mortgage interest
- −$6,610
- − Property taxes
- −$337
- − Insurance
- −$590
- − Repairs & maintenance
- −$1,339
- − Management
- −$1,339
- − Depreciation
- −$3,433
- Taxable income
- $3,092
- Est. tax owed @ 24.0%
- −$742
- After-tax cash flow
- $4,130/yr
For passive investors: Depreciation is non-cash, so a rental often shows a tax loss while cash-flowing — sheltering income. Rental losses are passive: they offset passive income freely, and up to $25,000/yr can offset ordinary (W-2) income if you actively participate and your MAGI is under $100k (phasing out to $0 by $150k); unused losses carry forward. On sale, claimed depreciation is recaptured at up to 25%, and gains may owe capital-gains tax (a 1031 exchange can defer both). Figures are a year-1 estimate at your 24.0% rate — not tax advice; consult a CPA.
Schools (NCES district)
- District
- Arp ISD
- NCES district ID
- 4808730
- Math proficiency
- 37% ▼ -10.00%
- Reading proficiency
- 43% ▼ -3.00%
- Median HH income
- $51,075
- Composite
- 34.58/100
- National rank
- #5165
- State rank
- #400 of 826 in TX
Livability — Arp
- Score
- 69/100
- State rank
- #442
- US rank
- #9054
Category grades
Schools grade is shown separately in the Schools card above.
Census & demographics
- Population (ZIP)
- 3,246
Population outlook (Smith County) Hauer SSP2
- Today (2025)
- 248,890 people
- By 2030
- 261,665 · +5.1%
- By 2040
- 286,114 · +15.0%
- By 2050
- 308,006 · +23.8%
- By 2075
- 354,171 · +42.3%
- By 2100
- 372,828 · +49.8%
Race, ethnicity, and origin ACS 2023
- Neighborhood character
- Predominantly White (81%)
- Race & ethnicity
- White 81% Two or more races 12% Black 5% Hispanic / Latino 3%
- Common ancestry
- Slovak 2% Portuguese 1% Iranian 1%
- Foreign-born
- 1% · Canada
- Languages at home
- 98% English-only · Spanish 1%
Political lean MEDSL · Smith
- 2024 margin
- Solid R (+45.1) · D 27.0% · R 72.1%
- 2008→2024 swing
- -5.6pp toward R · 2008: -39.5pp · 2024: -45.1pp
- All cycles
- 2024: R+45.1 2020: R+39.4 2016: R+43.9 2012: R+46.9 2008: R+39.5
Not yet ingested
- Civics
- —
Market trends
- HPI YoY
- ▲ 32.45%
- Current HPI
- 296.73
- Rent YoY
- —
- Metro
- —
- State GDP YoY
- ▲ 3.95%
- F500 in state
- 110
Industry mix (Fortune 500 HQ in TX)
| Industry | F500 HQs | Revenue |
|---|---|---|
| Energy | 16 | $1,198B |
|
||
| Technology | 5 | $198B |
|
||
| Engineering / Construction | 4 | $72B |
|
||
| Energy Services | 3 | $60B |
|
||
| Utilities | 3 | $41B |
|
||
| Healthcare | 2 | $330B |
|
||
Price history
3 events — show timeline
- 2026-06-04 Sold (MLS) — GTAR
- 2026-05-18 Pending — GTAR
- 2026-04-24 Listed $118,000 GTAR
Property tax history
-2.5%/yrLatest (2024): $337 · +11.3% YoY. Source: county tax records.
Cash-flow waterfall
monthlySold comps — $/sqft
last 12 mo · ≤1 miLoading sold comps…