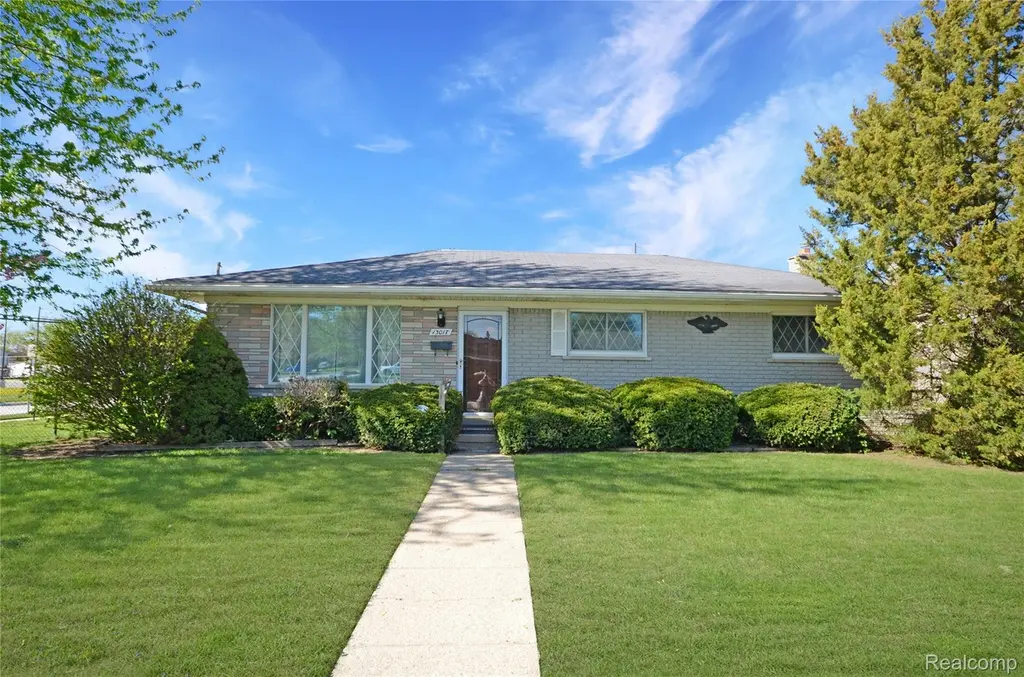
13017 Winona Dr · Sterling Heights, MI
Flood risk 1/10 · Minimal
- FEMA flood zone
- X (unshaded)
- Chance of flooding over 30 yrs
- 0.0%
- Est. flood insurance / yr
- $473 – $860
Fire risk 3/10 · Minor
- Est. fire insurance / yr
- $784 – $1,456
Heat risk 3/10 · Minor
- Hot days now (above 96°F)
- 7 days/yr
- Hot days in 30 yrs
- 15 days/yr
Wind risk 1/10 · Minimal
- Chance of severe wind over 30 yrs
- —
Air-quality risk 3/10 · Minor
- Unhealthy air days now
- 3 days/yr
- Unhealthy air days in 30 yrs
- 5 days/yr
Risk factors via First Street. Map © Google.
Why this score? — see what drove the D grade
The composite is a weighted blend of 9 inputs, each scored 0–100. Each bar is that input's sub-score; the figure is the points it added to the 100-point composite (weight × sub-score).
- ARV discount +15.0/15.0
- Cash flow +10.1/30.0
- Schools +4.1/10.0
- Livability +3.7/5.0
- DSCR +2.9/10.0
- 1% rule +2.8/10.0
- Rent growth +2.5/5.0
- Condition / age +2.5/5.0
- Appreciation +0.0/10.0
$257,000
🖨 Deal sheet (PDF) 📄 Offer letter ✓ Due diligence
Listing remarks MLS
This Sterling Heights brick ranch offers 3 bedrooms, 2 full bathrooms, and sits at a price point that opens the door to serious potential. Whether you're a first-time buyer or someone looking to build equity this home gives you a ton to work with. As you walk in, you're welcomed by the first of two living spaces right off the front door with original hardwood floors under the carpet. This home features three bedrooms, including a primary suite with its own private full bathroom. Heading into the back of the home, the kitchen, dining, and family room all connect making it a great setup for everyday living or entertaining. The family room is anchored by a natural fireplace perfect for those Michigan winters when you want to cozy up and relax. Downstairs, you've got a finished basement that gives you even more flexibility whether it's a rec room, home gym, office, or additional living space. If you're looking for a home with good bones, a great layout, amazing Utica school district and the opportunity to add your own style and value this is one you need to see in person.
Key facts
- 9,148 sq ft lot
- 2 garage spots
- Built 1969
Property features AI
Exterior
- Parking: Detached garage (2 spaces) with side-facing garage
- Utilities: Public water; Public sewer
- Home design: Single-family residence; One story; Ground-level entry with steps; Brick exterior
- Construction: Brick construction; One level
- Exterior features: Patio; Fenced backyard; Corner lot; Paved road access; Lot dimensions approximately 75 x 120 x 75 x 120
Interior
- Kitchen: Dishwasher; Free-standing electric oven; Free-standing refrigerator
- Bathrooms: Two full bathrooms
- Heating & cooling: Central air conditioning; Forced-air heating (natural gas)
- Interior features: Fireplace in family room (gas); Partially finished basement; Seven total rooms
Neighborhood map
What this means for you Summary
Snapshot
- This is a 3-bed/2.0-bath single-family listed at $257k.
Deal economics
- At list price, monthly cash flow is $-153 ($-2k/yr) — negative.
- To cash-flow at today's rent, offer at most $230k (10.5% below list).
- To meet the 1% rule (rent ≥ 1% of price), the offer needs to be $201k (22.0% below list).
- Recommended offer: $201k (22.0% below list) — sets the bar for 1% rule.
- Cap rate 5.6% vs local median 3.8% in Sterling Heights — top-decile yield for the area; either an underpriced asset or a hidden risk that comps aren't pricing in. Stress-test before assuming the spread holds.
Location & tenants
- Location reads 74/100 on livability (#173 in MI, #4,545 nationally) — a middle-class / working-renter tenant base. Strengths: commute A+, cost of living A+, housing A+; Watch: health & safety D+, amenities F.
- Utica Community Schools (suburban): math 38% / reading 53% proficiency, ranked #126 of 540 in MI (top 23%) — families likely to look elsewhere, expect single-tenant / working-renter base with shorter leases.
- Zoned schools: Dekeyser Elementary School (math 42% / reading 55%, grade D, #428 of 1,397 statewide, top 31%, 525 students, 48% FRL); Davis Junior High School (math 36% / reading 55%, grade D+, #161 of 493 statewide, top 33%, 728 students, 58% FRL); Adlai Stevenson High School (math 32% / reading 54%, grade F, #260 of 713 statewide, top 37%, 1,977 students, 55% FRL) — zoned schools average 54% FRL vs 26% district-wide (28 pts higher); higher-poverty schools than district average — tighter screening recommended.
- Market conditions: 163 active listings in the ZIP; 12 comparable units currently listed for rent nearby; rentals at typical pace (median 20d on market — plan ~3-4 weeks tenant-placement turnaround); 1,321 units permitted in Macomb County in 2024 (86 in 5+ unit buildings).
- This rent runs 35% of the median local income ($68k/yr) — at the standard rent-burdened threshold; future hikes will face affordability resistance.
Forward outlook
- Local home prices are declining (-3.0%/yr); year-one equity from $2k of loan paydown is wiped out by about $8k of value loss. Plan a longer hold.
- Macomb County population projected at +9% by 2050 — modest demand growth; plan on rents tracking national, not racing it.
Negotiation context
- Only 7 days on market — expect competitive offers; lowballing is unlikely to land.
- 2 sale attempts with the ask held roughly flat each time — persistent listings suggest the price (not the market) is what's stuck; bring a comps-based counter.
Questions for the listing agent
- What do current leases actually rent for vs. the listed asking? Can we see a recent rent roll and the last 12 months of T-12 income?
- Built in 1969 — when were the roof, HVAC, electrical panel, plumbing, and water heater last replaced?
- Is there a deadline driving the sale (1031 exchange, divorce, estate, relocation)? That informs how much negotiation room exists.
- The area grade is low — what's the realistic commute time and amenity access for the typical tenant pool here? Any planned neighborhood developments (good or bad) we should know about?
- What's the average days-on-market for RENTAL listings here right now (not sales)? A rising rental-DOM trend means longer vacancies and softer asking-rent achievability than the comps imply.
- What's the recent tenant-quality profile in this submarket — average credit score on applications, eviction rate, late-payment / NSF rate, and stable-employment percentage? A property-management company in the area should have these aggregated.
- How much new for-sale + rental construction is in the pipeline within 1–3 miles? Heavy new supply typically softens prices + rents 12–24 months out; constrained supply supports both.
Investment metrics
- 1% rule
- 0.78% ✗
- Cap rate
- 5.58%
- Cash-on-cash
- -2.55%
- DSCR
- 0.89
- GRM
- 10.7
CMA / ARV
- ARV (median comp)
- $323,625
- List price
- $257,000
- Delta
- -20.59%
- Verdict
- UNDERPRICED
- Comps
- 20 within 1.0 mi
Show comp detail 12 sales within ~0.75 mi
| Address | Dist | Beds/Ba | Sqft | Sold | Price | $/sf | Match |
|---|---|---|---|---|---|---|---|
| 13070 Picadilly Dr | 0.10mi | 3/1.5 | 1,330 (-2%) | 0mo | $347,900 | $262 | 90 |
| 13218 Picadilly Dr | 0.14mi | 3/1.5 | 1,330 (-2%) | 8mo | $299,999 | $226 | 82 |
| 13033 Plumbrook Rd | 0.23mi | 3/2.0 | 1,352 (0%) | 9mo | $290,000 | $214 | 81 |
| 13359 Picadilly Dr | 0.17mi | 3/2.0 | 1,452 (+7%) | 14mo | $313,000 | $216 | 68 |
| 12215 Fairview Dr | 0.52mi | 3/1.5 | 1,308 (-3%) | 1mo | $315,000 | $241 | 68 |
| 37611 Badger Dr | 0.56mi | 3/1.5 | 1,356 (+0%) | 8mo | $304,000 | $224 | 65 |
| 38568 Daytona Dr | 0.24mi | 3/2.0 | 1,452 (+7%) | 14mo | $280,000 | $193 | 65 |
| 38378 Littlefield Drive Dr | 0.33mi | 3/1.0 | 1,265 (-6%) | 11mo | $280,000 | $221 | 60 |
| 37653 Badger Dr | 0.53mi | 3/2.0 | 1,308 (-3%) | 13mo | $280,000 | $214 | 59 |
| 38382 Beecher Dr | 0.27mi | 3/2.0 | 1,178 (-13%) | 9mo | $300,000 | $255 | 58 |
| 37340 Castleton Dr | 0.67mi | 3/1.5 | 1,356 (+0%) | 15mo | $260,000 | $192 | 54 |
| 12129 Plumbrook Rd | 0.46mi | 4/1.5 (+1) | 1,494 (+10%) | 15mo | $290,000 | $194 | 41 |
Match score weights: distance 35% · size 25% · config 20% · recency 20%. Top-matched comps best support the ARV.
Projected returns pro-forma
-3.0% appreciation · 3.0% rent growth · sell at horizon
- IRR
- -20.5%
- Equity multiple
- 0.29×
- Total profit
- $-51,370
- Equity at exit
- $38,320
- IRR
- -13.7%
- Equity multiple
- 0.20×
- Total profit
- $-57,237
- Equity at exit
- $22,221
Cash invested: $71,960 (down + closing). Projections, not guarantees.
Landlord ↔ Tenant lean methodology
- Overall (STATE)
- 62 Landlord-Friendly
- State Michigan
- 62 Landlord-Friendly · EVEN
- County
- — inherits STATE
- City
- — inherits STATE
ZIP-level market 48312
- Active inventory
- 163
- Price-to-rent
- 10.7×
Monthly cashflow live
- Estimated rent
- $2,006 high interval (Pro) →
- Mortgage (P&I)
- −$1,348
- Tax from tax record
- −$283 /mo · $3,391/yr
- Insurance
- −$107
- HOA
- −$0
- Vacancy / Maint / Mgmt
- −$421
- Net cashflow
- $-153
Break-even live
Sensitivity live
| Price | -10% $-7 | -5% $-80 | +0% $-153 | +5% $-226 | +10% $-298 |
|---|---|---|---|---|---|
| Rent | -10% $-311 | -5% $-232 | +0% $-153 | +5% $-74 | +10% $6 |
| Rate | -1.0pp $-23 | -0.5pp $-87 | base $-153 | +0.5pp $-219 | +1.0pp $-287 |
UW: 25.0% down · 7.5% · 30yr · 1.5% tax · 5.0% vac · 8.0% maint · 8.0% mgmt
Financing live
Cash to close
- Down payment
- $64,250
- Closing costs
- $7,710
- Reserves months
- —
- Total cash needed
- —
Loan-product check · same deal, 3 products live
Conventional
25% down · 7.5% · 30yr
- Down + closing
- —
- Monthly P&I
- —
- Monthly cashflow
- —
- DSCR
- —
- Eligible?
- —
Personal DTI + credit; lowest rate.
DSCR
20% down · 8.5% · 30yr
- Down + closing
- —
- Monthly P&I
- —
- Monthly cashflow
- —
- DSCR
- —
- Eligible?
- —
No personal income docs; deal must DSCR.
Hard money
10% down · 12.0% · 12mo
- Down + closing
- —
- Monthly P&I
- —
- Monthly cashflow
- —
- DSCR
- —
- Eligible?
- —
Short-term bridge; refi at stabilization.
Rent comps 12 comps
| Address | Beds | Baths | Sqft | Rent | $/sqft | DOM | Units | Dist |
|---|---|---|---|---|---|---|---|---|
| 38177 Jamestown Dr Sterling Heights, MI | 3.0 | 2.0 | 1300 | $1,850 | $1.42 | 7d | 1 | 0.32mi |
| 13429 Denver Cir S Sterling Heights, MI | 3.0 | 1.5 | 1216 | $2,100 | $1.73 | 46d | 1 | 0.36mi |
| 38227 Schoenherr Rd Sterling Heights, MI | 2.0 | 1.5 | 1250 | $1,830 | $1.46 | 0d | 1 | 0.38mi |
| 39231 Bella Vista Dr Sterling Heights, MI | 3.0 | 1.5 | 1667 | $2,325 | $1.39 | 0d | 1 | 0.40mi |
| 37373 Clubhouse Dr Sterling Heights, MI | 2.0 | 1.5 | 1330 | $1,800 | $1.35 | 46d | 1 | 0.51mi |
| 14273 Shadywood Dr Sterling Heights, MI | 2.0 | 2.0 | 1373 | $2,100 | $1.53 | 46d | 1 | 1.01mi |
| 14357 Shadywood Dr Sterling Heights, MI | 2.0 | 2.0 | 1500 | $2,100 | $1.40 | 5d | 1 | 1.05mi |
| 13154 Boca Grande Dr Sterling Heights, MI | 3.0 | 2.0 | 1540 | $2,400 | $1.56 | 0d | 1 | 1.07mi |
| 12942 Montbatten Ct Sterling Heights, MI | 3.0 | 1.5 | 1612 | $2,600 | $1.61 | 20d | 1 | 1.10mi |
| 15329 Danseur Dr Unit 795 Clinton Twp, MI | 3.0 | 2.0 | 1056 | $1,549 | $1.47 | 5d | 1 | 1.42mi |
| 15353 Dominique Dr Unit 834 Clinton Township, MI | 3.0 | 2.0 | 1056 | $1,549 | $1.47 | 26d | 1 | 1.46mi |
| 15368 Dominique Dr Unit 868 Clinton Township, MI | 3.0 | 2.0 | 1056 | $1,549 | $1.47 | 46d | 1 | 1.48mi |
Listing history 3 events
-
2026-05-15$257,000 Active 1084-char remark
Show marketing remark (1084 chars)
This Sterling Heights brick ranch offers 3 bedrooms, 2 full bathrooms, and sits at a price point that opens the door to serious potential. Whether you're a first-time buyer or someone looking to build equity this home gives you a ton to work with. As you walk in, you're welcomed by the first of two living spaces right off the front door with original hardwood floors under the carpet. This home features three bedrooms, including a primary suite with its own private full bathroom. Heading into the back of the home, the kitchen, dining, and family room all connect making it a great setup for everyday living or entertaining. The family room is anchored by a natural fireplace perfect for those Michigan winters when you want to cozy up and relax. Downstairs, you've got a finished basement that gives you even more flexibility whether it's a rec room, home gym, office, or additional living space. If you're looking for a home with good bones, a great layout, amazing Utica school district and the opportunity to add your own style and value this is one you need to see in person.
-
2026-05-15$257,000 Active 1108-char remark
Show marketing remark (1084 chars)
This Sterling Heights brick ranch offers 3 bedrooms, 2 full bathrooms, and sits at a price point that opens the door to serious potential. Whether you're a first-time buyer or someone looking to build equity this home gives you a ton to work with. As you walk in, you're welcomed by the first of two living spaces right off the front door with original hardwood floors under the carpet. This home features three bedrooms, including a primary suite with its own private full bathroom. Heading into the back of the home, the kitchen, dining, and family room all connect making it a great setup for everyday living or entertaining. The family room is anchored by a natural fireplace perfect for those Michigan winters when you want to cozy up and relax. Downstairs, you've got a finished basement that gives you even more flexibility whether it's a rec room, home gym, office, or additional living space. If you're looking for a home with good bones, a great layout, amazing Utica school district and the opportunity to add your own style and value this is one you need to see in person.
-
2026-05-08historical $257,000 1084-char remark
Show marketing remark (1084 chars)
This Sterling Heights brick ranch offers 3 bedrooms, 2 full bathrooms, and sits at a price point that opens the door to serious potential. Whether you're a first-time buyer or someone looking to build equity this home gives you a ton to work with. As you walk in, you're welcomed by the first of two living spaces right off the front door with original hardwood floors under the carpet. This home features three bedrooms, including a primary suite with its own private full bathroom. Heading into the back of the home, the kitchen, dining, and family room all connect making it a great setup for everyday living or entertaining. The family room is anchored by a natural fireplace perfect for those Michigan winters when you want to cozy up and relax. Downstairs, you've got a finished basement that gives you even more flexibility whether it's a rec room, home gym, office, or additional living space. If you're looking for a home with good bones, a great layout, amazing Utica school district and the opportunity to add your own style and value this is one you need to see in person.
ⓘ Source: listings_history table (triggers on properties + properties_extension) + one-shot
backfill from property_details.listing_events for pre-trigger history.
Tax reassessment forecast MI · Partial reset (capped growth)
- Current annual tax
- $3,391 · $283/mo
- Projected year-2 tax
- $3,675 · $306/mo
- Expected delta
- +$283/yr (+$24/mo · 8.4%)
ⓘ Screening estimate from a state-policy table — verify with the county assessor before closing.
Climate risk First Street
- Flood 1/10 Low FEMA zone X (unshaded) · 0% chance over 30 yrs
- Wildfire 3/10 Moderate
- Heat 3/10 Moderate 7 d/yr ≥96°F today · 15 d/yr by 30 yrs out
- Wind 1/10 Low
- Air quality 3/10 Moderate 3 unhealthy d/yr today · 5 by 30 yrs out
Nearby sold comps map
Loading sold comps map…
Walkable amenities ~0.75 mi
Loading nearby amenities…
Taxation est. · year 1
- Rental income
- $24,070
- − Mortgage interest
- −$14,396
- − Property taxes
- −$3,391
- − Insurance
- −$1,285
- − Repairs & maintenance
- −$1,926
- − Management
- −$1,926
- − Depreciation
- −$7,476
- Taxable loss
- −$6,330
- Est. tax savings @ 24.0%
- +$1,519
- After-tax cash flow
- $-314/yr
For passive investors: Depreciation is non-cash, so a rental often shows a tax loss while cash-flowing — sheltering income. Rental losses are passive: they offset passive income freely, and up to $25,000/yr can offset ordinary (W-2) income if you actively participate and your MAGI is under $100k (phasing out to $0 by $150k); unused losses carry forward. On sale, claimed depreciation is recaptured at up to 25%, and gains may owe capital-gains tax (a 1031 exchange can defer both). Figures are a year-1 estimate at your 24.0% rate — not tax advice; consult a CPA.
Schools (NCES district)
- District
- Utica Community Schools
- NCES district ID
- 2634470
- Math proficiency
- 38% ▼ -13.00%
- Reading proficiency
- 53% ▼ -7.00%
- Median HH income
- $65,953
- Composite
- 40.52/100
- National rank
- #3709
- State rank
- #126 of 540 in MI
Livability — Sterling Heights
- Score
- 74/100
- State rank
- #173
- US rank
- #4545
Category grades
Schools grade is shown separately in the Schools card above.
Census & demographics
- Census place
- Sterling Heights, MI
- County
- Macomb County · 638,552 people
- City population
- 133,573
- Metro
- Detroit-Warren-Dearborn, MI
- Population (ZIP)
- 34,401
- Household income
- $68,061
- Rent vs Own
- Severe rent burden
- 910.0
Population outlook (Macomb County) Hauer SSP2
- Today (2025)
- 925,296 people
- By 2030
- 948,226 · +2.5%
- By 2040
- 983,961 · +6.3%
- By 2050
- 1,010,200 · +9.2%
- By 2075
- 1,076,222 · +16.3%
- By 2100
- 1,077,065 · +16.4%
Race, ethnicity, and origin ACS 2023
- Neighborhood character
- Predominantly White (75%)
- Race & ethnicity
- White 75% Black 9% Asian 9% Two or more races 5% Hispanic / Latino 3%
- Common ancestry
- Romanian 14% Arab 3% Lithuanian 2%
- Foreign-born
- 25% · Canada, China, Vietnam
- Languages at home
- 66% English-only · Other Indo-European 8% Arabic 8% Russian/Polish/Slavic 3%
Political lean MEDSL · Macomb
- 2024 margin
- R (+13.7) · D 42.2% · R 55.9% · Other 1.9%
- 2008→2024 swing
- -22.3pp toward R · 2008: 8.6pp · 2024: -13.7pp
- All cycles
- 2024: R+13.7 2020: R+8.1 2016: R+11.6 2012: D+4.0 2008: D+8.6
Not yet ingested
- Civics
- —
Market trends
- HPI YoY
- ▼ -279.41%
- Current HPI
- 203.3039
- Rent YoY
- —
- Metro
- Detroit-Warren-Dearborn, MI
- State GDP YoY
- ▲ 1.37%
- F500 in state
- 28
Industry mix (Fortune 500 HQ in MI)
| Industry | F500 HQs | Revenue |
|---|---|---|
| Automotive Parts | 3 | $48B |
|
||
| Automotive | 2 | $372B |
|
||
| Chemicals | 1 | $45B |
|
||
| Automotive Retail | 1 | $29B |
|
||
| Healthcare / Medical Devices | 1 | $23B |
|
||
| Automotive Technology | 1 | $20B |
|
||
Price history
+0.0% since first listed7 events — show timeline
- 2026-05-21 Pending — MiRealSource-MiMLS
- 2026-05-21 Pending — REALCOMP
- 2026-05-19 Contingent — MiRealSource-MiMLS
- 2026-05-19 Contingent — REALCOMP
- 2026-05-15 Listed $257,000 MiRealSource-MiMLS
- 2026-05-15 Listed $257,000 REALCOMP
- 2026-05-08 Coming Soon $257,000 MiRealSource-MiMLS
Property tax history
+3.9%/yrLatest (2025): $3,391 · +5.5% YoY. Source: county tax records.
Cash-flow waterfall
monthlySold comps — $/sqft
last 12 mo · ≤1 miLoading sold comps…