104 Levis Dr · Vincentown, NJ
Flood risk 9/10 · Severe
- FEMA flood zone
- X (shaded)
- Chance of flooding over 30 yrs
- 0.99%
- Est. flood insurance / yr
- $507 – $1,088
Fire risk 3/10 · Minor
- Est. fire insurance / yr
- $526 – $976
Heat risk 7/10 · Major
- Hot days now (above 104°F)
- 7 days/yr
- Hot days in 30 yrs
- 15 days/yr
Wind risk 6/10 · Moderate
- Chance of severe wind over 30 yrs
- 54.0%
Air-quality risk 4/10 · Minor
- Unhealthy air days now
- 5 days/yr
- Unhealthy air days in 30 yrs
- 7 days/yr
Risk factors via First Street. Map © Google.
Why this score? — see what drove the D- grade
The composite is a weighted blend of 9 inputs, each scored 0–100. Each bar is that input's sub-score; the figure is the points it added to the 100-point composite (weight × sub-score).
- Cash flow +13.3/30.0
- ARV discount +8.0/15.0
- DSCR +4.0/10.0
- Schools +3.4/10.0
- Rent growth +2.9/5.0
- 1% rule +2.7/10.0
- Livability +2.5/5.0
- Condition / age +2.5/5.0
- Appreciation +0.0/10.0
$435,000
🖨 Deal sheet 📄 Offer letter ✓ Due diligence
Listing remarks MLS
H. U. D. Owned Reo Being Sold "As-Is" With No Warranty As Top Condition Fha Case #351-321337 Submit All Bids Via Internet At Www. Firstpreston. Com Poss:Closing
Key facts
- Wooded backdrop
- Rear yard area
- 3 story townhome
Tags
Property features AI
Finance
- Other: Lease not considered
- HOA & community: Monthly HOA fee of $103; HOA covers all ground fee, common area maintenance, lawn maintenance, snow removal and trash; Association amenities include common grounds
Exterior
- Parking: Attached front-entry garage with 2 spaces; Concrete driveway; Two total garage/parking spaces
- Utilities: Public water; Public sewer; 100 amp electric service; Natural gas available; Electric available; Cable TV available; Phone available; Hot water: natural gas; Internet: cable
- Home design: Interior townhouse/rowhouse; Three floors in unit; Entry level is floor 1; Very good condition; Fee simple ownership
- Construction: Frame construction; Shingle and flat roof; Slab foundation; Replacement windows; Year built estimated
- Exterior features: Deck(s); Above-grade outdoor living structure
Interior
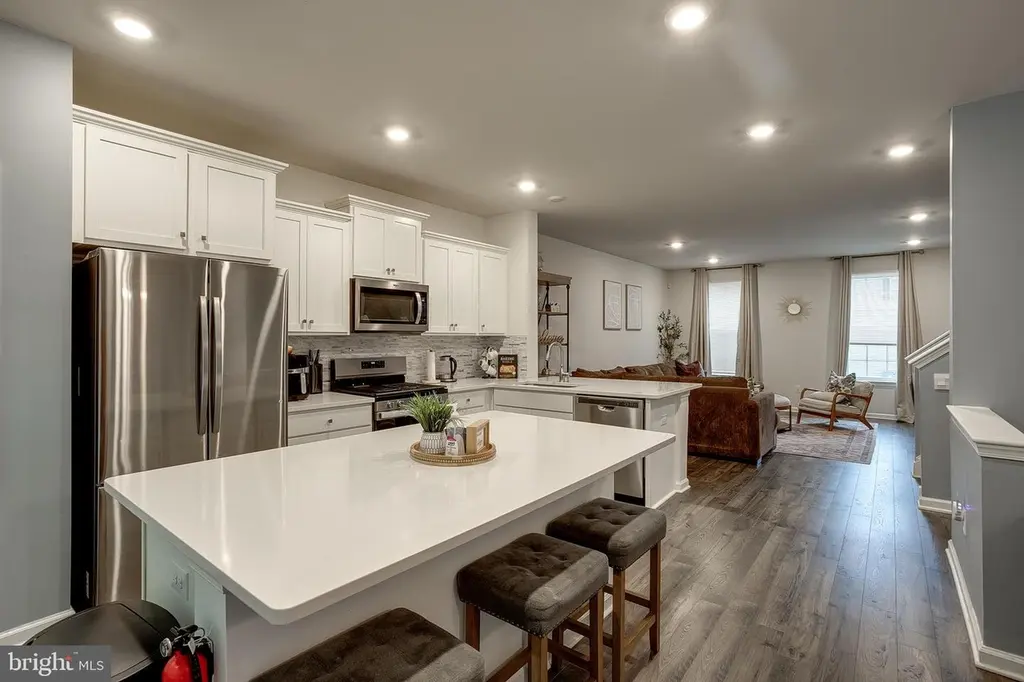
- Kitchen: Built-in range; Built-in microwave; Dishwasher; Refrigerator; Kitchen island
- Bedrooms: Three bedrooms on the first upper level; Rooms include: Master bedroom, Bedroom 2, Bedroom 3
- Flooring: Carpet; Luxury vinyl plank; Tile/brick flooring
- Bathrooms: Two full bathrooms on upper level; One half bathroom on main level; Two full bathrooms total, one half bathroom total
- Heating & cooling: Forced air heating (natural gas); Central air conditioning (natural gas)
- Interior features: Breakfast area; Combination kitchen/dining; Combination kitchen/living; Kitchen island; Master bath(s); Walk-in shower in bathroom; Tub/shower; Recessed lighting; Ceiling fans; Upgraded countertops; 9' or higher ceilings; Drywall walls/ceilings; Sliding glass door
- Laundry & utility: Washer; Dryer; Natural gas water heater
Neighborhood map
What this means for you Summary
Snapshot
- This is a 3-bed/2.5-bath townhouse listed at $435k.
Deal economics
- At list price, monthly cash flow is $-66 ($-787/yr) — negative.
- To cash-flow at today's rent, offer at most $423k (2.7% below list).
- To meet the 1% rule (rent ≥ 1% of price), the offer needs to be $335k (23.1% below list).
- Recommended offer: $335k (23.1% below list) — sets the bar for 1% rule.
- Cap rate 6.3% vs local median 4.5% in Vincentown — top-decile yield for the area; either an underpriced asset or a hidden risk that comps aren't pricing in. Stress-test before assuming the spread holds.
Location & tenants
- Location reads: area grade D — affects rentability + tenant quality, not the cash-flow math above.
- Rancocas Valley Regional High School District (suburban): math 29% / reading 49% proficiency, ranked #236 of 472 in NJ (top 50%) — families likely to look elsewhere, expect single-tenant / working-renter base with shorter leases.
- Zoned schools: Rancocas Valley Regional High School (math 29% / reading 49%, grade F, #197 of 399 statewide, top 51%, 1,981 students, 25% FRL).
- Market conditions: Rents rising (+1.4%/yr); 134 active listings in the ZIP; 11 comparable units currently listed for rent nearby; rentals leasing fast (median 1d on market — plan ~1-2 weeks tenant-placement turnaround); solid renter incomes; 2,161 units permitted in Burlington County in 2024 (988 in 5+ unit buildings).
- This rent runs 37% of the median local income ($109k/yr) — at the standard rent-burdened threshold; future hikes will face affordability resistance.
Forward outlook
- Local home prices are declining (-3.0%/yr); year-one equity from $3k of loan paydown is wiped out by about $13k of value loss. Plan a longer hold.
- Burlington County population projected to shrink 5% by 2050 — rents likely to lag national; underwrite the cash flow, not the appreciation.
Negotiation context
- It's been on market 27 days — a 2% lower offer ($428k) is reasonable based on typical stale-listing flexibility.
- 2 sale attempts since 27y ago with the ask held roughly flat each time — persistent listings suggest the price (not the market) is what's stuck; bring a comps-based counter.
Risks & watch-outs
- Watch-outs: flood insurance adds $66/mo.
- Climate carrying-cost: severe flood risk; major wind risk, 54% chance of damaging wind over 30y; extreme-heat days projected 7→15/yr by 2055 (HVAC capex compounding) — expect insurance premiums to compound above CPI over the hold.
Questions for the listing agent
- What do current leases actually rent for vs. the listed asking? Can we see a recent rent roll and the last 12 months of T-12 income?
- What's the actual annual flood-insurance premium (NFIP or private), and is the property in a SFHA with mandatory coverage?
- What does the HOA fee cover, when was the last increase, and are there any pending special assessments or reserve-fund shortfalls?
- Is there a deadline driving the sale (1031 exchange, divorce, estate, relocation)? That informs how much negotiation room exists.
- The area grade is low — what's the realistic commute time and amenity access for the typical tenant pool here? Any planned neighborhood developments (good or bad) we should know about?
- What's the average days-on-market for RENTAL listings here right now (not sales)? A rising rental-DOM trend means longer vacancies and softer asking-rent achievability than the comps imply.
- What's the recent tenant-quality profile in this submarket — average credit score on applications, eviction rate, late-payment / NSF rate, and stable-employment percentage? A property-management company in the area should have these aggregated.
- How much new for-sale + rental construction is in the pipeline within 1–3 miles? Heavy new supply typically softens prices + rents 12–24 months out; constrained supply supports both.
Investment metrics
- 1% rule
- 0.77% ✗
- Cap rate
- 6.30%
- Cash-on-cash
- 0.01%
- DSCR
- 1.00
- GRM
- 10.8
CMA / ARV
- ARV (on-the-fly)
- $439,704
- Comps found
- 12
Show comp detail 12 sales within ~0.75 mi
| Address | Dist | Beds/Ba | Sqft | Sold | Price | $/sf | Match |
|---|---|---|---|---|---|---|---|
| 102 Levis Dr | 0.01mi | 3/2.5 | 2,232 (0%) | 2mo | $440,000 | $197 | 98 |
| 108 Levis Dr | 0.01mi | 3/2.5 | 2,232 (0%) | 5mo | $450,000 | $202 | 95 |
| 16 Foundry Blvd | 0.19mi | 3/2.5 | 2,232 (0%) | 12mo | $462,200 | $207 | 82 |
| 32 Foundry Blvd | 0.19mi | 3/2.5 | 2,232 (0%) | 19mo | $470,000 | $211 | 76 |
| 1 Wallace Rd | 0.40mi | 3/2.5 | 2,350 (+5%) | 11mo | $439,900 | $187 | 64 |
| 7 Bishop Ln | 0.42mi | 3/2.5 | 2,200 (-1%) | 21mo | $395,000 | $180 | 61 |
| 8 Parkers Mill Blvd | 0.30mi | 3/2.5 | 2,021 (-10%) | 14mo | $435,000 | $215 | 58 |
| 50 Madison Ave | 0.52mi | 4/1.5 (+1) | 2,166 (-3%) | 13mo | $357,500 | $165 | 51 |
| 73 Madison Ave | 0.59mi | 3/1.5 | 1,954 (-12%) | 1mo | $327,500 | $168 | 47 |
| 119 Buttonwood St | 0.71mi | 4/2.5 (+1) | 2,197 (-2%) | 16mo | $290,000 | $132 | 46 |
| 12 Wallace Rd | 0.38mi | 3/2.5 | 1,900 (-15%) | 14mo | $425,000 | $224 | 46 |
| 48 Buttonwood St | 0.73mi | 4/1.5 (+1) | 2,022 (-9%) | 8mo | $272,000 | $135 | 35 |
Match score weights: distance 35% · size 25% · config 20% · recency 20%. Top-matched comps best support the ARV.
Projected returns pro-forma
-3.0% appreciation · 1.42% rent growth · sell at horizon
- IRR
- -19.0%
- Equity multiple
- 0.34×
- Total profit
- $-80,035
- Equity at exit
- $64,860
- IRR
- -14.8%
- Equity multiple
- 0.21×
- Total profit
- $-96,430
- Equity at exit
- $37,611
Cash invested: $121,800 (down + closing). Projections, not guarantees.
Landlord ↔ Tenant lean methodology
- Overall (STATE)
- 21 Tenant-Leaning
- State New Jersey
- 21 Tenant-Leaning · D+6
- County
- — inherits STATE
- City
- — inherits STATE
ZIP-level market 08060
- Home prices YoY
- -34.5%
- Rents YoY
- 1.4%
- Active inventory
- 134
- Price-to-rent
- 10.8×
Monthly cashflow live
- Estimated rent
- $3,347 high interval (Pro) →
- Mortgage (P&I)
- −$2,281
- Tax from tax record
- −$78 /mo · $936/yr
- Insurance
- −$181
- Flood insurance flood zone
- −$66 /mo · $798/yr
- HOA
- −$103
- Vacancy / Maint / Mgmt
- −$703
- Net cashflow
- $-66
Break-even live
UW: 25.0% down · 7.5% · 30yr · 1.5% tax · 5.0% vac · 8.0% maint · 8.0% mgmt
Financing live
Cash to close
- Down payment
- $108,750
- Closing costs
- $13,050
- Reserves months
- —
- Total cash needed
- —
Loan-product check · same deal, 3 products live
Conventional
25% down · 7.5% · 30yr
- Down + closing
- —
- Monthly P&I
- —
- Monthly cashflow
- —
- DSCR
- —
- Eligible?
- —
Personal DTI + credit; lowest rate.
DSCR
20% down · 8.5% · 30yr
- Down + closing
- —
- Monthly P&I
- —
- Monthly cashflow
- —
- DSCR
- —
- Eligible?
- —
No personal income docs; deal must DSCR.
Hard money
10% down · 12.0% · 12mo
- Down + closing
- —
- Monthly P&I
- —
- Monthly cashflow
- —
- DSCR
- —
- Eligible?
- —
Short-term bridge; refi at stabilization.
Rent comps 11 comps
| Address | Beds | Baths | Sqft | Rent | $/sqft | DOM | Units | Dist |
|---|---|---|---|---|---|---|---|---|
| 302 Barrington Ct Mt Holly, NJ | 1.0–3.0 | 1.0–2.5 | 1226 | $2,959 | $2.41 | 1d | 9 | 0.22mi |
| 10 Stanton Rd Mount Holly, NJ | 3.0 | 2.5 | 2208 | $3,300 | $1.49 | 1d | 1 | 0.22mi |
| 1 Kirby Ct Mt Holly, NJ | 1.0–3.0 | 1.0–2.5 | 1349 | $3,125 | $2.32 | 1d | 12 | 0.38mi |
| 610 Ogden Dr Westampton, NJ | 4.0 | 2.0 | 2370 | $4,200 | $1.77 | 22d | 1 | 0.42mi |
| 144 Washington St Unit C Mt Holly, NJ | 3.0 | 1.0 | 1450 | $2,370 | $1.63 | 15d | 1 | 0.44mi |
| 64 Regency Dr Mt Holly, NJ | 1.0–3.0 | 1.0–2.0 | 1066 | $2,800 | $2.63 | 1d | 1 | 0.47mi |
| 502 Bloomfield Dr Westampton, NJ | 4.0 | 3.0 | 1666 | $4,950 | $2.97 | 1d | 1 | 0.65mi |
| 501 Bloomfield Dr Westampton, NJ | 4.0 | 2.0 | 1975 | $4,950 | $2.51 | 1d | 1 | 0.66mi |
| 37 Church St Mount Holly, NJ | 3.0 | 1.5 | 1900 | $2,370 | $1.25 | 10d | 1 | 0.74mi |
| 209 Front St Mount Holly, NJ | 4.0 | 2.5 | 1500 | $4,950 | $3.30 | 1d | 1 | 0.98mi |
| 151 Rambling Rd Lumberton, NJ | 4.0 | 2.5 | 3000 | $5,495 | $1.83 | 16d | 1 | 1.41mi |
HOA detail
- Monthly dues
- $103 · $1,236/yr
- Likely covers
- internet
Listing history 20 events
-
2026-06-18days on market $435,000 Active 27 DOM
-
2026-06-17days on market $435,000 Active 26 DOM
-
2026-06-16days on market $435,000 Active 25 DOM
-
2026-06-15days on market $435,000 Active 24 DOM
-
2026-06-13days on market $435,000 Active 22 DOM
-
2026-06-13days on market $435,000 Active 21 DOM
-
2026-06-09days on market $435,000 Active 18 DOM
-
2026-06-08pricedays on market $435,000 Active 17 DOM
-
2026-06-07days on market $440,000 Active 16 DOM
-
2026-06-04days on market $440,000 Active 13 DOM
-
2026-06-03days on market $440,000 Active 12 DOM
-
2026-06-02days on market $440,000 Active 11 DOM
-
2026-06-01days on market $440,000 Active 10 DOM
-
2026-05-31days on market $440,000 Active 9 DOM
-
2026-05-22$440,000 Active
-
2022-01-14soldstatus $600,000
-
2021-06-14soldstatus $518,000
-
2021-06-14soldstatus $2,000,000
-
2000-06-09soldstatus $11,000 170-char remark
Show marketing remark (170 chars)
H. U. D. Owned Reo Being Sold "As-Is" With No Warranty As Top Condition Fha Case #351-321337 Submit All Bids Via Internet At Www. Firstpreston. Com Poss:Closing
-
1999-11-25$11,000 170-char remark
Show marketing remark (170 chars)
H. U. D. Owned Reo Being Sold "As-Is" With No Warranty As Top Condition Fha Case #351-321337 Submit All Bids Via Internet At Www. Firstpreston. Com Poss:Closing
ⓘ Source: listings_history table (triggers on properties + properties_extension) + one-shot
backfill from property_details.listing_events for pre-trigger history.
Tax reassessment forecast NJ · Partial reset (capped growth)
- Current annual tax
- $936 · $78/mo
- Projected year-2 tax
- $5,884 · $490/mo
- Expected delta
- +$4,948/yr (+$412/mo · 528.8%)
ⓘ Screening estimate from a state-policy table — verify with the county assessor before closing.
Climate risk First Street
- Flood 9/10 Extreme FEMA zone X (shaded) · 99% chance over 30 yrs
- Wildfire 3/10 Moderate
- Heat 7/10 Severe 7 d/yr ≥104°F today · 15 d/yr by 30 yrs out
- Wind 6/10 Major 54% chance of damaging wind over 30 yrs
- Air quality 4/10 Moderate 5 unhealthy d/yr today · 7 by 30 yrs out
Nearby sold comps map
Loading sold comps map…
Walkable amenities ~0.75 mi
Loading nearby amenities…
Taxation est. · year 1
- Rental income
- $40,167
- − Mortgage interest
- −$24,367
- − Property taxes
- −$936
- − Insurance
- −$2,972
- − Repairs & maintenance
- −$3,213
- − Management
- −$3,213
- − HOA
- −$1,236
- − Depreciation
- −$12,655
- Taxable loss
- −$8,425
- Est. tax savings @ 24.0%
- +$2,022
- After-tax cash flow
- $1,235/yr
For passive investors: Depreciation is non-cash, so a rental often shows a tax loss while cash-flowing — sheltering income. Rental losses are passive: they offset passive income freely, and up to $25,000/yr can offset ordinary (W-2) income if you actively participate and your MAGI is under $100k (phasing out to $0 by $150k); unused losses carry forward. On sale, claimed depreciation is recaptured at up to 25%, and gains may owe capital-gains tax (a 1031 exchange can defer both). Figures are a year-1 estimate at your 24.0% rate — not tax advice; consult a CPA.
Schools (NCES district)
- District
- Rancocas Valley Regional High School District
- NCES district ID
- 3413620
- Math proficiency
- 29% ▼ -18.00%
- Reading proficiency
- 49% ▼ -4.00%
- Median HH income
- $58,992
- Composite
- 34.45/100
- National rank
- #5195
- State rank
- #236 of 472 in NJ
Livability — Vincentown
No livability data for this city. (Only ~50 U.S. cities are tracked.)
Census & demographics
- County
- Burlington County · 323,710 people
- Metro
- Philadelphia-Camden-Wilmington, PA-NJ-DE-MD
- Population (ZIP)
- 25,835
- Household income
- $109,292
- Rent vs Own
- Severe rent burden
- 562.0
Population outlook (Burlington County) Hauer SSP2
- Today (2025)
- 453,425 people
- By 2030
- 452,359 · -0.2%
- By 2040
- 445,033 · -1.9%
- By 2050
- 431,760 · -4.8%
- By 2075
- 406,277 · -10.4%
- By 2100
- 364,732 · -19.6%
Race, ethnicity, and origin ACS 2023
- Neighborhood character
- Diverse neighborhood (Simpson 0.68)
- Race & ethnicity
- White 49% Black 25% Two or more races 15% Hispanic / Latino 13% Asian 4%
- Hispanic origin (detail)
- Mexican 2% Puerto Rican 7%
- Common ancestry
- Romanian 4% Lithuanian 2% Italian 1%
- Foreign-born
- 11% · Canada, Dominican Republic, China
- Languages at home
- 87% English-only · Spanish 7% Other Indo-European 2% French/Haitian/Cajun 1%
Political lean MEDSL · Burlington
- 2024 margin
- D (+16.6) · D 57.6% · R 41.0% · Other 1.3%
- 2008→2024 swing
- -2.0pp toward R · 2008: 18.6pp · 2024: 16.6pp
- All cycles
- 2024: D+16.6 2020: D+19.5 2016: D+14.8 2012: D+18.7 2008: D+18.6
Not yet ingested
- Civics
- —
Market trends
- HPI YoY
- ▼ -156.50%
- Current HPI
- 296.564
- Rent YoY
- ▲ 1.42%
- Metro
- Philadelphia-Camden-Wilmington, PA-NJ-DE-MD
- State GDP YoY
- ▲ 2.05%
- F500 in state
- 34
Industry mix (Fortune 500 HQ in NJ)
| Industry | F500 HQs | Revenue |
|---|---|---|
| Consumer Goods | 3 | $31B |
|
||
| Pharmaceuticals | 2 | $153B |
|
||
| Technology | 2 | $21B |
|
||
| Insurance | 2 | $20B |
|
||
| Healthcare | 2 | $19B |
|
||
| Financial Services | 1 | $70B |
|
||
Price history
+3900.0% since first listed6 events — show timeline
- 2026-05-22 Listed $440,000 BRIGHT MLS
- 2022-01-14 Sold (Public Records) $600,000 Public Records
- 2021-06-14 Sold (Public Records) $2,000,000 Public Records
- 2021-06-14 Sold (Public Records) $518,000 Public Records
- 2000-06-09 Sold (MLS) $11,000 BRIGHT MLS
- 1999-11-25 Listed $11,000 BRIGHT MLS
Property tax history
+4.9%/yrLatest (2025): $936 · +6.6% YoY. Source: county tax records.
Cash-flow waterfall
monthlySold comps — $/sqft
last 12 mo · ≤1 miLoading sold comps…