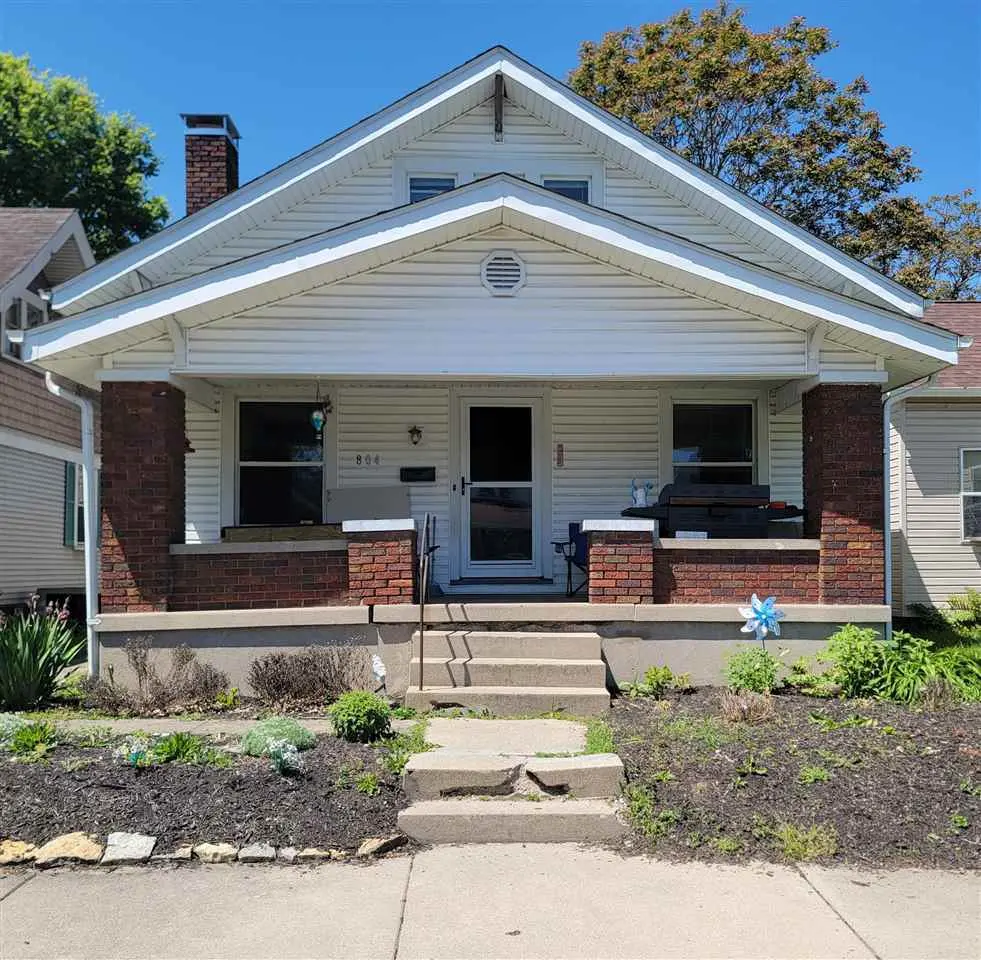
804 S 10th St · Richmond, IN
Flood risk 1/10 · Minimal
- FEMA flood zone
- X (unshaded)
- Chance of flooding over 30 yrs
- 0.0%
- Est. flood insurance / yr
- $507 – $1,088
Fire risk 1/10 · Minimal
- Est. fire insurance / yr
- $717 – $1,331
Heat risk 3/10 · Minor
- Hot days now (above 100°F)
- 7 days/yr
- Hot days in 30 yrs
- 18 days/yr
Wind risk 2/10 · Minimal
- Chance of severe wind over 30 yrs
- 1.0%
Air-quality risk 3/10 · Minor
- Unhealthy air days now
- 2 days/yr
- Unhealthy air days in 30 yrs
- 3 days/yr
Risk factors via First Street. Map © Google.
Why this score? — see what drove the D- grade
The composite is a weighted blend of 9 inputs, each scored 0–100. Each bar is that input's sub-score; the figure is the points it added to the 100-point composite (weight × sub-score).
- Cash flow +17.6/30.0
- DSCR +5.5/10.0
- Livability +4.2/5.0
- 1% rule +4.0/10.0
- Rent growth +2.5/5.0
- Condition / age +2.5/5.0
- Schools +1.9/10.0
- ARV discount +0.0/15.0
- Appreciation +0.0/10.0
$130,000
🖨 Deal sheet 📄 Offer letter ✓ Due diligence
Listing remarks MLS
Large 4 bedroom house completely remodeled. 2 bedrooms down and 2 larger bedrooms up. New carpet, paint, windows, and bathroom. Enjoy the brick fireplace in the living room, partial basement and 2 car garage. Fenced in backyard. Newer furnace, new gutters. This house is ready to move into.
Key facts
- Private backyard
- Arched entryway
- Brick-pillard porch
Tags
Property features AI
Finance
- Other: Property classified as residential; Zoned residential
- Financial info: No investment or income details provided
- HOA & community: No HOA details provided
Exterior
- Parking: Detached garage with approximately 1.5 spaces
- Security: No security details provided
- Utilities: Public water; Public sewer
- Home design: Single-family residence; One story
- Construction: Vinyl siding construction
- Exterior features: Chain link fencing; Shingle roof
Interior
- Kitchen: No kitchen appliance details provided
- Bedrooms: 7 total rooms (bedrooms and other rooms included)
- Flooring: No flooring details provided
- Bathrooms: 1 full bathroom
- Heating & cooling: Forced air heating (natural gas); Window cooling units
- Interior features: Electric water heater; Basement
- Laundry & utility: No laundry details provided
Neighborhood map
What this means for you Summary
Snapshot
- This is a 3-bed/1.0-bath single-family listed at $130k.
Deal economics
- At list price, monthly cash flow is $103 ($1k/yr) — positive.
- The deal already cash-flows at list — no discount required.
- To meet the 1% rule (rent ≥ 1% of price), the offer needs to be $117k (10.1% below list).
- Recommended offer: $117k (10.1% below list) — sets the bar for 1% rule.
- Cap rate 7.2% vs local median 5.2% in Richmond — top-decile yield for the area; either an underpriced asset or a hidden risk that comps aren't pricing in. Stress-test before assuming the spread holds.
Location & tenants
- Location reads 83/100 on livability (#10 in IN, #869 nationally) — a professional / high-income tenant draw. Strengths: commute A+, cost of living A+, housing A+; Watch: crime D+, employment D-.
- Richmond Community Schools (town): math 18% / reading 27% proficiency, ranked #270 of 301 in IN (top 90%) — low school quality limits family demand, transient renter base, plan for 1-2y turnover; 65% free/reduced lunch — lower-income household profile, screen leases tightly.
- Zoned schools: Charles Elementary School (math 62% / reading 47%, grade C, #197 of 994 statewide, top 22%, 331 students, 59% FRL); Richmond High School (math 21% / reading 48%, grade F, #270 of 369 statewide, top 77%, 1,332 students, 66% FRL) — zoned schools at 62% FRL track the district average.
- Zoned-school proficiency averages 44% at this address vs 22% district-wide (+22 pts) — the actual schools serving this property are materially stronger than the Richmond Community Schools average implies; a family-tenant draw the district grade alone would hide.
- Market conditions: 273 active listings in the ZIP; 1 comparable units currently listed for rent nearby; 38 units permitted in Wayne County in 2024 (0 in 5+ unit buildings).
Forward outlook
- Local home prices are declining (-3.0%/yr); year-one equity from $899 of loan paydown is wiped out by about $4k of value loss. Plan a longer hold.
- Wayne County population projected at -21% by 2050 — secular population decline; favor cash flow + early exit over multi-decade hold.
Negotiation context
- It's been on market 38 days — a 3% lower offer ($126k) is reasonable based on typical stale-listing flexibility.
- 2 sale attempts since 4y ago with the ask held roughly flat each time — persistent listings suggest the price (not the market) is what's stuck; bring a comps-based counter.
- Current owner paid $90k; 45% above their basis — modest negotiation headroom, anchor on the comps not their cost.
Risks & watch-outs
- Watch-outs: built in 1915 — expect roof / HVAC / electrical / plumbing capex.
Questions for the listing agent
- It's been on market 38 days. Have you received any prior offers? Is the seller open to a 10% concession, seller financing, or rate buy-down credit?
- Built in 1915 — when were the roof, HVAC, electrical panel, plumbing, and water heater last replaced?
- Is there a deadline driving the sale (1031 exchange, divorce, estate, relocation)? That informs how much negotiation room exists.
- Schools are D-rated, which usually means shorter tenancies and higher turnover. Who's the typical renter profile here, and what's been the actual vacancy rate?
- Crime grade is D in this area — have there been break-ins, vandalism, or insurance claims at this property in the last 3 years? What carrier currently insures it and at what premium?
- The area grade is low — what's the realistic commute time and amenity access for the typical tenant pool here? Any planned neighborhood developments (good or bad) we should know about?
- What's the average days-on-market for RENTAL listings here right now (not sales)? A rising rental-DOM trend means longer vacancies and softer asking-rent achievability than the comps imply.
- What's the recent tenant-quality profile in this submarket — average credit score on applications, eviction rate, late-payment / NSF rate, and stable-employment percentage? A property-management company in the area should have these aggregated.
- How much new for-sale + rental construction is in the pipeline within 1–3 miles? Heavy new supply typically softens prices + rents 12–24 months out; constrained supply supports both.
Investment metrics
- 1% rule
- 0.90% ✗
- Cap rate
- 7.25%
- Cash-on-cash
- 3.41%
- DSCR
- 1.15
- GRM
- 9.3
CMA / ARV
- ARV (on-the-fly)
- $104,520
- Comps found
- 12
Show comp detail 12 sales within ~0.75 mi
| Address | Dist | Beds/Ba | Sqft | Sold | Price | $/sf | Match |
|---|---|---|---|---|---|---|---|
| 505 S 12th St | 0.29mi | 3/1.0 | 1,612 (+3%) | 8mo | $31,000 | $19 | 75 |
| 735 S 13th St | 0.24mi | 3/2.0 | 1,485 (-5%) | 10mo | $119,900 | $81 | 69 |
| 518 S 15th St | 0.43mi | 3/1.5 | 1,514 (-3%) | 9mo | $170,000 | $112 | 65 |
| 611 S 12th St | 0.22mi | 3/1.5 | 1,414 (-9%) | 9mo | $60,000 | $42 | 65 |
| 623 S 9th St | 0.13mi | 2/1.0 (-1) | 1,382 (-11%) | 9mo | $47,000 | $34 | 62 |
| 1027 S 8th St | 0.23mi | 2/1.5 (-1) | 1,375 (-12%) | 9mo | $23,000 | $17 | 55 |
| 431 S 13th St | 0.39mi | 2/1.5 (-1) | 1,400 (-10%) | 10mo | $98,000 | $70 | 50 |
| 906 S 5th St | 0.43mi | 3/1.0 | 1,778 (+14%) | 9mo | $120,000 | $67 | 49 |
| 432 S 15th St | 0.48mi | 3/1.5 | 1,344 (-14%) | 5mo | $140,900 | $105 | 48 |
| 417 S 14th St | 0.46mi | 2/1.5 (-1) | 1,336 (-14%) | 4mo | $43,000 | $32 | 44 |
| 301 S 16th St | 0.64mi | 3/2.5 | 1,782 (+14%) | 4mo | $270,000 | $152 | 37 |
| 117 S 15th St | 0.72mi | 2/2.0 (-1) | 1,380 (-12%) | 2mo | $79,900 | $58 | 37 |
Match score weights: distance 35% · size 25% · config 20% · recency 20%. Top-matched comps best support the ARV.
Projected returns pro-forma
-3.0% appreciation · 3.0% rent growth · sell at horizon
- IRR
- -11.0%
- Equity multiple
- 0.60×
- Total profit
- $-14,506
- Equity at exit
- $19,383
- IRR
- -1.7%
- Equity multiple
- 0.88×
- Total profit
- $-4,269
- Equity at exit
- $11,240
Cash invested: $36,400 (down + closing). Projections, not guarantees.
Landlord ↔ Tenant lean methodology
- Overall (STATE)
- 90 Strongly Landlord-Friendly
- State Indiana
- 90 Strongly Landlord-Friendly · R+11
- County
- — inherits STATE
- City
- — inherits STATE
ZIP-level market 47374
- Active inventory
- 273
- Price-to-rent
- 9.3×
Monthly cashflow live
- Estimated rent
- $1,169 medium interval (Pro) →
- Mortgage (P&I)
- −$682
- Tax from tax record
- −$84 /mo · $1,010/yr
- Insurance
- −$54
- HOA
- −$0
- Vacancy / Maint / Mgmt
- −$245
- Net cashflow
- $103
Break-even live
UW: 25.0% down · 7.5% · 30yr · 1.5% tax · 5.0% vac · 8.0% maint · 8.0% mgmt
Financing live
Cash to close
- Down payment
- $32,500
- Closing costs
- $3,900
- Reserves months
- —
- Total cash needed
- —
Loan-product check · same deal, 3 products live
Conventional
25% down · 7.5% · 30yr
- Down + closing
- —
- Monthly P&I
- —
- Monthly cashflow
- —
- DSCR
- —
- Eligible?
- —
Personal DTI + credit; lowest rate.
DSCR
20% down · 8.5% · 30yr
- Down + closing
- —
- Monthly P&I
- —
- Monthly cashflow
- —
- DSCR
- —
- Eligible?
- —
No personal income docs; deal must DSCR.
Hard money
10% down · 12.0% · 12mo
- Down + closing
- —
- Monthly P&I
- —
- Monthly cashflow
- —
- DSCR
- —
- Eligible?
- —
Short-term bridge; refi at stabilization.
Rent comps 1 comps
| Address | Beds | Baths | Sqft | Rent | $/sqft | DOM | Units | Dist |
|---|---|---|---|---|---|---|---|---|
| 1032 S 23rd St Richmond, IN | 1.0–2.0 | 1.0 | 937 | $790 | $0.84 | 43d | 4 | 0.90mi |
Listing history 18 events
-
2026-06-19days on market $130,000 Active 38 DOM
-
2026-06-18days on market $130,000 Active 37 DOM
-
2026-06-17days on market $130,000 Active 36 DOM
-
2026-06-16days on market $130,000 Active 35 DOM
-
2026-06-15days on market $130,000 Active 34 DOM
-
2026-06-14days on market $130,000 Active 32 DOM
-
2026-06-12days on market $130,000 Active 31 DOM
-
2026-06-09days on market $130,000 Active 28 DOM
-
2026-06-08days on market $130,000 Active 27 DOM
-
2026-06-07days on market $130,000 Active 26 DOM
-
2026-06-03days on market $130,000 Active 22 DOM
-
2026-06-02days on market $130,000 Active 21 DOM
-
2026-06-01days on market $130,000 Active 20 DOM
-
2026-05-31days on market $130,000 Active 19 DOM
-
2026-05-30days on market $130,000 Active 18 DOM
-
2026-05-12$130,000 Active
-
2022-04-28soldstatus $89,900 290-char remark
Show marketing remark (290 chars)
Large 4 bedroom house completely remodeled. 2 bedrooms down and 2 larger bedrooms up. New carpet, paint, windows, and bathroom. Enjoy the brick fireplace in the living room, partial basement and 2 car garage. Fenced in backyard. Newer furnace, new gutters. This house is ready to move into.
-
2022-02-07$89,900 290-char remark
Show marketing remark (290 chars)
Large 4 bedroom house completely remodeled. 2 bedrooms down and 2 larger bedrooms up. New carpet, paint, windows, and bathroom. Enjoy the brick fireplace in the living room, partial basement and 2 car garage. Fenced in backyard. Newer furnace, new gutters. This house is ready to move into.
ⓘ Source: listings_history table (triggers on properties + properties_extension) + one-shot
backfill from property_details.listing_events for pre-trigger history.
Tax reassessment forecast IN · Partial reset (capped growth)
- Current annual tax
- $1,010 · $84/mo
- Projected year-2 tax
- $1,058 · $88/mo
- Expected delta
- +$48/yr (+$4/mo · 4.7%)
ⓘ Screening estimate from a state-policy table — verify with the county assessor before closing.
Climate risk First Street
- Flood 1/10 Low FEMA zone X (unshaded) · 0% chance over 30 yrs
- Wildfire 1/10 Low
- Heat 3/10 Moderate 7 d/yr ≥100°F today · 18 d/yr by 30 yrs out
- Wind 2/10 Low 100% chance of damaging wind over 30 yrs
- Air quality 3/10 Moderate 2 unhealthy d/yr today · 3 by 30 yrs out
Nearby sold comps map
Loading sold comps map…
Walkable amenities ~0.75 mi
Loading nearby amenities…
Taxation est. · year 1
- Rental income
- $14,028
- − Mortgage interest
- −$7,282
- − Property taxes
- −$1,010
- − Insurance
- −$650
- − Repairs & maintenance
- −$1,122
- − Management
- −$1,122
- − Depreciation
- −$3,782
- Taxable loss
- −$940
- Est. tax savings @ 24.0%
- +$226
- After-tax cash flow
- $1,467/yr
For passive investors: Depreciation is non-cash, so a rental often shows a tax loss while cash-flowing — sheltering income. Rental losses are passive: they offset passive income freely, and up to $25,000/yr can offset ordinary (W-2) income if you actively participate and your MAGI is under $100k (phasing out to $0 by $150k); unused losses carry forward. On sale, claimed depreciation is recaptured at up to 25%, and gains may owe capital-gains tax (a 1031 exchange can defer both). Figures are a year-1 estimate at your 24.0% rate — not tax advice; consult a CPA.
Schools (NCES district)
- District
- Richmond Community Schools
- NCES district ID
- 1809510
- Math proficiency
- 18% ▼ -7.00%
- Reading proficiency
- 27% ▼ -2.00%
- Median HH income
- $35,288
- Composite
- 18.55/100
- National rank
- #8913
- State rank
- #270 of 301 in IN
Livability — Richmond
- Score
- 83/100
- State rank
- #10
- US rank
- #869
Category grades
Schools grade is shown separately in the Schools card above.
Census & demographics
- Census place
- Richmond, IN
- County
- Wayne County · 44,615 people
- City population
- 44,615
- Metro
- Richmond, IN
- Population (ZIP)
- 44,615
- Household income
- $50,766
- Rent vs Own
- Severe rent burden
- 1600.0
Population outlook (Wayne County) Hauer SSP2
- Today (2025)
- 63,316 people
- By 2030
- 60,893 · -3.8%
- By 2040
- 55,386 · -12.5%
- By 2050
- 49,946 · -21.1%
- By 2075
- 37,900 · -40.1%
- By 2100
- 26,562 · -58.0%
Race, ethnicity, and origin ACS 2023
- Neighborhood character
- Predominantly White (82%)
- Race & ethnicity
- White 82% Two or more races 7% Black 6% Hispanic / Latino 4% Asian 1%
- Common ancestry
- Slovak 2% Italian 1% Lithuanian 1%
- Foreign-born
- 4% · Canada, China
- Languages at home
- 95% English-only · Spanish 3%
Political lean MEDSL · Wayne
- 2024 margin
- Solid R (+32.5) · D 32.9% · R 65.4% · Other 1.6%
- 2008→2024 swing
- -28.6pp toward R · 2008: -3.9pp · 2024: -32.5pp
- All cycles
- 2024: R+32.5 2020: R+29.1 2016: R+30.1 2012: R+14.7 2008: R+3.9
Not yet ingested
- Civics
- —
Market trends
- HPI YoY
- ▼ -118.64%
- Current HPI
- 182.5038
- Rent YoY
- —
- Metro
- Richmond, IN
- State GDP YoY
- ▲ 2.90%
- F500 in state
- 18
Industry mix (Fortune 500 HQ in IN)
| Industry | F500 HQs | Revenue |
|---|---|---|
| Industrial Machinery | 2 | $37B |
|
||
| Healthcare | 1 | $177B |
|
||
| Pharmaceuticals | 1 | $45B |
|
||
| Metals / Steel | 1 | $18B |
|
||
| Agriculture | 1 | $17B |
|
||
| Packaging | 1 | $12B |
|
||
Price history
+44.6% since first listed3 events — show timeline
- 2026-05-12 Listed $130,000 RRELMS
- 2022-04-28 Sold (MLS) $89,900 RRELMS
- 2022-02-07 Listed $89,900 RRELMS
Property tax history
-2.0%/yrLatest (2024): $1,010 · +13.9% YoY. Source: county tax records.
Cash-flow waterfall
monthlySold comps — $/sqft
last 12 mo · ≤1 miLoading sold comps…