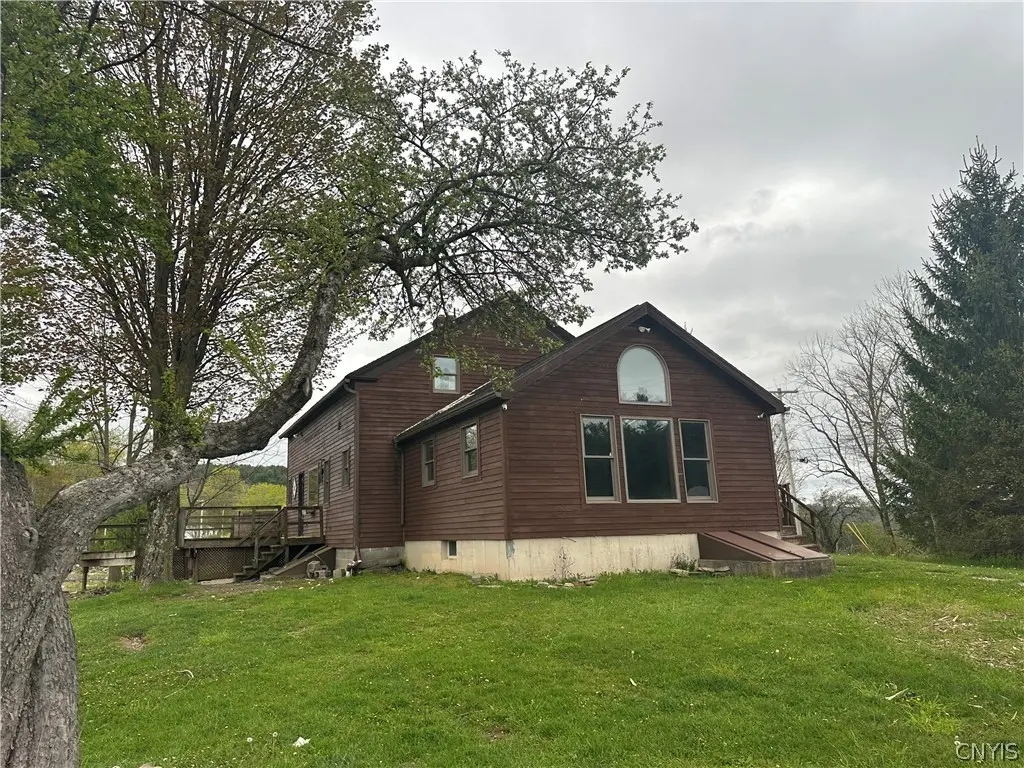
814 County Road 38 · Bainbridge, NY
Flood risk 1/10 · Minimal
- FEMA flood zone
- X (unshaded)
- Chance of flooding over 30 yrs
- 0.0%
- Est. flood insurance / yr
- $473 – $860
Fire risk 1/10 · Minimal
- Est. fire insurance / yr
- $691 – $1,283
Heat risk 2/10 · Minimal
- Hot days now (above 92°F)
- 7 days/yr
- Hot days in 30 yrs
- 18 days/yr
Wind risk 2/10 · Minimal
- Chance of severe wind over 30 yrs
- 1.0%
Air-quality risk 2/10 · Minimal
- Unhealthy air days now
- 0 days/yr
- Unhealthy air days in 30 yrs
- 1 days/yr
Risk factors via First Street. Map © Google.
Why this score? — see what drove the D grade
The composite is a weighted blend of 9 inputs, each scored 0–100. Each bar is that input's sub-score; the figure is the points it added to the 100-point composite (weight × sub-score).
- Appreciation +10.0/10.0
- ARV discount +7.5/15.0
- Cash flow +7.2/30.0
- 1% rule +4.3/10.0
- Schools +4.1/10.0
- Livability +3.4/5.0
- Rent growth +2.5/5.0
- Condition / age +2.5/5.0
- DSCR +1.3/10.0
$147,600
🖨 Deal sheet (PDF) 📄 Offer letter ✓ Due diligence
Listing remarks
This is a great property consisting of two seperate tax parcels for a totla of 13.4 acres. The home is well built with some post and beam construction in the original part of the home. It has generous space and is full of charm. The are some vaulted ceilings, two fireplaces, and plenty of attractive wood floors from a varierty of different woods. The house needs some repairs and attention, but there is limiltless potential. The three car detached garage has one tall door, an office area, and was supposedly heated in the past with radiant heat in the concrete floor. The property is beautiful with some stunning views. In the past there was apparently a Christmas tree farm and many walking tra
Key facts
- Wood floors
- Vaulted ceilings
- Two tax parcels
Tags
Property features AI
Exterior
- Parking: Detached garage; 3 garage spaces
- Utilities: Well water; Septic tank
- Home design: Single-story; Resale property; Cedar, frame, and wood siding exterior
- Construction: Block foundation; Existing construction
- Exterior features: Deck; Gravel driveway; Barn(s) and outbuilding
Interior
- Kitchen: Kitchen island; Eat-in kitchen; Free-standing range; Oven; Range hood; Refrigerator; Exhaust fan
- Bedrooms: Bedrooms present (room levels not further specified)
- Flooring: Hardwood; Vinyl; Varied flooring
- Bathrooms: 2 full bathrooms; 1 bathroom on the main level
- Heating & cooling: Oil heating; Baseboard heating; Heating present
- Interior features: Ceiling fans; Separate/formal dining room; Eat-in kitchen; Separate/formal living room; Great room; Country kitchen; Kitchen island; Main level primary bedroom; Bedroom on main level
- Laundry & utility: Main level laundry; Washer; Dryer; Water heater
Neighborhood map
What this means for you Summary
Snapshot
- This is a 4-bed/2.0-bath single-family listed at $148k.
Deal economics
- At list price, monthly cash flow is $-205 ($-2k/yr) — negative.
- To cash-flow at today's rent, offer at most $111k (24.6% below list).
- To meet the 1% rule (rent ≥ 1% of price), the offer needs to be $137k (7.3% below list).
- Recommended offer: $111k (24.6% below list) — sets the bar for cash-flow.
Location & tenants
- Location reads 68/100 on livability (#561 in NY) — a middle-class / working-renter tenant base. Strengths: cost of living A+, housing A+, crime A-; Watch: employment D, health & safety D, amenities F.
- Bainbridge-Guilford Central School District (rural): math 40% / reading 57% proficiency, ranked #418 of 590 in NY (top 71%) — families likely to look elsewhere, expect single-tenant / working-renter base with shorter leases.
- Zoned schools: Greenlawn Elementary School (math 27% / reading 57%, grade F, #1,361 of 2,108 statewide, top 67%, 277 students, 52% FRL); Bainbridge-Guilford High School (math 57% / reading 57%, grade C, #887 of 1,100 statewide, top 82%, 362 students, 44% FRL).
- Market conditions: 30 active listings in the ZIP; 151 units permitted in Chenango County in 2024 (96 in 5+ unit buildings).
Forward outlook
- In year one you build about $16k of equity ($1k loan paydown + $15k appreciation (10.0% local appreciation)).
- Chenango County population projected at -26% by 2050 — secular population decline; favor cash flow + early exit over multi-decade hold.
- By year 3, paydown + projected appreciation supports a ~$40k cash-out refi (75% LTV) — recoverable capital for the next deal without selling this one.
Negotiation context
- It's been on market 16 days — a 2% lower offer ($145k) is reasonable based on typical stale-listing flexibility.
- 2 sale attempts with the ask held roughly flat each time — persistent listings suggest the price (not the market) is what's stuck; bring a comps-based counter.
- Current owner paid $1k; list at $148k implies a 14660% gain — meaningful room to come down on a strong offer.
Risks & watch-outs
- Watch-outs: property tax is 3.7% of price; built in 1860 — expect roof / HVAC / electrical / plumbing capex.
Questions for the listing agent
- What do current leases actually rent for vs. the listed asking? Can we see a recent rent roll and the last 12 months of T-12 income?
- Built in 1860 — when were the roof, HVAC, electrical panel, plumbing, and water heater last replaced?
- Property tax is high relative to price — has the assessment been appealed recently, and will the sale trigger a re-assessment?
- Is there a deadline driving the sale (1031 exchange, divorce, estate, relocation)? That informs how much negotiation room exists.
- The area grade is low — what's the realistic commute time and amenity access for the typical tenant pool here? Any planned neighborhood developments (good or bad) we should know about?
- What's the average days-on-market for RENTAL listings here right now (not sales)? A rising rental-DOM trend means longer vacancies and softer asking-rent achievability than the comps imply.
- What's the recent tenant-quality profile in this submarket — average credit score on applications, eviction rate, late-payment / NSF rate, and stable-employment percentage? A property-management company in the area should have these aggregated.
- How much new for-sale + rental construction is in the pipeline within 1–3 miles? Heavy new supply typically softens prices + rents 12–24 months out; constrained supply supports both.
Investment metrics
- 1% rule
- 0.93% ✗
- Cap rate
- 4.62%
- Cash-on-cash
- -5.96%
- DSCR
- 0.73
- GRM
- 9.0
CMA / ARV
No comps found within radius.
Projected returns pro-forma
10.0% appreciation · 3.0% rent growth · sell at horizon
- IRR
- 20.1%
- Equity multiple
- 2.63×
- Total profit
- $67,493
- Equity at exit
- $132,970
- IRR
- 18.4%
- Equity multiple
- 6.07×
- Total profit
- $209,407
- Equity at exit
- $286,754
Cash invested: $41,328 (down + closing). Projections, not guarantees.
Landlord ↔ Tenant lean methodology
- Overall (STATE)
- 15 Strongly Tenant-Friendly
- State New York
- 15 Strongly Tenant-Friendly · D+10
- County
- — inherits STATE
- City
- — inherits STATE
ZIP-level market 13733
- Home prices YoY
- 13.9%
- Active inventory
- 30
- Price-to-rent
- 9.0×
Monthly cashflow live
- Estimated rent
- $1,368 medium interval (Pro) →
- Mortgage (P&I)
- −$774
- Tax from tax record
- −$451 /mo · $5,407/yr
- Insurance
- −$62
- HOA
- −$0
- Vacancy / Maint / Mgmt
- −$287
- Net cashflow
- $-205
Break-even live
Sensitivity live
| Price | -10% $-122 | -5% $-164 | +0% $-205 | +5% $-247 | +10% $-289 |
|---|---|---|---|---|---|
| Rent | -10% $-313 | -5% $-259 | +0% $-205 | +5% $-151 | +10% $-97 |
| Rate | -1.0pp $-131 | -0.5pp $-168 | base $-205 | +0.5pp $-244 | +1.0pp $-282 |
UW: 25.0% down · 7.5% · 30yr · 1.5% tax · 5.0% vac · 8.0% maint · 8.0% mgmt
Financing live
Cash to close
- Down payment
- $36,900
- Closing costs
- $4,428
- Reserves months
- —
- Total cash needed
- —
Loan-product check · same deal, 3 products live
Conventional
25% down · 7.5% · 30yr
- Down + closing
- —
- Monthly P&I
- —
- Monthly cashflow
- —
- DSCR
- —
- Eligible?
- —
Personal DTI + credit; lowest rate.
DSCR
20% down · 8.5% · 30yr
- Down + closing
- —
- Monthly P&I
- —
- Monthly cashflow
- —
- DSCR
- —
- Eligible?
- —
No personal income docs; deal must DSCR.
Hard money
10% down · 12.0% · 12mo
- Down + closing
- —
- Monthly P&I
- —
- Monthly cashflow
- —
- DSCR
- —
- Eligible?
- —
Short-term bridge; refi at stabilization.
Listing history 13 events
-
2026-06-21statusdays on market $147,600 Pending 16 DOM
-
2026-06-18days on market $147,600 Active 15 DOM
-
2026-06-17days on market $147,600 Active 14 DOM
-
2026-06-16days on market $147,600 Active 13 DOM
-
2026-06-15days on market $147,600 Active 12 DOM
-
2026-06-13days on market $147,600 Active 10 DOM
-
2026-06-12days on market $147,600 Active 9 DOM
-
2026-06-09days on market $147,600 Active 6 DOM
-
2026-06-08days on market $147,600 Active 5 DOM
-
2026-06-07days on market $147,600 Active 4 DOM
-
2026-06-07days on market $147,600 Active 3 DOM
-
2026-06-04remarks 699-char remark
-
2026-06-04$147,600 Active 1 DOM
ⓘ Source: listings_history table (triggers on properties + properties_extension) + one-shot
backfill from property_details.listing_events for pre-trigger history.
Tax reassessment forecast NY · Partial reset (capped growth)
- Current annual tax
- $5,407 · $451/mo
- Projected year-2 tax
- $5,407 · $451/mo
- Expected delta
- $0/yr ($0/mo · 0.0%)
ⓘ Screening estimate from a state-policy table — verify with the county assessor before closing.
Climate risk First Street
- Flood 1/10 Low FEMA zone X (unshaded) · 0% chance over 30 yrs
- Wildfire 1/10 Low
- Heat 2/10 Low 7 d/yr ≥92°F today · 18 d/yr by 30 yrs out
- Wind 2/10 Low 100% chance of damaging wind over 30 yrs
- Air quality 2/10 Low 0 unhealthy d/yr today · 1 by 30 yrs out
Nearby sold comps map
Loading sold comps map…
Walkable amenities ~0.75 mi
Loading nearby amenities…
Taxation est. · year 1
- Rental income
- $16,417
- − Mortgage interest
- −$8,268
- − Property taxes
- −$5,407
- − Insurance
- −$738
- − Repairs & maintenance
- −$1,313
- − Management
- −$1,313
- − Depreciation
- −$4,294
- Taxable loss
- −$4,917
- Est. tax savings @ 24.0%
- +$1,180
- After-tax cash flow
- $-1,284/yr
For passive investors: Depreciation is non-cash, so a rental often shows a tax loss while cash-flowing — sheltering income. Rental losses are passive: they offset passive income freely, and up to $25,000/yr can offset ordinary (W-2) income if you actively participate and your MAGI is under $100k (phasing out to $0 by $150k); unused losses carry forward. On sale, claimed depreciation is recaptured at up to 25%, and gains may owe capital-gains tax (a 1031 exchange can defer both). Figures are a year-1 estimate at your 24.0% rate — not tax advice; consult a CPA.
Schools (NCES district)
- District
- Bainbridge-Guilford Central School District
- NCES district ID
- 3603810
- Math proficiency
- 40% ▼ -14.00%
- Reading proficiency
- 57% ▲ 5.00%
- Median HH income
- $48,248
- Composite
- 41.31/100
- National rank
- #3511
- State rank
- #418 of 590 in NY
Livability — Bainbridge
- Score
- 68/100
- State rank
- #561
- US rank
- #10094
Category grades
Schools grade is shown separately in the Schools card above.
Census & demographics
- City population
- 5,265
- Population (ZIP)
- 5,265
Population outlook (Chenango County) Hauer SSP2
- Today (2025)
- 45,669 people
- By 2030
- 43,484 · -4.8%
- By 2040
- 38,774 · -15.1%
- By 2050
- 34,000 · -25.6%
- By 2075
- 24,637 · -46.1%
- By 2100
- 16,452 · -64.0%
Race, ethnicity, and origin ACS 2023
- Neighborhood character
- Predominantly White (96%)
- Race & ethnicity
- White 96% Two or more races 2%
- Common ancestry
- Iranian 5% Romanian 4% Slovak 3%
- Foreign-born
- 1% · Canada
- Languages at home
- 94% English-only · German/W. Germanic 4% Russian/Polish/Slavic 1% Spanish 1%
Political lean MEDSL · Chenango
- 2024 margin
- Strong R (+27.2) · D 36.4% · R 63.6%
- 2008→2024 swing
- -26.1pp toward R · 2008: -1.1pp · 2024: -27.2pp
- All cycles
- 2024: R+27.2 2020: R+23.3 2016: R+28.1 2012: R+3.4 2008: R+1.1
Not yet ingested
- Civics
- —
Market trends
- HPI YoY
- ▲ 34.93%
- Current HPI
- 287.0519
- Rent YoY
- —
- Metro
- —
- State GDP YoY
- ▲ 2.60%
- F500 in state
- 92
Industry mix (Fortune 500 HQ in NY)
| Industry | F500 HQs | Revenue |
|---|---|---|
| Financial Services | 10 | $950B |
|
||
| Consumer Goods | 9 | $162B |
|
||
| Insurance | 4 | $225B |
|
||
| Telecommunications | 2 | $144B |
|
||
| Pharmaceuticals | 2 | $112B |
|
||
| Media / Entertainment | 2 | $69B |
|
||
Price history
-38.5% since first listed5 events — show timeline
- 2026-06-02 Listed $147,600 CNYIS
- 2026-05-11 Sold (Public Records) $1,000 Public Records
- 2025-08-23 Listing Removed — UNYREIS
- 2025-07-01 Listed $259,777 UNYREIS
- 2021-08-20 Sold (Public Records) $240,000 Public Records
Property tax history
+1.0%/yrLatest (2025): $5,407 · -1.6% YoY. Source: county tax records.
Cash-flow waterfall
monthlySold comps — $/sqft
last 12 mo · ≤1 miLoading sold comps…