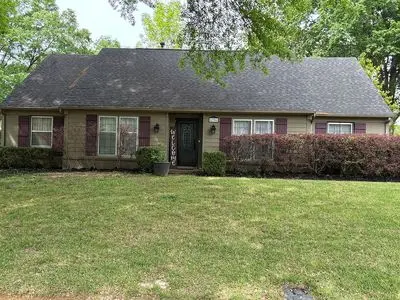
6996 Bent Creek Dr · Germantown, TN
Flood risk 1/10 · Minimal
- FEMA flood zone
- X (unshaded)
- Chance of flooding over 30 yrs
- 0.0%
- Est. flood insurance / yr
- $507 – $1,088
Fire risk 1/10 · Minimal
- Est. fire insurance / yr
- $949 – $1,763
Heat risk 6/10 · Moderate
- Hot days now (above 110°F)
- 7 days/yr
- Hot days in 30 yrs
- 21 days/yr
Wind risk 4/10 · Minor
- Chance of severe wind over 30 yrs
- 17.0%
Air-quality risk 3/10 · Minor
- Unhealthy air days now
- 2 days/yr
- Unhealthy air days in 30 yrs
- 3 days/yr
Risk factors via First Street. Map © Google.
Why this score? — see what drove the C grade
The composite is a weighted blend of 9 inputs, each scored 0–100. Each bar is that input's sub-score; the figure is the points it added to the 100-point composite (weight × sub-score).
- Cash flow +18.7/30.0
- ARV discount +15.0/15.0
- DSCR +5.9/10.0
- Schools +4.9/10.0
- 1% rule +4.7/10.0
- Rent growth +3.5/5.0
- Livability +3.4/5.0
- Condition / age +2.5/5.0
- Appreciation +0.0/10.0
$339,000
🖨 Deal sheet (PDF) 📄 Offer letter ✓ Due diligence
Listing remarks MLS
PRICED TO SELL! BELOW APPRAISAL! MUCH BIGGER THAN IT LOOKS! FRESH NEUTRAL DECOR & CARPET. SEP LR/DR/DEN. BRIGHT REMODELED KITCHEN W/ TILE FLOOR & WHITE CABINETS. HIS & HER MASTER BATHS. LARGE WALK-IN ATTIC. STORM WINDOWS/DOORS.
Key facts
- Outside storage
- Carport
- Gas stove
Tags
Property features AI
Exterior
- Home design: Built in 1974
- Construction: 1974 construction
- Exterior features: Located in the Poplar Estates subdivision
Neighborhood map
What this means for you Summary
Snapshot
- This is a 5-bed/3.0-bath single-family listed at $339k.
Deal economics
- At list price, monthly cash flow is $332 ($4k/yr) — positive.
- The deal already cash-flows at list — no discount required.
- To meet the 1% rule (rent ≥ 1% of price), the offer needs to be $330k (2.7% below list).
- Recommended offer: $330k (2.7% below list) — sets the bar for 1% rule.
Location & tenants
- Location reads 68/100 on livability (#83 in TN) — a middle-class / working-renter tenant base. Strengths: employment A+, housing A+, crime A-; Watch: cost of living C-, amenities F, commute F.
- Germantown (suburban): math 51% / reading 58% proficiency, ranked #4 of 139 in TN (top 3%) — acceptable for families but not a draw, mixed tenant base, ~2y average lease; only 9% free/reduced lunch — higher-income household profile.
- Zoned schools: Houston Middle School (math 47% / reading 50%, grade C-, #21 of 333 statewide, top 6%, 897 students, 0% FRL); Houston High School (math 6% / reading 61%, grade F, #52 of 332 statewide, top 16%, 1,938 students, 0% FRL).
- Zoned-school proficiency averages 41% at this address vs 54% district-wide (-14 pts) — the specific schools serving this property underperform the Germantown average; the district grade overstates school quality for this exact location.
- Market conditions: Rents rising fast (+4.2%/yr); 251 active listings in the ZIP; 7 comparable units currently listed for rent nearby; rentals at typical pace (median 22d on market — plan ~3-4 weeks tenant-placement turnaround); high-income renter base; 2,020 units permitted in Shelby County in 2024 (1,041 in 5+ unit buildings).
Forward outlook
- Local home prices are declining (-3.0%/yr); year-one equity from $2k of loan paydown is wiped out by about $10k of value loss. Plan a longer hold.
Negotiation context
- Only 1 days on market — expect competitive offers; lowballing is unlikely to land.
- 2 sale attempts since 25y ago with the ask held roughly flat each time — persistent listings suggest the price (not the market) is what's stuck; bring a comps-based counter.
- Current owner paid $170k; list at $339k implies a 99% gain — meaningful room to come down on a strong offer.
Risks & watch-outs
- Climate carrying-cost: extreme-heat days projected 7→21/yr by 2055 (HVAC capex compounding) — expect insurance premiums to compound above CPI over the hold.
Questions for the listing agent
- Built in 1974 — when were the roof, HVAC, electrical panel, plumbing, and water heater last replaced?
- Is there a deadline driving the sale (1031 exchange, divorce, estate, relocation)? That informs how much negotiation room exists.
- Schools are B-rated — typically a magnet for longer-tenancy family renters. What's the average tenant stay here, and is there a school-zone premium baked into asking?
- What's the average days-on-market for RENTAL listings here right now (not sales)? A rising rental-DOM trend means longer vacancies and softer asking-rent achievability than the comps imply.
- What's the recent tenant-quality profile in this submarket — average credit score on applications, eviction rate, late-payment / NSF rate, and stable-employment percentage? A property-management company in the area should have these aggregated.
- How much new for-sale + rental construction is in the pipeline within 1–3 miles? Heavy new supply typically softens prices + rents 12–24 months out; constrained supply supports both.
Investment metrics
- 1% rule
- 0.97% ✗
- Cap rate
- 7.47%
- Cash-on-cash
- 4.20%
- DSCR
- 1.19
- GRM
- 8.6
CMA / ARV
- ARV (on-the-fly)
- $417,120
- Comps found
- 9
Show comp detail 9 sales within ~0.75 mi
| Address | Dist | Beds/Ba | Sqft | Sold | Price | $/sf | Match |
|---|---|---|---|---|---|---|---|
| 1217 Saddle Ridge Dr | 0.20mi | 4/2.5 (-1) | 2,323 (-8%) | 2mo | $425,000 | $183 | 69 |
| 7038 Huntcliff Cv | 0.16mi | 4/2.5 (-1) | 2,739 (+8%) | 4mo | $299,000 | $109 | 68 |
| 6971 Stillbrook Dr | 0.10mi | 4/2.5 (-1) | 2,223 (-12%) | 9mo | $383,000 | $172 | 61 |
| 1514 Holly Hill Dr | 0.44mi | 4/3.0 (-1) | 2,438 (-4%) | 14mo | $449,000 | $184 | 57 |
| 1623 Holly Hill Cv | 0.66mi | 4/2.5 (-1) | 2,578 (+2%) | 4mo | $425,000 | $165 | 55 |
| 1497 Poplar Estates Pkwy | 0.38mi | 4/2.0 (-1) | 2,185 (-14%) | 0mo | $414,900 | $190 | 50 |
| 1562 Holly Hill Rd | 0.52mi | 4/2.5 (-1) | 2,419 (-4%) | 15mo | $370,000 | $153 | 49 |
| 7008 Corsica Rd | 0.13mi | 5/2.5 | 2,889 (+14%) | 23mo | $380,000 | $132 | 49 |
| 1604 Riverdale Rd | 0.71mi | 5/3.0 | 2,783 (+10%) | 8mo | $460,000 | $165 | 44 |
Match score weights: distance 35% · size 25% · config 20% · recency 20%. Top-matched comps best support the ARV.
Projected returns pro-forma
-3.0% appreciation · 4.19% rent growth · sell at horizon
- IRR
- -8.4%
- Equity multiple
- 0.69×
- Total profit
- $-29,775
- Equity at exit
- $50,546
- IRR
- 2.5%
- Equity multiple
- 1.19×
- Total profit
- $18,133
- Equity at exit
- $29,311
Cash invested: $94,920 (down + closing). Projections, not guarantees.
Landlord ↔ Tenant lean methodology
- Overall (STATE)
- 87 Strongly Landlord-Friendly
- State Tennessee
- 87 Strongly Landlord-Friendly · R+13
- County
- — inherits STATE
- City
- — inherits STATE
ZIP-level market 38138
- Rents YoY
- 4.2%
- Active inventory
- 251
- Price-to-rent
- 8.6×
Monthly cashflow live
- Estimated rent
- $3,297 high interval (Pro) →
- Mortgage (P&I)
- −$1,778
- Tax from tax record
- −$353 /mo · $4,239/yr
- Insurance
- −$141
- HOA
- −$0
- Vacancy / Maint / Mgmt
- −$692
- Net cashflow
- $332
Break-even live
Sensitivity live
| Price | -10% $524 | -5% $428 | +0% $332 | +5% $236 | +10% $140 |
|---|---|---|---|---|---|
| Rent | -10% $72 | -5% $202 | +0% $332 | +5% $462 | +10% $593 |
| Rate | -1.0pp $503 | -0.5pp $418 | base $332 | +0.5pp $244 | +1.0pp $155 |
UW: 25.0% down · 7.5% · 30yr · 1.5% tax · 5.0% vac · 8.0% maint · 8.0% mgmt
Financing live
Cash to close
- Down payment
- $84,750
- Closing costs
- $10,170
- Reserves months
- —
- Total cash needed
- —
Loan-product check · same deal, 3 products live
Conventional
25% down · 7.5% · 30yr
- Down + closing
- —
- Monthly P&I
- —
- Monthly cashflow
- —
- DSCR
- —
- Eligible?
- —
Personal DTI + credit; lowest rate.
DSCR
20% down · 8.5% · 30yr
- Down + closing
- —
- Monthly P&I
- —
- Monthly cashflow
- —
- DSCR
- —
- Eligible?
- —
No personal income docs; deal must DSCR.
Hard money
10% down · 12.0% · 12mo
- Down + closing
- —
- Monthly P&I
- —
- Monthly cashflow
- —
- DSCR
- —
- Eligible?
- —
Short-term bridge; refi at stabilization.
Rent comps 7 comps
| Address | Beds | Baths | Sqft | Rent | $/sqft | DOM | Units | Dist |
|---|---|---|---|---|---|---|---|---|
| 7008 Corsica Dr Germantown, TN | 5.0 | 2.5 | 2889 | $3,000 | $1.04 | 45d | 1 | 0.14mi |
| 6934 Wynterhall Dr Germantown, TN | 4.0 | 2.5 | 2211 | $2,900 | $1.31 | 4d | 1 | 0.25mi |
| 1703 Bryn Mawr Cv Germantown, TN | 4.0 | 3.5 | 2896 | $2,875 | $0.99 | 25d | 1 | 0.80mi |
| 7472 Dove Field Cv Germantown, TN | 5.0 | 2.5 | 2815 | $3,250 | $1.15 | 4d | 1 | 0.92mi |
| 1676 Miller Farms Rd Germantown, TN | 4.0 | 3.0 | 2274 | $3,650 | $1.61 | 21d | 1 | 1.22mi |
| 1741 Magnolia Tree Rd Germantown, TN | 4.0 | 2.5 | 2791 | $2,950 | $1.06 | 45d | 1 | 1.25mi |
| 7650 Charstone Dr Germantown, TN | 4.0 | 3.0 | 2774 | $2,456 | $0.89 | 13d | 1 | 1.26mi |
Listing history 7 events
-
2026-05-13status Under Contract
-
2026-05-12$339,000 Active
-
2002-07-12soldstatus $170,000
-
2002-06-21soldstatus $170,000 245-char remark
Show marketing remark (245 chars)
PRICED TO SELL! BELOW APPRAISAL! MUCH BIGGER THAN IT LOOKS! FRESH NEUTRAL DECOR & CARPET. SEP LR/DR/DEN. BRIGHT REMODELED KITCHEN W/ TILE FLOOR & WHITE CABINETS. HIS & HER MASTER BATHS. LARGE WALK-IN ATTIC. STORM WINDOWS/DOORS.
-
2002-05-27historical 245-char remark
Show marketing remark (245 chars)
PRICED TO SELL! BELOW APPRAISAL! MUCH BIGGER THAN IT LOOKS! FRESH NEUTRAL DECOR & CARPET. SEP LR/DR/DEN. BRIGHT REMODELED KITCHEN W/ TILE FLOOR & WHITE CABINETS. HIS & HER MASTER BATHS. LARGE WALK-IN ATTIC. STORM WINDOWS/DOORS.
-
2001-10-24$171,900 245-char remark
Show marketing remark (245 chars)
PRICED TO SELL! BELOW APPRAISAL! MUCH BIGGER THAN IT LOOKS! FRESH NEUTRAL DECOR & CARPET. SEP LR/DR/DEN. BRIGHT REMODELED KITCHEN W/ TILE FLOOR & WHITE CABINETS. HIS & HER MASTER BATHS. LARGE WALK-IN ATTIC. STORM WINDOWS/DOORS.
-
1975-03-14soldstatus $53,000
ⓘ Source: listings_history table (triggers on properties + properties_extension) + one-shot
backfill from property_details.listing_events for pre-trigger history.
Tax reassessment forecast TN · Resets to sale price
- Current annual tax
- $4,239 · $353/mo
- Projected year-2 tax
- $4,239 · $353/mo
- Expected delta
- $0/yr ($0/mo · 0.0%)
ⓘ Screening estimate from a state-policy table — verify with the county assessor before closing.
Climate risk First Street
- Flood 1/10 Low FEMA zone X (unshaded) · 0% chance over 30 yrs
- Wildfire 1/10 Low
- Heat 6/10 Major 7 d/yr ≥110°F today · 21 d/yr by 30 yrs out
- Wind 4/10 Moderate 17% chance of damaging wind over 30 yrs
- Air quality 3/10 Moderate 2 unhealthy d/yr today · 3 by 30 yrs out
Nearby sold comps map
Loading sold comps map…
Walkable amenities ~0.75 mi
Loading nearby amenities…
Taxation est. · year 1
- Rental income
- $39,561
- − Mortgage interest
- −$18,989
- − Property taxes
- −$4,239
- − Insurance
- −$1,695
- − Repairs & maintenance
- −$3,165
- − Management
- −$3,165
- − Depreciation
- −$9,862
- Taxable loss
- −$1,554
- Est. tax savings @ 24.0%
- +$373
- After-tax cash flow
- $4,359/yr
For passive investors: Depreciation is non-cash, so a rental often shows a tax loss while cash-flowing — sheltering income. Rental losses are passive: they offset passive income freely, and up to $25,000/yr can offset ordinary (W-2) income if you actively participate and your MAGI is under $100k (phasing out to $0 by $150k); unused losses carry forward. On sale, claimed depreciation is recaptured at up to 25%, and gains may owe capital-gains tax (a 1031 exchange can defer both). Figures are a year-1 estimate at your 24.0% rate — not tax advice; consult a CPA.
Schools (NCES district)
- District
- Germantown
- NCES district ID
- 4700151
- Math proficiency
- 51% ▼ -15.00%
- Reading proficiency
- 58% ▼ -5.00%
- Median HH income
- $79,101
- Composite
- 49.28/100
- National rank
- #2026
- State rank
- #4 of 139 in TN
Livability — Germantown
- Score
- 68/100
- State rank
- #83
- US rank
- #9355
Category grades
Schools grade is shown separately in the Schools card above.
Census & demographics
- Census place
- Germantown, TN
- County
- Shelby County · 895,435 people
- City population
- 25,167
- Metro
- Memphis, TN-MS-AR
- Population (ZIP)
- 25,167
- Household income
- $136,297
- Rent vs Own
- Severe rent burden
- 686.0
Population outlook (Shelby County) Hauer SSP2
- Today (2025)
- 952,522 people
- By 2030
- 952,970 · +0.0%
- By 2040
- 945,842 · -0.7%
- By 2050
- 928,211 · -2.6%
- By 2075
- 877,898 · -7.8%
- By 2100
- 794,112 · -16.6%
Race, ethnicity, and origin ACS 2023
- Neighborhood character
- Predominantly White (84%)
- Race & ethnicity
- White 84% Black 6% Asian 5% Two or more races 3% Hispanic / Latino 2%
- Common ancestry
- Slovak 4% Lithuanian 3% Romanian 2%
- Foreign-born
- 7% · Canada, China
- Languages at home
- 93% English-only · Chinese 1% Spanish 1% Other Asian/Pacific 1%
Political lean MEDSL · Shelby
- 2024 margin
- Strong D (+25.4) · D 61.8% · R 36.4% · Other 1.8%
- 2008→2024 swing
- -2.0pp toward R · 2008: 27.4pp · 2024: 25.4pp
- All cycles
- 2024: D+25.4 2020: D+30.4 2016: D+27.6 2012: D+26.1 2008: D+27.4
Not yet ingested
- Civics
- —
Market trends
- HPI YoY
- ▼ -219.64%
- Current HPI
- 208.886
- Rent YoY
- ▲ 4.19%
- Metro
- Memphis, TN-MS-AR
- State GDP YoY
- ▲ 2.78%
- F500 in state
- 22
Industry mix (Fortune 500 HQ in TN)
| Industry | F500 HQs | Revenue |
|---|---|---|
| Healthcare | 3 | $91B |
|
||
| Retail | 3 | $72B |
|
||
| Transportation / Logistics | 1 | $88B |
|
||
| Paper / Packaging | 1 | $19B |
|
||
| Insurance | 1 | $13B |
|
||
| Energy | 1 | $12B |
|
||
Price history
+539.6% since first listed7 events — show timeline
- 2026-05-13 Pending — FSBO.com
- 2026-05-12 Listed $339,000 FSBO.com
- 2002-07-12 Sold (Public Records) $170,000 Public Records
- 2002-06-21 Sold (MLS) $170,000 Memphis Area Association of Realtors(R) MLS
- 2002-05-27 Delisted — Memphis Area Association of Realtors(R) MLS
- 2001-10-24 Listed $171,900 Memphis Area Association of Realtors(R) MLS
- 1975-03-14 Sold (Public Records) $53,000 Public Records
Property tax history
+5.6%/yrLatest (2025): $4,239 · +0.4% YoY. Source: county tax records.
Cash-flow waterfall
monthlySold comps — $/sqft
last 12 mo · ≤1 miLoading sold comps…