815 Mallorys Ford Rd · Blue Ridge Shores, VA
Flood risk 1/10 · Minimal
- FEMA flood zone
- X (unshaded)
- Chance of flooding over 30 yrs
- 0.0%
- Est. flood insurance / yr
- $507 – $1,088
Fire risk 4/10 · Minor
- Est. fire insurance / yr
- $666 – $1,236
Heat risk 6/10 · Moderate
- Hot days now (above 106°F)
- 7 days/yr
- Hot days in 30 yrs
- 17 days/yr
Wind risk 3/10 · Minor
- Chance of severe wind over 30 yrs
- 5.0%
Air-quality risk 1/10 · Minimal
- Unhealthy air days now
- 0 days/yr
- Unhealthy air days in 30 yrs
- 0 days/yr
Risk factors via First Street. Map © Google.
Why this score? — see what drove the D- grade
The composite is a weighted blend of 9 inputs, each scored 0–100. Each bar is that input's sub-score; the figure is the points it added to the 100-point composite (weight × sub-score).
- Cash flow +11.4/30.0
- ARV discount +7.5/15.0
- Schools +6.0/10.0
- DSCR +3.3/10.0
- Livability +2.9/5.0
- Rent growth +2.5/5.0
- Condition / age +2.5/5.0
- 1% rule +2.2/10.0
- Appreciation +0.0/10.0
$265,000
🖨 Deal sheet 📄 Offer letter ✓ Due diligence
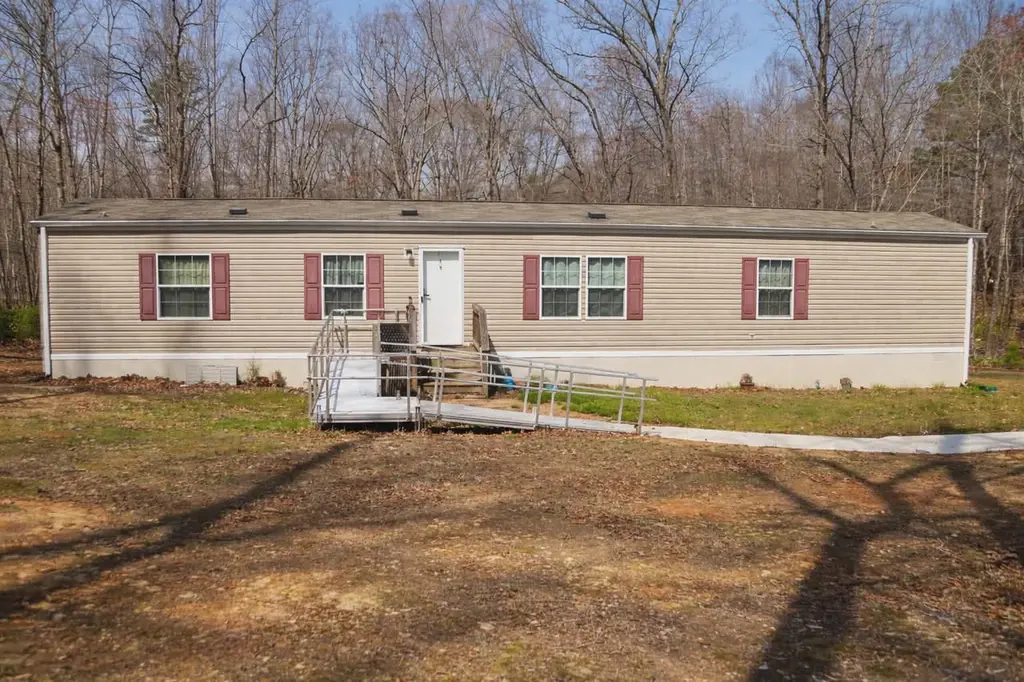
Listing remarks
Move-in ready 3-bedroom, 2-bath home built in 2018, set on 1.5 private acres in Louisa County! Enjoy easy one-level living with a bright, open layout designed for everyday comfort. The spacious lot offers endless possibilities—whether you’re looking to garden, expand, or simply enjoy the peace and privacy of country living. Tucked away in a quiet setting while still convenient to nearby amenities, this property offers the perfect blend of space, comfort, and value. Don’t miss this opportunity to own a newer home on over an acre!
Key facts
- Private acres
- Country living
- Nearby amenities
Tags
Neighborhood map
What this means for you Summary
Snapshot
- This is a 3-bed/2.0-bath manufactured listed at $265k.
Deal economics
- At list price, monthly cash flow is $-94 ($-1k/yr) — negative.
- To cash-flow at today's rent, offer at most $248k (6.2% below list).
- To meet the 1% rule (rent ≥ 1% of price), the offer needs to be $192k (27.6% below list).
- Recommended offer: $192k (27.6% below list) — sets the bar for 1% rule.
- Cap rate 5.9% vs local median 2.9% in Blue Ridge Shores — top-decile yield for the area; either an underpriced asset or a hidden risk that comps aren't pricing in. Stress-test before assuming the spread holds.
Location & tenants
- Location reads 57/100 on livability (#501 in VA) — a working-class tenant base; expect higher turnover. Strengths: housing A+, cost of living A-; Watch: employment D, amenities F, commute F.
- Louisa County Public School District (rural): math 64% / reading 77% proficiency, ranked #19 of 131 in VA (top 14%) — strong family-tenant draw, lease renewals of 3-5y typical.
- Zoned schools: Trevilians Elementary (math 45% / reading 69%, grade C+, #597 of 1,108 statewide, top 57%, 536 students, 80% FRL); Louisa County Middle (math 59% / reading 76%, grade A-, #98 of 342 statewide, top 30%, 1,152 students, 64% FRL); Louisa County High (math 86% / reading 92%, grade A+, #10 of 319 statewide, top 3%, 1,653 students, 63% FRL) — zoned schools average 69% FRL vs 38% district-wide (31 pts higher); higher-poverty schools than district average — tighter screening recommended.
- Market conditions: 184 active listings in the ZIP; 408 units permitted in Louisa County in 2024 (0 in 5+ unit buildings).
Forward outlook
- Local home prices are declining (-3.0%/yr); year-one equity from $2k of loan paydown is wiped out by about $8k of value loss. Plan a longer hold.
- Louisa County population projected at +4% by 2050 — modest demand growth; plan on rents tracking national, not racing it.
Negotiation context
- It's been on market 18 days — a 2% lower offer ($261k) is reasonable based on typical stale-listing flexibility.
Risks & watch-outs
- Climate carrying-cost: extreme-heat days projected 7→17/yr by 2055 (HVAC capex compounding) — expect insurance premiums to compound above CPI over the hold.
Questions for the listing agent
- What do current leases actually rent for vs. the listed asking? Can we see a recent rent roll and the last 12 months of T-12 income?
- Is there a deadline driving the sale (1031 exchange, divorce, estate, relocation)? That informs how much negotiation room exists.
- Schools are D-rated, which usually means shorter tenancies and higher turnover. Who's the typical renter profile here, and what's been the actual vacancy rate?
- The area grade is low — what's the realistic commute time and amenity access for the typical tenant pool here? Any planned neighborhood developments (good or bad) we should know about?
- What's the average days-on-market for RENTAL listings here right now (not sales)? A rising rental-DOM trend means longer vacancies and softer asking-rent achievability than the comps imply.
- What's the recent tenant-quality profile in this submarket — average credit score on applications, eviction rate, late-payment / NSF rate, and stable-employment percentage? A property-management company in the area should have these aggregated.
- How much new for-sale + rental construction is in the pipeline within 1–3 miles? Heavy new supply typically softens prices + rents 12–24 months out; constrained supply supports both.
Investment metrics
- 1% rule
- 0.72% ✗
- Cap rate
- 5.87%
- Cash-on-cash
- -1.52%
- DSCR
- 0.93
- GRM
- 11.5
CMA / ARV
No comps found within radius.
Projected returns pro-forma
-3.0% appreciation · 3.0% rent growth · sell at horizon
- IRR
- -18.9%
- Equity multiple
- 0.34×
- Total profit
- $-49,018
- Equity at exit
- $39,512
- IRR
- -11.5%
- Equity multiple
- 0.32×
- Total profit
- $-50,805
- Equity at exit
- $22,912
Cash invested: $74,200 (down + closing). Projections, not guarantees.
Landlord ↔ Tenant lean methodology
- Overall (STATE)
- 55 Moderately Landlord-Leaning
- State Virginia
- 55 Moderately Landlord-Leaning · D+2
- County
- — inherits STATE
- City
- — inherits STATE
ZIP-level market 23093
- Home prices YoY
- -15.0%
- Active inventory
- 184
- Price-to-rent
- 11.5×
Monthly cashflow live
- Estimated rent
- $1,920 medium interval (Pro) →
- Mortgage (P&I)
- −$1,390
- Tax from tax record
- −$110 /mo · $1,324/yr
- Insurance
- −$110
- HOA
- −$0
- Vacancy / Maint / Mgmt
- −$403
- Net cashflow
- $-94
Break-even live
UW: 25.0% down · 7.5% · 30yr · 1.5% tax · 5.0% vac · 8.0% maint · 8.0% mgmt
Financing live
Cash to close
- Down payment
- $66,250
- Closing costs
- $7,950
- Reserves months
- —
- Total cash needed
- —
Loan-product check · same deal, 3 products live
Conventional
25% down · 7.5% · 30yr
- Down + closing
- —
- Monthly P&I
- —
- Monthly cashflow
- —
- DSCR
- —
- Eligible?
- —
Personal DTI + credit; lowest rate.
DSCR
20% down · 8.5% · 30yr
- Down + closing
- —
- Monthly P&I
- —
- Monthly cashflow
- —
- DSCR
- —
- Eligible?
- —
No personal income docs; deal must DSCR.
Hard money
10% down · 12.0% · 12mo
- Down + closing
- —
- Monthly P&I
- —
- Monthly cashflow
- —
- DSCR
- —
- Eligible?
- —
Short-term bridge; refi at stabilization.
Listing history 2 events
-
2026-04-22status Pending
-
2026-04-03$265,000 Active
ⓘ Source: listings_history table (triggers on properties + properties_extension) + one-shot
backfill from property_details.listing_events for pre-trigger history.
Tax reassessment forecast VA · Resets to sale price
- Current annual tax
- $1,324 · $110/mo
- Projected year-2 tax
- $2,173 · $181/mo
- Expected delta
- +$849/yr (+$71/mo · 64.1%)
ⓘ Screening estimate from a state-policy table — verify with the county assessor before closing.
Climate risk First Street
- Flood 1/10 Low FEMA zone X (unshaded) · 0% chance over 30 yrs
- Wildfire 4/10 Moderate
- Heat 6/10 Major 7 d/yr ≥106°F today · 17 d/yr by 30 yrs out
- Wind 3/10 Moderate 5% chance of damaging wind over 30 yrs
- Air quality 1/10 Low 0 unhealthy d/yr today · 0 by 30 yrs out
Nearby sold comps map
Loading sold comps map…
Walkable amenities ~0.75 mi
Loading nearby amenities…
Taxation est. · year 1
- Rental income
- $23,039
- − Mortgage interest
- −$14,844
- − Property taxes
- −$1,324
- − Insurance
- −$1,325
- − Repairs & maintenance
- −$1,843
- − Management
- −$1,843
- − Depreciation
- −$7,709
- Taxable loss
- −$5,850
- Est. tax savings @ 24.0%
- +$1,404
- After-tax cash flow
- $279/yr
For passive investors: Depreciation is non-cash, so a rental often shows a tax loss while cash-flowing — sheltering income. Rental losses are passive: they offset passive income freely, and up to $25,000/yr can offset ordinary (W-2) income if you actively participate and your MAGI is under $100k (phasing out to $0 by $150k); unused losses carry forward. On sale, claimed depreciation is recaptured at up to 25%, and gains may owe capital-gains tax (a 1031 exchange can defer both). Figures are a year-1 estimate at your 24.0% rate — not tax advice; consult a CPA.
Schools (NCES district)
- District
- Louisa County Public School District
- NCES district ID
- 5102280
- Math proficiency
- 64% ▼ -21.00%
- Reading proficiency
- 77% ▬ 0.00%
- Median HH income
- $55,036
- Composite
- 60.21/100
- National rank
- #862
- State rank
- #19 of 131 in VA
Livability — Blue Ridge Shores
- Score
- 57/100
- State rank
- #501
- US rank
- #22206
Category grades
Schools grade is shown separately in the Schools card above.
Census & demographics
- Population (ZIP)
- 14,243
Population outlook (Louisa County) Hauer SSP2
- Today (2025)
- 36,941 people
- By 2030
- 37,752 · +2.2%
- By 2040
- 38,605 · +4.5%
- By 2050
- 38,480 · +4.2%
- By 2075
- 38,011 · +2.9%
- By 2100
- 34,748 · -5.9%
Race, ethnicity, and origin ACS 2023
- Neighborhood character
- Predominantly White (71%)
- Race & ethnicity
- White 71% Black 17% Two or more races 8% Hispanic / Latino 3%
- Common ancestry
- Lithuanian 3% Slovak 3% Italian 3%
- Foreign-born
- 4% · Canada
- Languages at home
- 94% English-only · Other Indo-European 3% Spanish 2%
Political lean MEDSL · Louisa
- 2024 margin
- Strong R (+26.2) · D 36.5% · R 62.7%
- 2008→2024 swing
- -18.4pp toward R · 2008: -7.8pp · 2024: -26.2pp
- All cycles
- 2024: R+26.2 2020: R+22.9 2016: R+24.6 2012: R+13.8 2008: R+7.8
Not yet ingested
- Civics
- —
Market trends
- HPI YoY
- ▼ -38.32%
- Current HPI
- 217.8884
- Rent YoY
- —
- Metro
- —
- State GDP YoY
- ▲ 2.40%
- F500 in state
- 50
Industry mix (Fortune 500 HQ in VA)
| Industry | F500 HQs | Revenue |
|---|---|---|
| Aerospace / Defense | 4 | $236B |
|
||
| Technology / Defense | 3 | $32B |
|
||
| Financial Services | 2 | $176B |
|
||
| Utilities | 2 | $27B |
|
||
| Insurance | 2 | $25B |
|
||
| Technology | 2 | $15B |
|
||
Price history
2 events — show timeline
- 2026-04-22 Pending — BRIGHT MLS
- 2026-04-03 Listed $265,000 BRIGHT MLS
Property tax history
+32.0%/yrLatest (2024): $1,324 · +15.3% YoY. Source: county tax records.
Cash-flow waterfall
monthlySold comps — $/sqft
last 12 mo · ≤1 miLoading sold comps…