 Multi-family
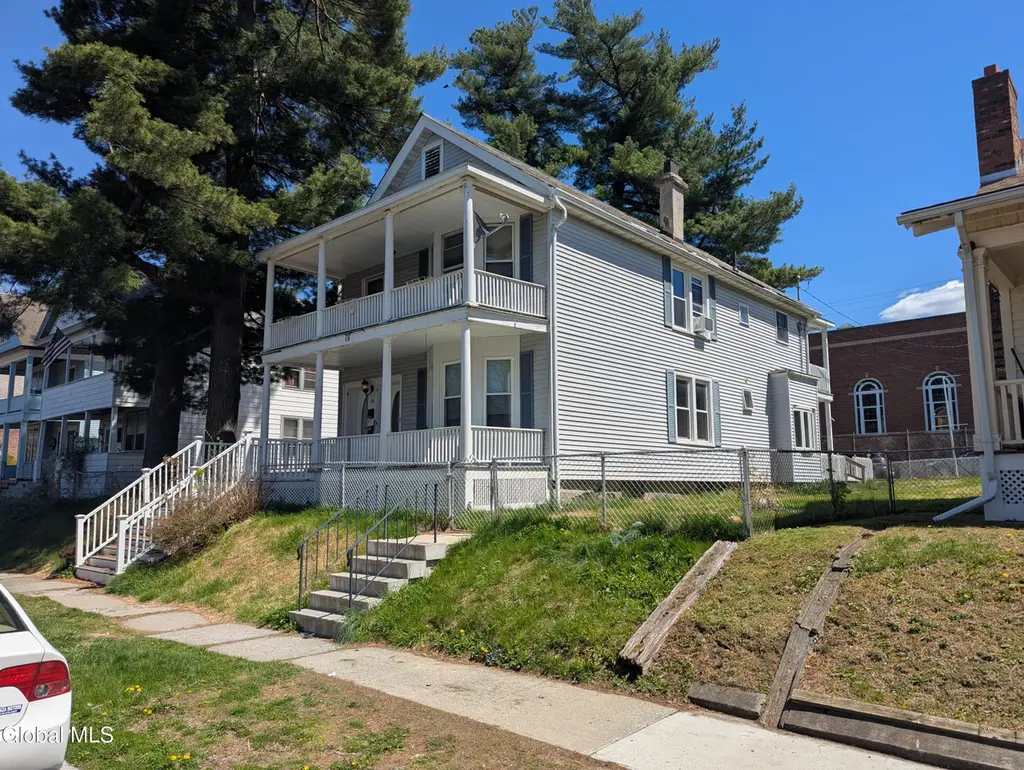
330 7th Ave · Troy, NY
Flood risk 1/10 · Minimal
- FEMA flood zone
- X
- Chance of flooding over 30 yrs
- 0.0%
- Est. flood insurance / yr
- $473 – $860
Fire risk 4/10 · Minor
- Est. fire insurance / yr
- $691 – $1,283
Heat risk 4/10 · Minor
- Hot days now (above 95°F)
- 8 days/yr
- Hot days in 30 yrs
- 18 days/yr
Wind risk 3/10 · Minor
- Chance of severe wind over 30 yrs
- 6.0%
Air-quality risk 2/10 · Minimal
- Unhealthy air days now
- 0 days/yr
- Unhealthy air days in 30 yrs
- 1 days/yr
Risk factors via First Street. Map © Google.
Why this score? — see what drove the C+ grade
The composite is a weighted blend of 9 inputs, each scored 0–100. Each bar is that input's sub-score; the figure is the points it added to the 100-point composite (weight × sub-score).
- Cash flow +23.1/30.0
- ARV discount +13.4/15.0
- DSCR +7.4/10.0
- 1% rule +6.0/10.0
- Livability +4.0/5.0
- Schools +2.8/10.0
- Rent growth +2.5/5.0
- Condition / age +2.2/5.0
- Appreciation +0.0/10.0
$299,900
🖨 Deal sheet (PDF) 📄 Offer letter ✓ Due diligence
Multi-family units
County records classify this as Multi-Family (2-4 Unit). Listing-text estimate: 1 unit. estimate disagrees with records
Listing remarks
Nice house with rear porches, side yard and excellent garage. Backs up to Lansingburgh HS. Live in one, rent the other or add to you portfolio.
Key facts
- Rear porches
- Side yard
- Excellent garage
Tags
Property features AI
Finance
- Other: Lot approximately 0.21 acres
- Financial info: Multi-family: 2 total units; Tenants pay hot water, electricity, and gas; Owner pays water, sewer, trash collection and snow removal
Exterior
- Parking: Detached garage with 2 garage spaces (2 total parking spaces)
- Security: Smoke detector(s); Carbon monoxide detector(s)
- Utilities: Public water; Public sewer
- Home design: Duplex; Two-unit property; Brick/mortar foundation; Aluminum siding
- Construction: Aluminum siding construction; Brick/mortar foundation
- Exterior features: Front porch; Fenced yard; Detached garages / garage structures
Interior
- Bedrooms: Unit 1: 3 bedrooms (first level); Unit 2: 2 bedrooms (first level)
- Bathrooms: Two full bathrooms (both on first level) — one per unit
- Heating & cooling: Forced air heating
- Interior features: Full basement; Smoke and carbon monoxide detectors
Neighborhood map
What this means for you Summary
Snapshot
- This is a 5-bed/2.0-bath multifamily listed at $300k. Condition is rated fair.
Deal economics
- At list price, monthly cash flow is $538 ($6k/yr) — positive.
- The deal already cash-flows at list — no discount required.
- Meets the 1% rule at list price ($3k rent vs $300k).
- Recommended offer: $291k (3.0% below list) — sets the bar for market timing.
- Cap rate 8.4% vs local median 5.3% in Troy — top-decile yield for the area; either an underpriced asset or a hidden risk that comps aren't pricing in. Stress-test before assuming the spread holds.
Location & tenants
- Location reads 81/100 on livability (#88 in NY, #1,350 nationally) — a professional / high-income tenant draw. Strengths: amenities A+, commute A+, housing A+; Watch: employment C-, crime F.
- Lansingburgh Central School District (urban): math 31% / reading 35% proficiency, ranked #566 of 590 in NY (top 96%) — families likely to look elsewhere, expect single-tenant / working-renter base with shorter leases.
- Zoned schools: Turnpike Elementary School (534 students, 61% FRL); Knickerbacker Middle School (math 15% / reading 35%, grade F, #601 of 729 statewide, top 82%, 471 students, 75% FRL); Lansingburgh Senior High School (math 92%, 638 students, 75% FRL) — zoned schools average 70% FRL vs 51% district-wide (19 pts higher); higher-poverty schools than district average — tighter screening recommended.
- Market conditions: 76 active listings in the ZIP; 405 units permitted in Rensselaer County in 2024 (224 in 5+ unit buildings).
Forward outlook
- Local home prices are declining (-3.0%/yr); year-one equity from $2k of loan paydown is wiped out by about $9k of value loss. Plan a longer hold.
- Rensselaer County population projected to shrink 6% by 2050 — rents likely to lag national; underwrite the cash flow, not the appreciation.
Negotiation context
- It's been on market 52 days — a 3% lower offer ($291k) is reasonable based on typical stale-listing flexibility.
Risks & watch-outs
- Watch-outs: built in 1950 — expect roof / HVAC / electrical / plumbing capex.
Questions for the listing agent
- It's been on market 52 days. Have you received any prior offers? Is the seller open to a 3% concession, seller financing, or rate buy-down credit?
- Have any recent inspections been done? Can we get a copy of the seller's disclosures and any deferred-maintenance estimates?
- Built in 1950 — when were the roof, HVAC, electrical panel, plumbing, and water heater last replaced?
- Is there a deadline driving the sale (1031 exchange, divorce, estate, relocation)? That informs how much negotiation room exists.
- Crime grade is F in this area — have there been break-ins, vandalism, or insurance claims at this property in the last 3 years? What carrier currently insures it and at what premium?
- What's the average days-on-market for RENTAL listings here right now (not sales)? A rising rental-DOM trend means longer vacancies and softer asking-rent achievability than the comps imply.
- What's the recent tenant-quality profile in this submarket — average credit score on applications, eviction rate, late-payment / NSF rate, and stable-employment percentage? A property-management company in the area should have these aggregated.
- How much new apartment / multifamily construction is in the pipeline within 1–3 miles? Heavy new supply (>2% of stock underway) typically softens rents 12–24 months out; light construction supports rent growth.
Investment metrics
- 1% rule
- 1.10% ✓
- Cap rate
- 8.45%
- Cash-on-cash
- 7.69%
- DSCR
- 1.34
- GRM
- 7.6
CMA / ARV
- ARV (median comp)
- $345,226
- List price
- $299,900
- Delta
- -13.13%
- Verdict
- UNDERPRICED
- Comps
- 20 within 1.0 mi
Show comp detail 12 sales within ~0.75 mi
| Address | Dist | Beds/Ba | Sqft | Sold | Price | $/sf | Match |
|---|---|---|---|---|---|---|---|
| 172 6th Ave | 0.44mi | 6/2.0 (+1) | 2,454 (-5%) | 1mo | $220,000 | $90 | 65 |
| 343 4th Ave | 0.22mi | 6/4.0 (+1) | 2,652 (+3%) | 8mo | $290,000 | $109 | 65 |
| 288 5th Ave | 0.18mi | 6/2.0 (+1) | 2,216 (-14%) | 4mo | $140,000 | $63 | 60 |
| 289 5th Ave | 0.19mi | 6/3.0 (+1) | 2,288 (-11%) | 9mo | $255,000 | $111 | 56 |
| 83 2nd Ave | 0.69mi | 6/3.0 (+1) | 2,608 (+1%) | 2mo | $375,000 | $144 | 54 |
| 137 2nd Ave | 0.58mi | 6/2.0 (+1) | 2,396 (-7%) | 3mo | $220,000 | $92 | 54 |
| 146 6th Ave | 0.51mi | 6/2.5 (+1) | 2,770 (+8%) | 5mo | $265,000 | $96 | 52 |
| 147 7th Ave | 0.52mi | 6/2.0 (+1) | 2,368 (-8%) | 9mo | $200,000 | $84 | 50 |
| 106 Continental Ave | 0.75mi | 6/2.0 (+1) | 2,388 (-7%) | 1mo | $250,000 | $105 | 48 |
| 46 112th St | 0.37mi | 6/2.0 (+1) | 2,224 (-14%) | 10mo | $121,000 | $54 | 47 |
| 145 7th Ave | 0.53mi | 6/2.0 (+1) | 2,292 (-11%) | 8mo | $264,250 | $115 | 45 |
| 58 6th Ave | 0.73mi | 6/2.0 (+1) | 2,424 (-6%) | 8mo | $270,000 | $111 | 45 |
Match score weights: distance 35% · size 25% · config 20% · recency 20%. Top-matched comps best support the ARV.
Projected returns pro-forma
-3.0% appreciation · 3.0% rent growth · sell at horizon
- IRR
- -4.5%
- Equity multiple
- 0.83×
- Total profit
- $-14,255
- Equity at exit
- $44,716
- IRR
- 5.2%
- Equity multiple
- 1.38×
- Total profit
- $31,945
- Equity at exit
- $25,930
Cash invested: $83,972 (down + closing). Projections, not guarantees.
Landlord ↔ Tenant lean methodology
- Overall (STATE)
- 15 Strongly Tenant-Friendly
- State New York
- 15 Strongly Tenant-Friendly · D+10
- County
- — inherits STATE
- City
- — inherits STATE
ZIP-level market 12182
- Home prices YoY
- -15.6%
- Active inventory
- 76
- Price-to-rent
- 15.5×
Monthly cashflow live
- Estimated rent
- $3,305 high interval (Pro) →
- Mortgage (P&I)
- −$1,573
- Tax est. 1.5%
- −$375 /mo · $4,498/yr
- Insurance
- −$125
- HOA
- −$0
- Lot rent
- −$0
- Vacancy / Maint / Mgmt
- −$694
- Net cashflow
- $538
Break-even live
Sensitivity live
| Price | -10% $746 | -5% $642 | +0% $538 | +5% $435 | +10% $331 |
|---|---|---|---|---|---|
| Rent | -10% $277 | -5% $408 | +0% $538 | +5% $669 | +10% $800 |
| Rate | -1.0pp $689 | -0.5pp $615 | base $538 | +0.5pp $461 | +1.0pp $382 |
2-unit breakdown (identical units grouped — click to expand)
| Units | Beds | Baths | Est. rent |
|---|---|---|---|
| 1× unit | 2 | 1 | $1,617 |
| 1× unit | 3 | 1 | $1,688 |
| Total (2 units) | $3,305 | ||
UW: 25.0% down · 7.5% · 30yr · 1.5% tax · 5.0% vac · 8.0% maint · 8.0% mgmt
Financing live
Cash to close
- Down payment
- $74,975
- Closing costs
- $8,997
- Reserves months
- —
- Total cash needed
- —
Loan-product check · same deal, 3 products live
Conventional
25% down · 7.5% · 30yr
- Down + closing
- —
- Monthly P&I
- —
- Monthly cashflow
- —
- DSCR
- —
- Eligible?
- —
Personal DTI + credit; lowest rate.
DSCR
20% down · 8.5% · 30yr
- Down + closing
- —
- Monthly P&I
- —
- Monthly cashflow
- —
- DSCR
- —
- Eligible?
- —
No personal income docs; deal must DSCR.
Hard money
10% down · 12.0% · 12mo
- Down + closing
- —
- Monthly P&I
- —
- Monthly cashflow
- —
- DSCR
- —
- Eligible?
- —
Short-term bridge; refi at stabilization.
Listing history 17 events
-
2026-06-22days on market $299,900 Active 52 DOM
-
2026-06-18days on market $299,900 Active 49 DOM
-
2026-06-17days on market $299,900 Active 48 DOM
-
2026-06-16days on market $299,900 Active 47 DOM
-
2026-06-15days on market $299,900 Active 46 DOM
-
2026-06-14days on market $299,900 Active 44 DOM
-
2026-06-10days on market $299,900 Active 41 DOM
-
2026-06-09days on market $299,900 Active 40 DOM
-
2026-06-08days on market $299,900 Active 39 DOM
-
2026-06-07days on market $299,900 Active 38 DOM
-
2026-06-05days on market $299,900 Active 35 DOM
-
2026-06-03days on market $299,900 Active 34 DOM
-
2026-06-02days on market $299,900 Active 33 DOM
-
2026-06-01days on market $299,900 Active 32 DOM
-
2026-05-31days on market $299,900 Active 31 DOM
-
2026-05-31days on market $299,900 Active 30 DOM
-
2026-04-28$299,900 Active 143-char remark
ⓘ Source: listings_history table (triggers on properties + properties_extension) + one-shot
backfill from property_details.listing_events for pre-trigger history.
Climate risk First Street
- Flood 1/10 Low FEMA zone X · 0% chance over 30 yrs
- Wildfire 4/10 Moderate
- Heat 4/10 Moderate 8 d/yr ≥95°F today · 18 d/yr by 30 yrs out
- Wind 3/10 Moderate 6% chance of damaging wind over 30 yrs
- Air quality 2/10 Low 0 unhealthy d/yr today · 1 by 30 yrs out
Nearby sold comps map
Loading sold comps map…
Walkable amenities ~0.75 mi
Loading nearby amenities…
Taxation est. · year 1
- Rental income
- $39,660
- − Mortgage interest
- −$16,799
- − Property taxes
- −$4,498
- − Insurance
- −$1,500
- − Repairs & maintenance
- −$3,173
- − Management
- −$3,173
- − Depreciation
- −$8,724
- Taxable income
- $1,793
- Est. tax owed @ 24.0%
- −$430
- After-tax cash flow
- $6,031/yr
For passive investors: Depreciation is non-cash, so a rental often shows a tax loss while cash-flowing — sheltering income. Rental losses are passive: they offset passive income freely, and up to $25,000/yr can offset ordinary (W-2) income if you actively participate and your MAGI is under $100k (phasing out to $0 by $150k); unused losses carry forward. On sale, claimed depreciation is recaptured at up to 25%, and gains may owe capital-gains tax (a 1031 exchange can defer both). Figures are a year-1 estimate at your 24.0% rate — not tax advice; consult a CPA.
Condition & rehab AI · 2 photos
This multi-family home requires significant exterior repairs and maintenance, including a new roof, exterior painting, and landscaping. These improvements would significantly enhance its resale and rental value.
Repairs flagged
- Major roof — Significant wear and potential leaks
- Major siding — Visible wear and potential rot
- Major paint — Faded and peeling
- Major landscaping — Sparse and in poor condition
- Major fencing — In poor condition
Value-add opportunities
- Resale roof replacement — A new roof would significantly improve the home's curb appeal and value
- Resale exterior painting — Fresh paint would improve the home's appearance and curb appeal
- Both landscaping and fencing repair — A well-maintained exterior would improve both resale and rental value
Renovation cost estimate screening
| Repair item | Severity | Est. cost |
|---|---|---|
| roof · Significant wear and potential leaks | Major | $15,000–50,000 |
| siding · Visible wear and potential rot | Major | $15,000–50,000 |
| paint · Faded and peeling | Major | $15,000–50,000 |
| landscaping · Sparse and in poor condition | Major | $15,000–50,000 |
| fencing · In poor condition | Major | $15,000–50,000 |
| Total estimated repair cost · 5 items | $75,000–250,000 |
Value-add ROI direction
- Resale roof replacement — A new roof would significantly improve the home's curb appeal and value ↑
- Resale exterior painting — Fresh paint would improve the home's appearance and curb appeal ↑
- Both landscaping and fencing repair — A well-maintained exterior would improve both resale and rental value ↑
ⓘ Cost ranges are severity-bucket heuristics (US national rule-of-thumb). Get contractor quotes + a written scope before underwriting a rehab budget.
Schools (NCES district)
- District
- Lansingburgh Central School District
- NCES district ID
- 3616740
- Math proficiency
- 31% ▼ -7.00%
- Reading proficiency
- 35% ▼ -6.00%
- Median HH income
- $44,807
- Composite
- 28.19/100
- National rank
- #6810
- State rank
- #566 of 590 in NY
Livability — Troy
- Score
- 81/100
- State rank
- #88
- US rank
- #1350
Category grades
Schools grade is shown separately in the Schools card above.
Census & demographics
- Census place
- Troy, NY
- City population
- 53,479
- Population (ZIP)
- 14,273
Population outlook (Rensselaer County) Hauer SSP2
- Today (2025)
- 162,400 people
- By 2030
- 161,746 · -0.4%
- By 2040
- 158,095 · -2.7%
- By 2050
- 152,966 · -5.8%
- By 2075
- 140,767 · -13.3%
- By 2100
- 124,727 · -23.2%
Race, ethnicity, and origin ACS 2023
- Neighborhood character
- Predominantly White (70%)
- Race & ethnicity
- White 70% Black 14% Two or more races 12% Hispanic / Latino 7%
- Hispanic origin (detail)
- Puerto Rican 6%
- Common ancestry
- Lithuanian 7% Romanian 3% Iranian 1%
- Foreign-born
- 3% · Canada, Jamaica
- Languages at home
- 94% English-only · Spanish 4% Other Indo-European 1%
Political lean MEDSL · Rensselaer
- 2024 margin
- Toss-up / Even · D 50.7% · R 49.3%
- 2008→2024 swing
- -8.0pp toward R · 2008: 9.3pp · 2024: 1.4pp
- All cycles
- 2024: D+1.4 2020: D+5.6 2016: R+2.9 2012: D+11.8 2008: D+9.3
Not yet ingested
- Civics
- —
Market trends
- HPI YoY
- ▼ -50.58%
- Current HPI
- 273.5758
- Rent YoY
- —
- Metro
- —
- State GDP YoY
- ▲ 2.60%
- F500 in state
- 92
Industry mix (Fortune 500 HQ in NY)
| Industry | F500 HQs | Revenue |
|---|---|---|
| Financial Services | 10 | $950B |
|
||
| Consumer Goods | 9 | $162B |
|
||
| Insurance | 4 | $225B |
|
||
| Telecommunications | 2 | $144B |
|
||
| Pharmaceuticals | 2 | $112B |
|
||
| Media / Entertainment | 2 | $69B |
|
||
Price history
1 event — show timeline
- 2026-04-28 Listed $299,900 Global MLS
Cash-flow waterfall
monthlySold comps — $/sqft
last 12 mo · ≤1 miLoading sold comps…