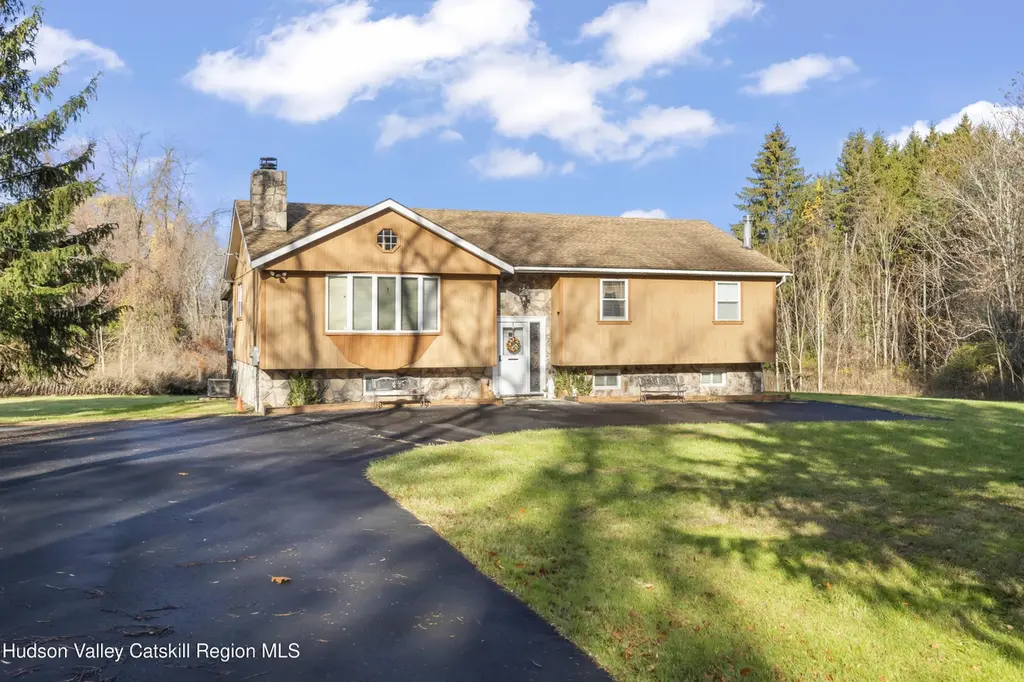
134 Willowbrook Road Rd · Claverack-Red Mills, NY
Flood risk 1/10 · Minimal
- FEMA flood zone
- X
- Chance of flooding over 30 yrs
- 0.0%
- Est. flood insurance / yr
- $473 – $860
Fire risk 5/10 · Moderate
- Est. fire insurance / yr
- $691 – $1,283
Heat risk 3/10 · Minor
- Hot days now (above 95°F)
- 7 days/yr
- Hot days in 30 yrs
- 14 days/yr
Wind risk 3/10 · Minor
- Chance of severe wind over 30 yrs
- 9.0%
Air-quality risk 2/10 · Minimal
- Unhealthy air days now
- 1 days/yr
- Unhealthy air days in 30 yrs
- 2 days/yr
Risk factors via First Street. Map © Google.
Why this score? — see what drove the D grade
The composite is a weighted blend of 9 inputs, each scored 0–100. Each bar is that input's sub-score; the figure is the points it added to the 100-point composite (weight × sub-score).
- Appreciation +10.0/10.0
- ARV discount +8.8/15.0
- Cash flow +6.2/30.0
- Rent growth +5.0/5.0
- Schools +3.6/10.0
- Condition / age +2.8/5.0
- Livability +2.5/5.0
- 1% rule +1.5/10.0
- DSCR +0.6/10.0
$500,000
🖨 Deal sheet (PDF) 📄 Offer letter ✓ Due diligence
Listing remarks MLS
Picturesque country location, this 5 bedroom, 2 bath raised ranch on 4 acres is being offered for the first time. Nicely set back from a quiet road, built in 1980, this home features a living room with wood burning fireplace, dining room with direct access to a screened in porch, well equipped eat-in kitchen, 3 bedrooms and a full bath on the first floor. The lower level includes 2 additional bedrooms, a familyroom, bath and utility room with laundry area. Detached garage with workshop completes the property. An additional 4 acre parcel with pond also available. Nicely secluded yet only a few minutes from Hudson.
Key facts
- Screened in porch
- Eat-in kitchen
- Workshop
Tags
Neighborhood map
What this means for you Summary
Snapshot
- This is a 5-bed/2.0-bath single-family listed at $500k. Condition is rated average.
Deal economics
- At list price, monthly cash flow is $-903 ($-11k/yr) — negative.
- To cash-flow at today's rent, offer at most $369k (26.1% below list).
- To meet the 1% rule (rent ≥ 1% of price), the offer needs to be $323k (35.4% below list).
- Recommended offer: $323k (35.4% below list) — sets the bar for 1% rule.
Location & tenants
- Location reads: area grade D — affects rentability + tenant quality, not the cash-flow math above.
- Hudson City School District (town): math 38% / reading 47% proficiency, ranked #494 of 590 in NY (top 84%) — families likely to look elsewhere, expect single-tenant / working-renter base with shorter leases.
- Zoned schools: Montgomery C Smith Elementary School (math 36% / reading 47%, grade F, #1,409 of 2,108 statewide, top 67%, 723 students, 65% FRL); Hudson Junior High School (math 20% / reading 36%, grade F, #573 of 729 statewide, top 79%, 384 students, 63% FRL); Hudson High School (math 82% / reading 84%, grade A, #435 of 1,100 statewide, top 40%, 454 students, 57% FRL).
- Market conditions: Rents rising fast (+10.9%/yr); 162 active listings in the ZIP; 136 units permitted in Columbia County in 2024 (0 in 5+ unit buildings).
- At $3,231/mo this rent would consume 53% of the median local household income ($73k/yr) (locally 1083% of renters already pay >50% of income on rent) — very limited rent-growth headroom before tenants either downsize or default.
Forward outlook
- In year one you build about $53k of equity ($3k loan paydown + $50k appreciation (10.0% local appreciation)).
- Columbia County population projected at -22% by 2050 — secular population decline; favor cash flow + early exit over multi-decade hold.
- By year 2, paydown + projected appreciation supports a ~$86k cash-out refi (75% LTV) — recoverable capital for the next deal without selling this one.
Negotiation context
- It's been on market 221 days — a 12% lower offer ($440k) is reasonable based on typical stale-listing flexibility.
Risks & watch-outs
- Climate carrying-cost: moderate wildfire risk — expect insurance premiums to compound above CPI over the hold.
Questions for the listing agent
- What do current leases actually rent for vs. the listed asking? Can we see a recent rent roll and the last 12 months of T-12 income?
- It's been on market 221 days. Have you received any prior offers? Is the seller open to a 35% concession, seller financing, or rate buy-down credit?
- Why hasn't it sold? Are there any deal-killer items the seller is aware of (foundation, flood, title, zoning, code violations)?
- Is there a deadline driving the sale (1031 exchange, divorce, estate, relocation)? That informs how much negotiation room exists.
- The area grade is low — what's the realistic commute time and amenity access for the typical tenant pool here? Any planned neighborhood developments (good or bad) we should know about?
- What's the average days-on-market for RENTAL listings here right now (not sales)? A rising rental-DOM trend means longer vacancies and softer asking-rent achievability than the comps imply.
- What's the recent tenant-quality profile in this submarket — average credit score on applications, eviction rate, late-payment / NSF rate, and stable-employment percentage? A property-management company in the area should have these aggregated.
- How much new for-sale + rental construction is in the pipeline within 1–3 miles? Heavy new supply typically softens prices + rents 12–24 months out; constrained supply supports both.
Investment metrics
- 1% rule
- 0.65% ✗
- Cap rate
- 4.13%
- Cash-on-cash
- -7.74%
- DSCR
- 0.66
- GRM
- 12.9
CMA / ARV
- ARV (median comp)
- $514,857
- List price
- $500,000
- Delta
- -2.89%
- Verdict
- FAIR
- Comps
- 2 within 2.0 mi
Show comp detail 1 sale within ~0.75 mi
| Address | Dist | Beds/Ba | Sqft | Sold | Price | $/sf | Match |
|---|---|---|---|---|---|---|---|
| 160 Willowbrook Rd | 0.11mi | 5/3.0 | 2,552 (-12%) | 0mo | $499,500 | $196 | 71 |
Match score weights: distance 35% · size 25% · config 20% · recency 20%. Top-matched comps best support the ARV.
Projected returns pro-forma
10.0% appreciation · 8.0% rent growth · sell at horizon
- IRR
- 20.1%
- Equity multiple
- 2.66×
- Total profit
- $231,935
- Equity at exit
- $450,440
- IRR
- 19.5%
- Equity multiple
- 6.50×
- Total profit
- $770,629
- Equity at exit
- $971,390
Cash invested: $140,000 (down + closing). Projections, not guarantees.
Landlord ↔ Tenant lean methodology
- Overall (STATE)
- 15 Strongly Tenant-Friendly
- State New York
- 15 Strongly Tenant-Friendly · D+10
- County
- — inherits STATE
- City
- — inherits STATE
ZIP-level market 12534
- Home prices YoY
- 5.6%
- Rents YoY
- 10.9%
- Active inventory
- 162
- Price-to-rent
- 12.9×
Monthly cashflow live
- Estimated rent
- $3,231 medium interval (Pro) →
- Mortgage (P&I)
- −$2,622
- Tax est. 1.5%
- −$625 /mo · $7,500/yr
- Insurance
- −$208
- HOA
- −$0
- Vacancy / Maint / Mgmt
- −$679
- Net cashflow
- $-903
Break-even live
Sensitivity live
| Price | -10% $-557 | -5% $-730 | +0% $-903 | +5% $-1,076 | +10% $-1,248 |
|---|---|---|---|---|---|
| Rent | -10% $-1,158 | -5% $-1,030 | +0% $-903 | +5% $-775 | +10% $-648 |
| Rate | -1.0pp $-651 | -0.5pp $-776 | base $-903 | +0.5pp $-1,032 | +1.0pp $-1,164 |
UW: 25.0% down · 7.5% · 30yr · 1.5% tax · 5.0% vac · 8.0% maint · 8.0% mgmt
Financing live
Cash to close
- Down payment
- $125,000
- Closing costs
- $15,000
- Reserves months
- —
- Total cash needed
- —
Loan-product check · same deal, 3 products live
Conventional
25% down · 7.5% · 30yr
- Down + closing
- —
- Monthly P&I
- —
- Monthly cashflow
- —
- DSCR
- —
- Eligible?
- —
Personal DTI + credit; lowest rate.
DSCR
20% down · 8.5% · 30yr
- Down + closing
- —
- Monthly P&I
- —
- Monthly cashflow
- —
- DSCR
- —
- Eligible?
- —
No personal income docs; deal must DSCR.
Hard money
10% down · 12.0% · 12mo
- Down + closing
- —
- Monthly P&I
- —
- Monthly cashflow
- —
- DSCR
- —
- Eligible?
- —
Short-term bridge; refi at stabilization.
Listing history 18 events
-
2026-06-21days on market $500,000 Active 221 DOM
-
2026-06-19days on market $500,000 Active 219 DOM
-
2026-06-18days on market $500,000 Active 218 DOM
-
2026-06-17days on market $500,000 Active 217 DOM
-
2026-06-16days on market $500,000 Active 216 DOM
-
2026-06-15days on market $500,000 Active 215 DOM
-
2026-06-14days on market $500,000 Active 213 DOM
-
2026-06-12days on market $500,000 Active 212 DOM
-
2026-06-09days on market $500,000 Active 209 DOM
-
2026-06-09remarks 638-char remark
-
2026-06-08days on market $500,000 Active 208 DOM
-
2026-06-07days on market $500,000 Active 207 DOM
-
2026-06-04days on market $500,000 Active 203 DOM
-
2026-06-02days on market $500,000 Active 202 DOM
-
2026-06-01days on market $500,000 Active 201 DOM
-
2026-05-31days on market $500,000 Active 200 DOM
-
2026-05-31days on market $500,000 Active 199 DOM
-
2025-11-11$500,000 Active 620-char remark
Show marketing remark (620 chars)
Picturesque country location, this 5 bedroom, 2 bath raised ranch on 4 acres is being offered for the first time. Nicely set back from a quiet road, built in 1980, this home features a living room with wood burning fireplace, dining room with direct access to a screened in porch, well equipped eat-in kitchen, 3 bedrooms and a full bath on the first floor. The lower level includes 2 additional bedrooms, a familyroom, bath and utility room with laundry area. Detached garage with workshop completes the property. An additional 4 acre parcel with pond also available. Nicely secluded yet only a few minutes from Hudson.
ⓘ Source: listings_history table (triggers on properties + properties_extension) + one-shot
backfill from property_details.listing_events for pre-trigger history.
Climate risk First Street
- Flood 1/10 Low FEMA zone X · 0% chance over 30 yrs
- Wildfire 5/10 Major
- Heat 3/10 Moderate 7 d/yr ≥95°F today · 14 d/yr by 30 yrs out
- Wind 3/10 Moderate 9% chance of damaging wind over 30 yrs
- Air quality 2/10 Low 1 unhealthy d/yr today · 2 by 30 yrs out
Nearby sold comps map
Loading sold comps map…
Walkable amenities ~0.75 mi
Loading nearby amenities…
Taxation est. · year 1
- Rental income
- $38,773
- − Mortgage interest
- −$28,008
- − Property taxes
- −$7,500
- − Insurance
- −$2,500
- − Repairs & maintenance
- −$3,102
- − Management
- −$3,102
- − Depreciation
- −$14,545
- Taxable loss
- −$19,984
- Est. tax savings @ 24.0%
- +$4,796
- After-tax cash flow
- $-6,038/yr
For passive investors: Depreciation is non-cash, so a rental often shows a tax loss while cash-flowing — sheltering income. Rental losses are passive: they offset passive income freely, and up to $25,000/yr can offset ordinary (W-2) income if you actively participate and your MAGI is under $100k (phasing out to $0 by $150k); unused losses carry forward. On sale, claimed depreciation is recaptured at up to 25%, and gains may owe capital-gains tax (a 1031 exchange can defer both). Figures are a year-1 estimate at your 24.0% rate — not tax advice; consult a CPA.
Condition & rehab AI · 12 photos
This 5-bedroom, 2-bath raised ranch home on 4 acres is in average condition and requires moderate renovations to improve its resale and rental value.
Repairs flagged
- Moderate kitchen cabinets — dated and in need of replacement
- Moderate kitchen countertops — dated and in need of replacement
- Moderate kitchen flooring — dated and in need of replacement
- Moderate bathroom tile — dated and in need of replacement
- Moderate bathroom fixtures — dated and in need of replacement
Value-add opportunities
- Resale update kitchen cabinets and countertops — modernizing the kitchen will attract more buyers
- Resale update bathroom tile and fixtures — modernizing the bathroom will attract more buyers
- Both landscaping and curb appeal — improving the landscaping will increase both resale and rental value
Renovation cost estimate screening
| Repair item | Severity | Est. cost |
|---|---|---|
| kitchen cabinets · dated and in need of replacement | Moderate | $3,000–15,000 |
| kitchen countertops · dated and in need of replacement | Moderate | $3,000–15,000 |
| kitchen flooring · dated and in need of replacement | Moderate | $3,000–15,000 |
| bathroom tile · dated and in need of replacement | Moderate | $3,000–15,000 |
| bathroom fixtures · dated and in need of replacement | Moderate | $3,000–15,000 |
| Total estimated repair cost · 5 items | $15,000–75,000 |
Value-add ROI direction
- Resale update kitchen cabinets and countertops — modernizing the kitchen will attract more buyers ↑
- Resale update bathroom tile and fixtures — modernizing the bathroom will attract more buyers ↑
- Both landscaping and curb appeal — improving the landscaping will increase both resale and rental value ↑
ⓘ Cost ranges are severity-bucket heuristics (US national rule-of-thumb). Get contractor quotes + a written scope before underwriting a rehab budget.
Schools (NCES district)
- District
- Hudson City School District
- NCES district ID
- 3614940
- Math proficiency
- 38% ▲ 4.00%
- Reading proficiency
- 47% ▲ 7.00%
- Median HH income
- $44,663
- Composite
- 36.03/100
- National rank
- #4779
- State rank
- #494 of 590 in NY
Livability — Claverack-Red Mills
No livability data for this city. (Only ~50 U.S. cities are tracked.)
Census & demographics
- County
- Columbia County · 17,176 people
- City population
- 198
- Metro
- Hudson, NY
- Population (ZIP)
- 17,176
- Household income
- $72,741
- Rent vs Own
- Severe rent burden
- 1083.0
Population outlook (Columbia County) Hauer SSP2
- Today (2025)
- 58,662 people
- By 2030
- 56,557 · -3.6%
- By 2040
- 51,324 · -12.5%
- By 2050
- 45,790 · -21.9%
- By 2075
- 35,232 · -39.9%
- By 2100
- 25,846 · -55.9%
Race, ethnicity, and origin ACS 2023
- Neighborhood character
- Predominantly White (74%)
- Race & ethnicity
- White 74% Two or more races 7% Black 7% Hispanic / Latino 7% Asian 6%
- Hispanic origin (detail)
- Mexican 2% Puerto Rican 1%
- Common ancestry
- Lithuanian 4% Romanian 4% Iranian 3%
- Foreign-born
- 10% · Canada, China
- Languages at home
- 88% English-only · Spanish 5% Other Indo-European 3% Chinese 1%
Political lean MEDSL · Columbia
- 2024 margin
- D (+14.7) · D 57.4% · R 42.6%
- 2008→2024 swing
- +1.3pp toward D · 2008: 13.4pp · 2024: 14.7pp
- All cycles
- 2024: D+14.7 2020: D+16.7 2016: D+1.4 2012: D+11.7 2008: D+13.4
Not yet ingested
- Civics
- —
Market trends
- HPI YoY
- ▲ 25.98%
- Current HPI
- 490.0412
- Rent YoY
- ▲ 10.88%
- Metro
- Hudson, NY
- State GDP YoY
- ▲ 2.60%
- F500 in state
- 92
Industry mix (Fortune 500 HQ in NY)
| Industry | F500 HQs | Revenue |
|---|---|---|
| Financial Services | 10 | $950B |
|
||
| Consumer Goods | 9 | $162B |
|
||
| Insurance | 4 | $225B |
|
||
| Telecommunications | 2 | $144B |
|
||
| Pharmaceuticals | 2 | $112B |
|
||
| Media / Entertainment | 2 | $69B |
|
||
Price history
1 event — show timeline
- 2025-11-11 Listed $500,000 HVCRMLS
Cash-flow waterfall
monthlySold comps — $/sqft
last 12 mo · ≤1 miLoading sold comps…