3300 N 3 Mile Rd · Clark, MI
Flood risk 1/10 · Minimal
- FEMA flood zone
- X (unshaded)
- Chance of flooding over 30 yrs
- 0.0%
- Est. flood insurance / yr
- $473 – $860
Fire risk 3/10 · Minor
- Est. fire insurance / yr
- $784 – $1,456
Heat risk 1/10 · Minimal
- Hot days now (above 86°F)
- 7 days/yr
- Hot days in 30 yrs
- 13 days/yr
Wind risk 1/10 · Minimal
- Chance of severe wind over 30 yrs
- —
Air-quality risk 2/10 · Minimal
- Unhealthy air days now
- 1 days/yr
- Unhealthy air days in 30 yrs
- 2 days/yr
Risk factors via First Street. Map © Google.
Why this score? — see what drove the D grade
The composite is a weighted blend of 9 inputs, each scored 0–100. Each bar is that input's sub-score; the figure is the points it added to the 100-point composite (weight × sub-score).
- Cash flow +10.9/30.0
- Appreciation +8.3/10.0
- ARV discount +7.5/15.0
- Schools +4.4/10.0
- DSCR +3.2/10.0
- Rent growth +2.5/5.0
- Livability +2.5/5.0
- Condition / age +2.5/5.0
- 1% rule +2.1/10.0
$125,000
🖨 Deal sheet (PDF) 📄 Offer letter ✓ Due diligence
Listing remarks MLS
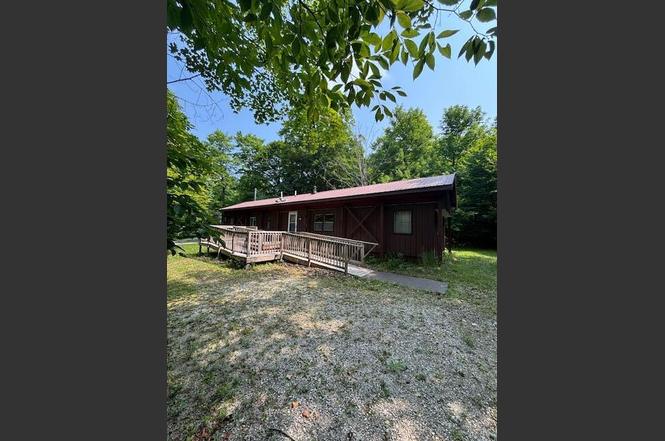
Discover this cozy 2 bedroom, 1 1/2 bath home nestled on a little over 1 acre of beautifully wooded land. Located just minutes from Bear on the Mountain golf course and casino, this property offers convenience. Perfect for nature lovers or a weekend getaway!
Key facts
- Minutes from casino
- Wooded land
- 1.22 acre lot
Tags
Neighborhood map
What this means for you Summary
Snapshot
- This is a 2-bed/1.0-bath single-family listed at $125k.
Deal economics
- At list price, monthly cash flow is $-54 ($-649/yr) — negative.
- To cash-flow at today's rent, offer at most $115k (7.6% below list).
- To meet the 1% rule (rent ≥ 1% of price), the offer needs to be $89k (29.0% below list).
- Recommended offer: $89k (29.0% below list) — sets the bar for 1% rule.
Location & tenants
- Location reads: area grade D — affects rentability + tenant quality, not the cash-flow math above.
- Les Cheneaux Community Schools (rural): math 45% / reading 55% proficiency, ranked #186 of 760 in MI (top 24%) — acceptable for families but not a draw, mixed tenant base, ~2y average lease.
- Market conditions: 19 active listings in the ZIP; 41 units permitted in Mackinac County in 2024 (0 in 5+ unit buildings).
Forward outlook
- In year one you build about $9k of equity ($864 loan paydown + $8k appreciation (6.5% local appreciation)).
- Mackinac County population projected at -18% by 2050 — secular population decline; favor cash flow + early exit over multi-decade hold.
- At projected returns (6.5% appreciation + 3.0% rent growth), your $35k cash investment doubles in ~4 years — after that, you're playing with house money.
- By year 4, paydown + projected appreciation supports a ~$31k cash-out refi (75% LTV) — recoverable capital for the next deal without selling this one.
Negotiation context
- It's been on market 319 days — a 12% lower offer ($110k) is reasonable based on typical stale-listing flexibility.
- Current owner paid $14k; list at $125k implies a 793% gain — meaningful room to come down on a strong offer.
Questions for the listing agent
- What do current leases actually rent for vs. the listed asking? Can we see a recent rent roll and the last 12 months of T-12 income?
- It's been on market 319 days. Have you received any prior offers? Is the seller open to a 29% concession, seller financing, or rate buy-down credit?
- Why hasn't it sold? Are there any deal-killer items the seller is aware of (foundation, flood, title, zoning, code violations)?
- Is there a deadline driving the sale (1031 exchange, divorce, estate, relocation)? That informs how much negotiation room exists.
- The area grade is low — what's the realistic commute time and amenity access for the typical tenant pool here? Any planned neighborhood developments (good or bad) we should know about?
- What's the average days-on-market for RENTAL listings here right now (not sales)? A rising rental-DOM trend means longer vacancies and softer asking-rent achievability than the comps imply.
- What's the recent tenant-quality profile in this submarket — average credit score on applications, eviction rate, late-payment / NSF rate, and stable-employment percentage? A property-management company in the area should have these aggregated.
- How much new for-sale + rental construction is in the pipeline within 1–3 miles? Heavy new supply typically softens prices + rents 12–24 months out; constrained supply supports both.
Investment metrics
- 1% rule
- 0.71% ✗
- Cap rate
- 5.77%
- Cash-on-cash
- -1.85%
- DSCR
- 0.92
- GRM
- 11.7
CMA / ARV
No comps found within radius.
Projected returns pro-forma
6.53% appreciation · 3.0% rent growth · sell at horizon
- IRR
- 15.1%
- Equity multiple
- 2.04×
- Total profit
- $36,544
- Equity at exit
- $82,785
- IRR
- 15.1%
- Equity multiple
- 4.12×
- Total profit
- $109,165
- Equity at exit
- $153,896
Cash invested: $35,000 (down + closing). Projections, not guarantees.
Landlord ↔ Tenant lean methodology
- Overall (STATE)
- 62 Landlord-Friendly
- State Michigan
- 62 Landlord-Friendly · EVEN
- County
- — inherits STATE
- City
- — inherits STATE
ZIP-level market 49745
- Home prices YoY
- 3.3%
- Active inventory
- 19
- Price-to-rent
- 11.7×
Monthly cashflow live
- Estimated rent
- $887 medium interval (Pro) →
- Mortgage (P&I)
- −$656
- Tax from tax record
- −$47 /mo · $567/yr
- Insurance
- −$52
- HOA
- −$0
- Vacancy / Maint / Mgmt
- −$186
- Net cashflow
- $-54
Break-even live
Sensitivity live
| Price | -10% $17 | -5% $-19 | +0% $-54 | +5% $-89 | +10% $-125 |
|---|---|---|---|---|---|
| Rent | -10% $-124 | -5% $-89 | +0% $-54 | +5% $-19 | +10% $16 |
| Rate | -1.0pp $9 | -0.5pp $-22 | base $-54 | +0.5pp $-86 | +1.0pp $-119 |
UW: 25.0% down · 7.5% · 30yr · 1.5% tax · 5.0% vac · 8.0% maint · 8.0% mgmt
Financing live
Cash to close
- Down payment
- $31,250
- Closing costs
- $3,750
- Reserves months
- —
- Total cash needed
- —
Loan-product check · same deal, 3 products live
Conventional
25% down · 7.5% · 30yr
- Down + closing
- —
- Monthly P&I
- —
- Monthly cashflow
- —
- DSCR
- —
- Eligible?
- —
Personal DTI + credit; lowest rate.
DSCR
20% down · 8.5% · 30yr
- Down + closing
- —
- Monthly P&I
- —
- Monthly cashflow
- —
- DSCR
- —
- Eligible?
- —
No personal income docs; deal must DSCR.
Hard money
10% down · 12.0% · 12mo
- Down + closing
- —
- Monthly P&I
- —
- Monthly cashflow
- —
- DSCR
- —
- Eligible?
- —
Short-term bridge; refi at stabilization.
Listing history 21 events
-
2026-06-21days on market $125,000 Active 319 DOM
-
2026-06-21days on market $125,000 Active 318 DOM
-
2026-06-18days on market $125,000 Active 316 DOM
-
2026-06-17days on market $125,000 Active 315 DOM
-
2026-06-16days on market $125,000 Active 314 DOM
-
2026-06-15days on market $125,000 Active 313 DOM
-
2026-06-13days on market $125,000 Active 311 DOM
-
2026-06-12days on market $125,000 Active 310 DOM
-
2026-06-09days on market $125,000 Active 307 DOM
-
2026-06-08days on market $125,000 Active 306 DOM
-
2026-06-07days on market $125,000 Active 305 DOM
-
2026-06-05days on market $125,000 Active 303 DOM
-
2026-06-04days on market $125,000 Active 301 DOM
-
2026-06-02days on market $125,000 Active 300 DOM
-
2026-06-01days on market $125,000 Active 299 DOM
-
2026-05-31days on market $125,000 Active 298 DOM
-
2026-05-31days on market $125,000 Active 297 DOM
-
2025-09-19price $125,000 258-char remark
Show marketing remark (258 chars)
Discover this cozy 2 bedroom, 1 1/2 bath home nestled on a little over 1 acre of beautifully wooded land. Located just minutes from Bear on the Mountain golf course and casino, this property offers convenience. Perfect for nature lovers or a weekend getaway!
-
2025-08-06$150,000 Active 258-char remark
Show marketing remark (258 chars)
Discover this cozy 2 bedroom, 1 1/2 bath home nestled on a little over 1 acre of beautifully wooded land. Located just minutes from Bear on the Mountain golf course and casino, this property offers convenience. Perfect for nature lovers or a weekend getaway!
-
2007-08-21soldstatus $14,000
-
1989-12-07soldstatus $14,000
ⓘ Source: listings_history table (triggers on properties + properties_extension) + one-shot
backfill from property_details.listing_events for pre-trigger history.
Tax reassessment forecast MI · Partial reset (capped growth)
- Current annual tax
- $567 · $47/mo
- Projected year-2 tax
- $1,246 · $104/mo
- Expected delta
- +$679/yr (+$57/mo · 119.7%)
ⓘ Screening estimate from a state-policy table — verify with the county assessor before closing.
Climate risk First Street
- Flood 1/10 Low FEMA zone X (unshaded) · 0% chance over 30 yrs
- Wildfire 3/10 Moderate
- Heat 1/10 Low 7 d/yr ≥86°F today · 13 d/yr by 30 yrs out
- Wind 1/10 Low
- Air quality 2/10 Low 1 unhealthy d/yr today · 2 by 30 yrs out
Nearby sold comps map
Loading sold comps map…
Walkable amenities ~0.75 mi
Loading nearby amenities…
Taxation est. · year 1
- Rental income
- $10,645
- − Mortgage interest
- −$7,002
- − Property taxes
- −$567
- − Insurance
- −$625
- − Repairs & maintenance
- −$852
- − Management
- −$852
- − Depreciation
- −$3,636
- Taxable loss
- −$2,889
- Est. tax savings @ 24.0%
- +$693
- After-tax cash flow
- $44/yr
For passive investors: Depreciation is non-cash, so a rental often shows a tax loss while cash-flowing — sheltering income. Rental losses are passive: they offset passive income freely, and up to $25,000/yr can offset ordinary (W-2) income if you actively participate and your MAGI is under $100k (phasing out to $0 by $150k); unused losses carry forward. On sale, claimed depreciation is recaptured at up to 25%, and gains may owe capital-gains tax (a 1031 exchange can defer both). Figures are a year-1 estimate at your 24.0% rate — not tax advice; consult a CPA.
Schools (NCES district)
- District
- Les Cheneaux Community Schools
- NCES district ID
- 2621420
- Math proficiency
- 45% ▬ 0.00%
- Reading proficiency
- 55% ▲ 10.00%
- Median HH income
- $43,042
- Composite
- 44.12/100
- National rank
- #6228
- State rank
- #186 of 760 in MI
Livability — Clark
No livability data for this city. (Only ~50 U.S. cities are tracked.)
Census & demographics
- Population (ZIP)
- 819
Population outlook (Mackinac County) Hauer SSP2
- Today (2025)
- 10,449 people
- By 2030
- 10,075 · -3.6%
- By 2040
- 9,220 · -11.8%
- By 2050
- 8,595 · -17.7%
- By 2075
- 7,996 · -23.5%
- By 2100
- 7,434 · -28.9%
Race, ethnicity, and origin ACS 2023
- Neighborhood character
- Diverse neighborhood (Simpson 0.59)
- Race & ethnicity
- White 64% Native American 31% Two or more races 6%
- Common ancestry
- Lithuanian 6% German 1% Romanian 1%
- Foreign-born
- 1%
Political lean MEDSL · Mackinac
- 2024 margin
- Strong R (+24.9) · D 37.0% · R 61.8% · Other 1.2%
- 2008→2024 swing
- -21.1pp toward R · 2008: -3.8pp · 2024: -24.9pp
- All cycles
- 2024: R+24.9 2020: R+23.8 2016: R+27.2 2012: R+12.2 2008: R+3.8
Not yet ingested
- Civics
- —
Market trends
- HPI YoY
- ▲ 6.53%
- Current HPI
- 206.3107
- Rent YoY
- —
- Metro
- —
- State GDP YoY
- ▲ 1.37%
- F500 in state
- 28
Industry mix (Fortune 500 HQ in MI)
| Industry | F500 HQs | Revenue |
|---|---|---|
| Automotive Parts | 3 | $48B |
|
||
| Automotive | 2 | $372B |
|
||
| Chemicals | 1 | $45B |
|
||
| Automotive Retail | 1 | $29B |
|
||
| Healthcare / Medical Devices | 1 | $23B |
|
||
| Automotive Technology | 1 | $20B |
|
||
Price history
+792.9% since first listed4 events — show timeline
- 2025-09-19 Price Changed $125,000 EUPBR
- 2025-08-06 Listed $150,000 EUPBR
- 2007-08-21 Sold (Public Records) $14,000 Public Records
- 1989-12-07 Sold (Public Records) $14,000 Public Records
Property tax history
+6.4%/yrLatest (2023): $567 · +315.4% YoY. Source: county tax records.
Cash-flow waterfall
monthlySold comps — $/sqft
last 12 mo · ≤1 miLoading sold comps…