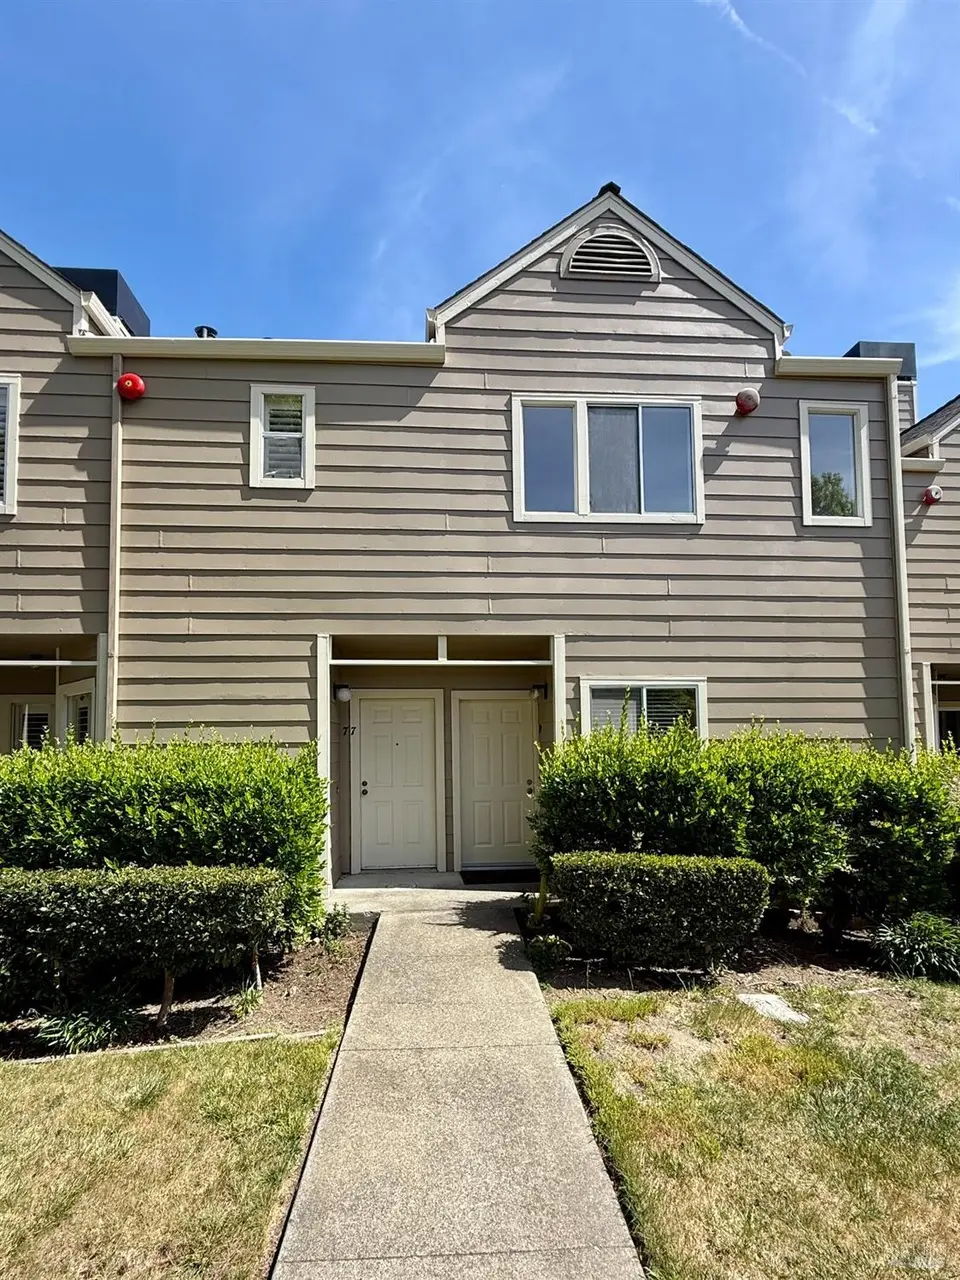
77 Parkview Cir · Corte Madera, CA
Flood risk 1/10 · Minimal
- FEMA flood zone
- X (unshaded)
- Chance of flooding over 30 yrs
- 0.0%
- Est. flood insurance / yr
- $507 – $1,088
Fire risk 3/10 · Minor
- Est. fire insurance / yr
- $659 – $1,223
Heat risk 3/10 · Minor
- Hot days now (above 83°F)
- 8 days/yr
- Hot days in 30 yrs
- 17 days/yr
Wind risk 1/10 · Minimal
- Chance of severe wind over 30 yrs
- —
Air-quality risk 8/10 · Major
- Unhealthy air days now
- 13 days/yr
- Unhealthy air days in 30 yrs
- 13 days/yr
Risk factors via First Street. Map © Google.
Why this score? — see what drove the D+ grade
The composite is a weighted blend of 9 inputs, each scored 0–100. Each bar is that input's sub-score; the figure is the points it added to the 100-point composite (weight × sub-score).
- Cash flow +10.3/30.0
- Appreciation +8.5/10.0
- ARV discount +7.5/15.0
- Schools +6.5/10.0
- Livability +4.2/5.0
- 1% rule +3.8/10.0
- DSCR +3.0/10.0
- Rent growth +2.5/5.0
- Condition / age +2.5/5.0
$428,700
🖨 Deal sheet 📄 Offer letter ✓ Due diligence
Listing remarks
This is a below market rate property - must be owner occupied, and resale restrictions apply. Maximum annual income is $178,300 for 2 people/$200,500 for 3/ $222,850 for 4. Buyer can not have owned a home in the last 3 years. Applications must be received by 5/14/2026 and a lottery will be drawn. 2-person minimum household. Tucked within the desirable Meadowcreek community, this beautifully refreshed upper-level residence offers the perfect blend of comfort, convenience, and Marin lifestyle living. Surrounded by scenic walking paths, open greenbelt areas, and nearby waterways, the home enjoys a peaceful setting while remaining just minutes from Highway 101, shopping, and dining. Recently up
Key facts
- Nearby waterways
- Scenic walking paths
- New water heater
Tags
Property features AI
Finance
- HOA & community: Part of Meadowcreek Station association; Monthly HOA fee of $689; HOA covers structure insurance, exterior maintenance, roof and management; Community has a park
Exterior
- Parking: Detached garage with garage door opener (1 car); Total parking for 1 vehicle
- Utilities: Public sewer
- Home design: Condominium; Residential property; Two-story building; Main entry level contains bedroom(s), full bath(s), kitchen and living room
- Construction: No ADU/second unit
- Exterior features: Covered deck; Front landscaping
Interior
- Kitchen: Disposal; Free-standing electric range; Free-standing refrigerator
- Bedrooms: 2 bedrooms; Main level bedrooms
- Flooring: Carpet; Vinyl
- Bathrooms: 1 full bathroom with tub/shower combination
- Heating & cooling: Central heating; No cooling
- Interior features: Quartz countertops in kitchen; Covered deck off living room; Dining and living room combined; No basement; Street-level entrance on lower level
- Laundry & utility: Washer/Dryer stacked included; Laundry located in kitchen; Electric water heater
Neighborhood map
What this means for you Summary
Snapshot
- This is a 2-bed/1.0-bath condo listed at $429k.
Deal economics
- At list price, monthly cash flow is $-232 ($-3k/yr) — negative.
- To cash-flow at today's rent, offer at most $388k (9.6% below list).
- To meet the 1% rule (rent ≥ 1% of price), the offer needs to be $379k (11.6% below list).
- Recommended offer: $379k (11.6% below list) — sets the bar for 1% rule.
- Cap rate 5.6% vs local median 1.9% in Corte Madera — top-decile yield for the area; either an underpriced asset or a hidden risk that comps aren't pricing in. Stress-test before assuming the spread holds.
Location & tenants
- Location reads 83/100 on livability (#26 in CA, #984 nationally) — a professional / high-income tenant draw. Strengths: schools A+, commute A+, employment A+; Watch: cost of living F.
- Tamalpais Union High (suburban): math 62% / reading 78% proficiency, ranked #42 of 517 in CA (top 8%) — strong family-tenant draw, lease renewals of 3-5y typical.
- Market conditions: 40 active listings in the ZIP; 17 comparable units currently listed for rent nearby; rentals leasing fast (median 2d on market — plan ~1-2 weeks tenant-placement turnaround); high-income renter base; 149 units permitted in Marin County in 2024 (5 in 5+ unit buildings).
Forward outlook
- In year one you build about $33k of equity ($3k loan paydown + $30k appreciation (7.0% local appreciation)).
- Marin County population projected at +9% by 2050 — modest demand growth; plan on rents tracking national, not racing it.
- By year 2, paydown + projected appreciation supports a ~$53k cash-out refi (75% LTV) — recoverable capital for the next deal without selling this one.
Negotiation context
- It's been on market 57 days — a 3% lower offer ($416k) is reasonable based on typical stale-listing flexibility.
- Current owner paid $63k; list at $429k implies a 583% gain — meaningful room to come down on a strong offer.
Questions for the listing agent
- What do current leases actually rent for vs. the listed asking? Can we see a recent rent roll and the last 12 months of T-12 income?
- It's been on market 57 days. Have you received any prior offers? Is the seller open to a 12% concession, seller financing, or rate buy-down credit?
- What does the HOA fee cover, when was the last increase, and are there any pending special assessments or reserve-fund shortfalls?
- Any open or pending special assessments — roof, HVAC, plumbing, elevator, façade? What's the per-unit balance and payoff schedule, and is the seller paying it off at close or rolling it to the buyer?
- Is there a deadline driving the sale (1031 exchange, divorce, estate, relocation)? That informs how much negotiation room exists.
- Schools are A-rated — typically a magnet for longer-tenancy family renters. What's the average tenant stay here, and is there a school-zone premium baked into asking?
- The area grade is low — what's the realistic commute time and amenity access for the typical tenant pool here? Any planned neighborhood developments (good or bad) we should know about?
- What's the average days-on-market for RENTAL listings here right now (not sales)? A rising rental-DOM trend means longer vacancies and softer asking-rent achievability than the comps imply.
- What's the recent tenant-quality profile in this submarket — average credit score on applications, eviction rate, late-payment / NSF rate, and stable-employment percentage? A property-management company in the area should have these aggregated.
- How much new apartment / multifamily construction is in the pipeline within 1–3 miles? Heavy new supply (>2% of stock underway) typically softens rents 12–24 months out; light construction supports rent growth.
Investment metrics
- 1% rule
- 0.88% ✗
- Cap rate
- 5.64%
- Cash-on-cash
- -2.32%
- DSCR
- 0.90
- GRM
- 9.4
CMA / ARV
No comps found within radius.
Projected returns pro-forma
7.05% appreciation · 3.0% rent growth · sell at horizon
- IRR
- 16.0%
- Equity multiple
- 2.14×
- Total profit
- $136,327
- Equity at exit
- $298,360
- IRR
- 15.7%
- Equity multiple
- 4.40×
- Total profit
- $407,647
- Equity at exit
- $567,914
Cash invested: $120,036 (down + closing). Projections, not guarantees.
Landlord ↔ Tenant lean methodology
- Overall (STATE)
- 18 Strongly Tenant-Friendly
- State California
- 18 Strongly Tenant-Friendly · D+13
- County
- — inherits STATE
- City
- — inherits STATE
ZIP-level market 94925
- Home prices YoY
- 2.4%
- Active inventory
- 40
- Price-to-rent
- 9.4×
Monthly cashflow live
- Estimated rent
- $3,789 high interval (Pro) →
- Mortgage (P&I)
- −$2,248
- Tax from tax record
- −$110 /mo · $1,321/yr
- Insurance
- −$179
- HOA
- −$689
- Vacancy / Maint / Mgmt
- −$796
- Net cashflow
- $-232
Break-even live
UW: 25.0% down · 7.5% · 30yr · 1.5% tax · 5.0% vac · 8.0% maint · 8.0% mgmt
Financing live
Cash to close
- Down payment
- $107,175
- Closing costs
- $12,861
- Reserves months
- —
- Total cash needed
- —
Loan-product check · same deal, 3 products live
Conventional
25% down · 7.5% · 30yr
- Down + closing
- —
- Monthly P&I
- —
- Monthly cashflow
- —
- DSCR
- —
- Eligible?
- —
Personal DTI + credit; lowest rate.
DSCR
20% down · 8.5% · 30yr
- Down + closing
- —
- Monthly P&I
- —
- Monthly cashflow
- —
- DSCR
- —
- Eligible?
- —
No personal income docs; deal must DSCR.
Hard money
10% down · 12.0% · 12mo
- Down + closing
- —
- Monthly P&I
- —
- Monthly cashflow
- —
- DSCR
- —
- Eligible?
- —
Short-term bridge; refi at stabilization.
Rent comps 17 comps
| Address | Beds | Baths | Sqft | Rent | $/sqft | DOM | Units | Dist |
|---|---|---|---|---|---|---|---|---|
| 5491 Paradise Dr Corte Madera, CA | 2.0 | 2.0 | 800 | $3,800 | $4.75 | 2d | 1 | 0.33mi |
| 56 N Knoll Rd Mill Valley, CA | 2.0 | 1.0 | 800 | $3,250 | $4.06 | 2d | 1 | 0.76mi |
| 1030 Redwood Hwy Unit 9 Mill Valley, CA | 1.0 | 1.0 | 600 | $2,850 | $4.75 | 10d | 1 | 0.91mi |
| 19 Knoll Ln Unit A Mill Valley, CA | 2.0 | 1.0 | 722 | $2,999 | $4.15 | 3d | 1 | 0.95mi |
| 16 S Knoll Rd Unit 127 Mill Valley, CA | 1.0 | 1.0 | 900 | $2,550 | $2.83 | 13d | 1 | 0.98mi |
| 16 S Knoll Rd Unit 124 Mill Valley, CA | 1.0 | 1.0 | 900 | $2,550 | $2.83 | 19d | 1 | 0.98mi |
| 16 S Knoll Rd Unit 102 Mill Valley, CA | 2.0 | 1.0 | 1100 | $3,200 | $2.91 | 13d | 1 | 0.99mi |
| 16 S Knoll Rd Unit 102 Mill Valley, CA | 2.0 | 1.0 | 1100 | $3,200 | $2.91 | 2d | 1 | 0.99mi |
| 19 Pixley Ave Corte Madera, CA | 2.0 | 1.0 | 870 | $3,350 | $3.85 | 2d | 1 | 1.26mi |
| 21 Circle Dr Belvedere Tiburon, CA | 2.0 | 2.0 | 900 | $3,000 | $3.33 | 2d | 1 | 1.29mi |
| 573 Seaver Dr Mill Valley, CA | 1.0 | 1.0 | 696 | $3,295 | $4.73 | 2d | 1 | 1.30mi |
| 45 Tamal Vista Blvd Corte Madera, CA | 2.0 | 1.0 | 890 | $2,950 | $3.31 | 2d | 1 | 1.32mi |
| 45 Tamal Vista Blvd Corte Madera, CA | 2.0 | 1.0 | 890 | $2,950 | $3.31 | 19d | 1 | 1.32mi |
| 32 Circle Dr Unit A Belvedere Tiburon, CA | 2.0 | 2.0 | 1025 | $3,900 | $3.80 | 2d | 1 | 1.36mi |
| 32 Circle Dr Unit B Belvedere Tiburon, CA | 2.0 | 2.0 | 1025 | $3,800 | $3.71 | 17d | 1 | 1.36mi |
| 58 Barbaree Way Tiburon, CA | 2.0 | 2.0 | 1020 | $6,500 | $6.37 | 2d | 1 | 1.37mi |
| 50 Barbaree Way Belvedere Tiburon, CA | 1.0–3.0 | 1.0–3.0 | 985 | $6,727 | $6.83 | 2d | 23 | 1.39mi |
HOA detail condo
- Monthly dues
- $689 · $8,268/yr
- Likely covers
- water
- Assessments
- None detected in remarks — confirm with the listing agent.
Listing history 16 events
-
2026-06-18days on market $428,700 Active 57 DOM
-
2026-06-17days on market $428,700 Active 56 DOM
-
2026-06-16days on market $428,700 Active 55 DOM
-
2026-06-15days on market $428,700 Active 54 DOM
-
2026-06-13days on market $428,700 Active 52 DOM
-
2026-06-13days on market $428,700 Active 51 DOM
-
2026-06-09days on market $428,700 Active 48 DOM
-
2026-06-08days on market $428,700 Active 47 DOM
-
2026-06-07days on market $428,700 Active 46 DOM
-
2026-06-04days on market $428,700 Active 43 DOM
-
2026-06-03days on market $428,700 Active 42 DOM
-
2026-06-02days on market $428,700 Active 41 DOM
-
2026-06-01days on market $428,700 Active 40 DOM
-
2026-05-31days on market $428,700 Active 39 DOM
-
2026-04-20$428,700 Active
-
1988-12-30soldstatus $62,800
ⓘ Source: listings_history table (triggers on properties + properties_extension) + one-shot
backfill from property_details.listing_events for pre-trigger history.
Tax reassessment forecast CA · Resets to sale price
- Current annual tax
- $1,321 · $110/mo
- Projected year-2 tax
- $3,258 · $272/mo
- Expected delta
- +$1,937/yr (+$161/mo · 146.6%)
ⓘ Screening estimate from a state-policy table — verify with the county assessor before closing.
Climate risk First Street
- Flood 1/10 Low FEMA zone X (unshaded) · 0% chance over 30 yrs
- Wildfire 3/10 Moderate
- Heat 3/10 Moderate 8 d/yr ≥83°F today · 17 d/yr by 30 yrs out
- Wind 1/10 Low
- Air quality 8/10 Severe 13 unhealthy d/yr today · 13 by 30 yrs out
Nearby sold comps map
Loading sold comps map…
Walkable amenities ~0.75 mi
Loading nearby amenities…
Taxation est. · year 1
- Rental income
- $45,471
- − Mortgage interest
- −$24,014
- − Property taxes
- −$1,321
- − Insurance
- −$2,144
- − Repairs & maintenance
- −$3,638
- − Management
- −$3,638
- − HOA
- −$8,268
- − Depreciation
- −$12,471
- Taxable loss
- −$10,022
- Est. tax savings @ 24.0%
- +$2,405
- After-tax cash flow
- $-383/yr
For passive investors: Depreciation is non-cash, so a rental often shows a tax loss while cash-flowing — sheltering income. Rental losses are passive: they offset passive income freely, and up to $25,000/yr can offset ordinary (W-2) income if you actively participate and your MAGI is under $100k (phasing out to $0 by $150k); unused losses carry forward. On sale, claimed depreciation is recaptured at up to 25%, and gains may owe capital-gains tax (a 1031 exchange can defer both). Figures are a year-1 estimate at your 24.0% rate — not tax advice; consult a CPA.
Schools (NCES district)
- District
- Tamalpais Union High
- NCES district ID
- 0638790
- Math proficiency
- 62% ▲ 4.00%
- Reading proficiency
- 78% ▲ 6.00%
- Median HH income
- $106,037
- Composite
- 64.66/100
- National rank
- #527
- State rank
- #42 of 517 in CA
Livability — Corte Madera
- Score
- 83/100
- State rank
- #26
- US rank
- #984
Category grades
Schools grade is shown separately in the Schools card above.
Census & demographics
- Census place
- Corte Madera, CA
- County
- Marin County · 243,328 people
- City population
- 10,077
- Metro
- San Francisco-Oakland-Berkeley, CA
- Population (ZIP)
- 10,077
- Household income
- $232,763
- Rent vs Own
- Severe rent burden
- 169.0
Population outlook (Marin County) Hauer SSP2
- Today (2025)
- 276,379 people
- By 2030
- 282,942 · +2.4%
- By 2040
- 292,937 · +6.0%
- By 2050
- 300,449 · +8.7%
- By 2075
- 316,946 · +14.7%
- By 2100
- 303,948 · +10.0%
Race, ethnicity, and origin ACS 2023
- Neighborhood character
- Predominantly White (72%)
- Race & ethnicity
- White 72% Hispanic / Latino 12% Two or more races 12% Asian 6% Black 1%
- Hispanic origin (detail)
- Mexican 7%
- Common ancestry
- Romanian 5% Italian 5% Lithuanian 3%
- Foreign-born
- 12% · Canada, South Korea, China
- Languages at home
- 84% English-only · Spanish 6% Other Indo-European 5% German/W. Germanic 1%
Political lean MEDSL · Marin
- 2024 margin
- Solid D (+63.9) · D 80.6% · R 16.7% · Other 2.7%
- 2008→2024 swing
- +6.2pp toward D · 2008: 57.7pp · 2024: 63.9pp
- All cycles
- 2024: D+63.9 2020: D+66.5 2016: D+62.9 2012: D+50.5 2008: D+57.7
Not yet ingested
- Civics
- —
Market trends
- HPI YoY
- ▲ 7.05%
- Current HPI
- 298.9243
- Rent YoY
- —
- Metro
- San Francisco-Oakland-Berkeley, CA
- State GDP YoY
- ▲ 3.21%
- F500 in state
- 116
Industry mix (Fortune 500 HQ in CA)
| Industry | F500 HQs | Revenue |
|---|---|---|
| Technology | 27 | $1,492B |
|
||
| Financial Services | 3 | $174B |
|
||
| Retail | 3 | $44B |
|
||
| Insurance | 3 | $26B |
|
||
| Media / Entertainment | 2 | $115B |
|
||
| Pharmaceuticals / Biotech | 2 | $62B |
|
||
Price history
+582.6% since first listed2 events — show timeline
- 2026-04-20 Listed $428,700 BAREIS
- 1988-12-30 Sold (Public Records) $62,800 Public Records
Property tax history
-3.0%/yrLatest (2025): $1,321 · -67.4% YoY. Source: county tax records.
Cash-flow waterfall
monthlySold comps — $/sqft
last 12 mo · ≤1 miLoading sold comps…