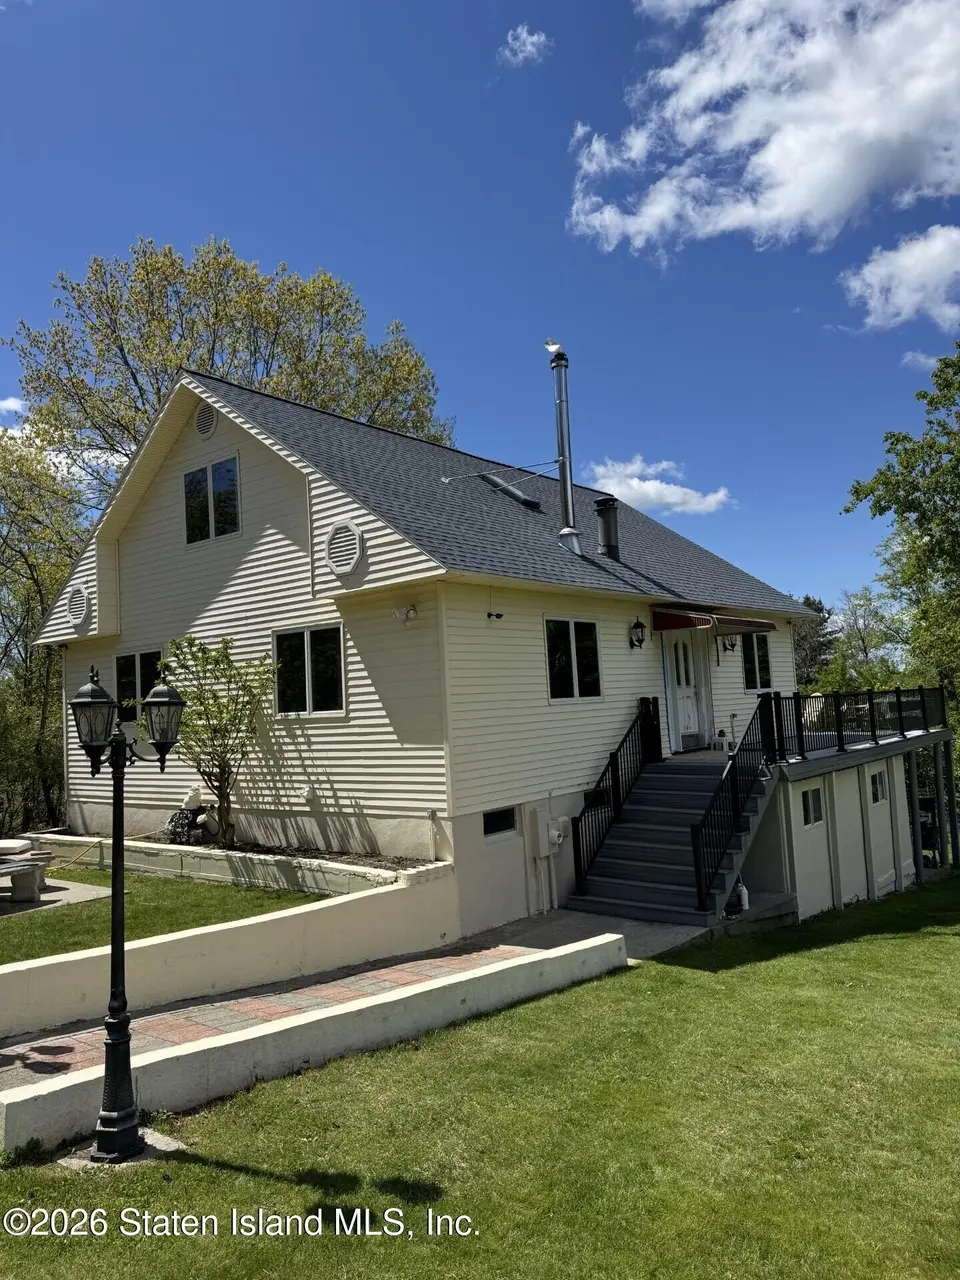
21 Hedges Rd · Copake Lake, NY
Flood risk 1/10 · Minimal
- FEMA flood zone
- X
- Chance of flooding over 30 yrs
- 0.0%
- Est. flood insurance / yr
- $473 – $860
Fire risk 5/10 · Moderate
- Est. fire insurance / yr
- $691 – $1,283
Heat risk 3/10 · Minor
- Hot days now (above 93°F)
- 7 days/yr
- Hot days in 30 yrs
- 16 days/yr
Wind risk 4/10 · Minor
- Chance of severe wind over 30 yrs
- 11.0%
Air-quality risk 2/10 · Minimal
- Unhealthy air days now
- 1 days/yr
- Unhealthy air days in 30 yrs
- 2 days/yr
Risk factors via First Street. Map © Google.
Why this score? — see what drove the D grade
The composite is a weighted blend of 9 inputs, each scored 0–100. Each bar is that input's sub-score; the figure is the points it added to the 100-point composite (weight × sub-score).
- Appreciation +10.0/10.0
- Cash flow +7.8/30.0
- ARV discount +7.5/15.0
- Schools +4.5/10.0
- Livability +3.1/5.0
- Rent growth +2.5/5.0
- Condition / age +2.5/5.0
- DSCR +1.9/10.0
- 1% rule +1.6/10.0
$850,000
🖨 Deal sheet (PDF) 📄 Offer letter ✓ Due diligence
Listing remarks
This beautiful move in ready lakeview home sits on a private street in a perfect location. Step right into this fully furnished freshly painted home which features hardwood floors throughout, formal living room with a woodburner fireplace, newly renovated eat-in kitchen with granite countertops, and high end appliances. Two bedrooms with a main bathroom offering a jacuzzi. Walking up into the second floor features two additional bedrooms with a beautiful full glass window wall view of serene Copake Lake and country club golf course. A full bath that offers a skylight and plenty of storage space. Fully finished tile and hardwood floor combination that has a playroom and a study room along wi
Key facts
- Private street
- Woodburner fireplace
- Lakeview home
Tags
Property features AI
Exterior
- Parking: On-street parking
- Utilities: 220V electrical service; Septic tank
- Home design: Single-family residence; 3 stories; Approximately built (year approx); Excellent condition
- Construction: Stucco and vinyl siding exterior
- Exterior features: Balcony; Side lot; Waterview
Interior
- Kitchen: Dishwasher; Microwave
- Bathrooms: 3 full bathrooms
- Heating & cooling: Oil heating; Other heating; Central air conditioning
- Interior features: Fireplace; Skylights; Finished basement; Central air
- Laundry & utility: Washer; Dryer
Neighborhood map
What this means for you Summary
Snapshot
- This is a 4-bed/3.0-bath single-family listed at $850k.
Deal economics
- At list price, monthly cash flow is $-949 ($-11k/yr) — negative.
- To cash-flow at today's rent, offer at most $682k (19.7% below list).
- To meet the 1% rule (rent ≥ 1% of price), the offer needs to be $563k (33.8% below list).
- Recommended offer: $563k (33.8% below list) — sets the bar for 1% rule.
- Cap rate 5.0% vs local median 2.4% in Copake Lake — top-decile yield for the area; either an underpriced asset or a hidden risk that comps aren't pricing in. Stress-test before assuming the spread holds.
Location & tenants
- Location reads 62/100 on livability (#841 in NY) — a middle-class / working-renter tenant base. Strengths: employment A+, housing A+; Watch: amenities F, commute F, cost of living F.
- Taconic Hills Central School District (rural): math 53% / reading 51% proficiency, ranked #335 of 590 in NY (top 57%) — acceptable for families but not a draw, mixed tenant base, ~2y average lease.
- Zoned schools: Taconic Hills Elementary School (math 53% / reading 50%, grade C-, #1,041 of 2,108 statewide, top 50%, 562 students, 57% FRL); Taconic Hillsjunior/Senior High School (math 52% / reading 52%, grade D+, #946 of 1,100 statewide, top 88%, 502 students, 45% FRL).
- Market conditions: 42 active listings in the ZIP; 136 units permitted in Columbia County in 2024 (0 in 5+ unit buildings).
Forward outlook
- In year one you build about $91k of equity ($6k loan paydown + $85k appreciation (10.0% local appreciation)).
- Columbia County population projected at -22% by 2050 — secular population decline; favor cash flow + early exit over multi-decade hold.
- By year 2, paydown + projected appreciation supports a ~$146k cash-out refi (75% LTV) — recoverable capital for the next deal without selling this one.
Negotiation context
- It's been on market 34 days — a 3% lower offer ($824k) is reasonable based on typical stale-listing flexibility.
- Current owner paid $35k; list at $850k implies a 2329% gain — meaningful room to come down on a strong offer.
Risks & watch-outs
- Climate carrying-cost: moderate wildfire risk — expect insurance premiums to compound above CPI over the hold.
Questions for the listing agent
- What do current leases actually rent for vs. the listed asking? Can we see a recent rent roll and the last 12 months of T-12 income?
- It's been on market 34 days. Have you received any prior offers? Is the seller open to a 34% concession, seller financing, or rate buy-down credit?
- Is there a deadline driving the sale (1031 exchange, divorce, estate, relocation)? That informs how much negotiation room exists.
- Schools are D-rated, which usually means shorter tenancies and higher turnover. Who's the typical renter profile here, and what's been the actual vacancy rate?
- The area grade is low — what's the realistic commute time and amenity access for the typical tenant pool here? Any planned neighborhood developments (good or bad) we should know about?
- What's the average days-on-market for RENTAL listings here right now (not sales)? A rising rental-DOM trend means longer vacancies and softer asking-rent achievability than the comps imply.
- What's the recent tenant-quality profile in this submarket — average credit score on applications, eviction rate, late-payment / NSF rate, and stable-employment percentage? A property-management company in the area should have these aggregated.
- How much new for-sale + rental construction is in the pipeline within 1–3 miles? Heavy new supply typically softens prices + rents 12–24 months out; constrained supply supports both.
Investment metrics
- 1% rule
- 0.66% ✗
- Cap rate
- 4.95%
- Cash-on-cash
- -4.78%
- DSCR
- 0.79
- GRM
- 12.6
CMA / ARV
- ARV (on-the-fly)
- $2,011,150
- Comps found
- 3
Show comp detail 3 sales within ~0.75 mi
| Address | Dist | Beds/Ba | Sqft | Sold | Price | $/sf | Match |
|---|---|---|---|---|---|---|---|
| 225 Lakeview Rd | 0.10mi | 4/4.5 | 2,910 (+6%) | 10mo | $2,125,000 | $730 | 71 |
| 250 Island Dr | 0.39mi | 3/3.0 (-1) | 2,720 (-1%) | 7mo | $2,000,000 | $735 | 69 |
| 16 Wang Dr | 0.06mi | 3/4.0 (-1) | 2,500 (-9%) | 10mo | $915,750 | $366 | 64 |
Match score weights: distance 35% · size 25% · config 20% · recency 20%. Top-matched comps best support the ARV.
Projected returns pro-forma
10.0% appreciation · 3.0% rent growth · sell at horizon
- IRR
- 20.9%
- Equity multiple
- 2.69×
- Total profit
- $402,309
- Equity at exit
- $765,747
- IRR
- 18.9%
- Equity multiple
- 6.18×
- Total profit
- $1,231,829
- Equity at exit
- $1,651,363
Cash invested: $238,000 (down + closing). Projections, not guarantees.
Landlord ↔ Tenant lean methodology
- Overall (STATE)
- 15 Strongly Tenant-Friendly
- State New York
- 15 Strongly Tenant-Friendly · D+10
- County
- — inherits STATE
- City
- — inherits STATE
ZIP-level market 12521
- Home prices YoY
- 23.4%
- Active inventory
- 42
- Price-to-rent
- 12.6×
Monthly cashflow live
- Estimated rent
- $5,631 medium interval (Pro) →
- Mortgage (P&I)
- −$4,457
- Tax from tax record
- −$585 /mo · $7,026/yr
- Insurance
- −$354
- HOA
- −$0
- Vacancy / Maint / Mgmt
- −$1,183
- Net cashflow
- $-949
Break-even live
Sensitivity live
| Price | -10% $-467 | -5% $-708 | +0% $-949 | +5% $-1,189 | +10% $-1,430 |
|---|---|---|---|---|---|
| Rent | -10% $-1,393 | -5% $-1,171 | +0% $-949 | +5% $-726 | +10% $-504 |
| Rate | -1.0pp $-521 | -0.5pp $-732 | base $-949 | +0.5pp $-1,169 | +1.0pp $-1,393 |
UW: 25.0% down · 7.5% · 30yr · 1.5% tax · 5.0% vac · 8.0% maint · 8.0% mgmt
Financing live
Cash to close
- Down payment
- $212,500
- Closing costs
- $25,500
- Reserves months
- —
- Total cash needed
- —
Loan-product check · same deal, 3 products live
Conventional
25% down · 7.5% · 30yr
- Down + closing
- —
- Monthly P&I
- —
- Monthly cashflow
- —
- DSCR
- —
- Eligible?
- —
Personal DTI + credit; lowest rate.
DSCR
20% down · 8.5% · 30yr
- Down + closing
- —
- Monthly P&I
- —
- Monthly cashflow
- —
- DSCR
- —
- Eligible?
- —
No personal income docs; deal must DSCR.
Hard money
10% down · 12.0% · 12mo
- Down + closing
- —
- Monthly P&I
- —
- Monthly cashflow
- —
- DSCR
- —
- Eligible?
- —
Short-term bridge; refi at stabilization.
Listing history 19 events
-
2026-06-22days on market $850,000 Active 34 DOM
-
2026-06-19days on market $850,000 Active 31 DOM
-
2026-06-18days on market $850,000 Active 30 DOM
-
2026-06-17days on market $850,000 Active 29 DOM
-
2026-06-16days on market $850,000 Active 28 DOM
-
2026-06-15days on market $850,000 Active 27 DOM
-
2026-06-14days on market $850,000 Active 25 DOM
-
2026-06-12days on market $850,000 Active 24 DOM
-
2026-06-09days on market $850,000 Active 21 DOM
-
2026-06-08days on market $850,000 Active 20 DOM
-
2026-06-07days on market $850,000 Active 19 DOM
-
2026-06-07days on market $850,000 Active 18 DOM
-
2026-06-04days on market $850,000 Active 15 DOM
-
2026-06-02days on market $850,000 Active 14 DOM
-
2026-06-01days on market $850,000 Active 13 DOM
-
2026-05-31days on market $850,000 Active 12 DOM
-
2026-05-31days on market $850,000 Active 11 DOM
-
2026-05-19$850,000 Active
-
1993-09-30soldstatus $35,000
ⓘ Source: listings_history table (triggers on properties + properties_extension) + one-shot
backfill from property_details.listing_events for pre-trigger history.
Tax reassessment forecast NY · Partial reset (capped growth)
- Current annual tax
- $7,026 · $585/mo
- Projected year-2 tax
- $10,695 · $891/mo
- Expected delta
- +$3,670/yr (+$306/mo · 52.2%)
ⓘ Screening estimate from a state-policy table — verify with the county assessor before closing.
Climate risk First Street
- Flood 1/10 Low FEMA zone X · 0% chance over 30 yrs
- Wildfire 5/10 Major
- Heat 3/10 Moderate 7 d/yr ≥93°F today · 16 d/yr by 30 yrs out
- Wind 4/10 Moderate 11% chance of damaging wind over 30 yrs
- Air quality 2/10 Low 1 unhealthy d/yr today · 2 by 30 yrs out
Nearby sold comps map
Loading sold comps map…
Walkable amenities ~0.75 mi
Loading nearby amenities…
Taxation est. · year 1
- Rental income
- $67,573
- − Mortgage interest
- −$47,613
- − Property taxes
- −$7,026
- − Insurance
- −$4,250
- − Repairs & maintenance
- −$5,406
- − Management
- −$5,406
- − Depreciation
- −$24,727
- Taxable loss
- −$26,855
- Est. tax savings @ 24.0%
- +$6,445
- After-tax cash flow
- $-4,938/yr
For passive investors: Depreciation is non-cash, so a rental often shows a tax loss while cash-flowing — sheltering income. Rental losses are passive: they offset passive income freely, and up to $25,000/yr can offset ordinary (W-2) income if you actively participate and your MAGI is under $100k (phasing out to $0 by $150k); unused losses carry forward. On sale, claimed depreciation is recaptured at up to 25%, and gains may owe capital-gains tax (a 1031 exchange can defer both). Figures are a year-1 estimate at your 24.0% rate — not tax advice; consult a CPA.
Schools (NCES district)
- District
- Taconic Hills Central School District
- NCES district ID
- 3628620
- Math proficiency
- 53% ▲ 10.00%
- Reading proficiency
- 51% ▲ 11.00%
- Median HH income
- $57,329
- Composite
- 45.16/100
- National rank
- #2676
- State rank
- #335 of 590 in NY
Livability — Copake Lake
- Score
- 62/100
- State rank
- #841
- US rank
- #16329
Category grades
Schools grade is shown separately in the Schools card above.
Census & demographics
- Census place
- Copake Lake, NY
- Population (ZIP)
- 1,874
Population outlook (Columbia County) Hauer SSP2
- Today (2025)
- 58,662 people
- By 2030
- 56,557 · -3.6%
- By 2040
- 51,324 · -12.5%
- By 2050
- 45,790 · -21.9%
- By 2075
- 35,232 · -39.9%
- By 2100
- 25,846 · -55.9%
Race, ethnicity, and origin ACS 2023
- Neighborhood character
- Predominantly White (81%)
- Race & ethnicity
- White 81% Two or more races 11% Hispanic / Latino 7% Black 1%
- Hispanic origin (detail)
- Mexican 1% Cuban 2%
- Common ancestry
- Romanian 3% Scotch-Irish 3% Slovak 2%
- Foreign-born
- 4% · Canada, Jamaica
- Languages at home
- 90% English-only · Spanish 8% Russian/Polish/Slavic 1% Other Indo-European 1%
Political lean MEDSL · Columbia
- 2024 margin
- D (+14.7) · D 57.4% · R 42.6%
- 2008→2024 swing
- +1.3pp toward D · 2008: 13.4pp · 2024: 14.7pp
- All cycles
- 2024: D+14.7 2020: D+16.7 2016: D+1.4 2012: D+11.7 2008: D+13.4
Not yet ingested
- Civics
- —
Market trends
- HPI YoY
- ▲ 83.58%
- Current HPI
- 441.0272
- Rent YoY
- —
- Metro
- —
- State GDP YoY
- ▲ 2.60%
- F500 in state
- 92
Industry mix (Fortune 500 HQ in NY)
| Industry | F500 HQs | Revenue |
|---|---|---|
| Financial Services | 10 | $950B |
|
||
| Consumer Goods | 9 | $162B |
|
||
| Insurance | 4 | $225B |
|
||
| Telecommunications | 2 | $144B |
|
||
| Pharmaceuticals | 2 | $112B |
|
||
| Media / Entertainment | 2 | $69B |
|
||
Price history
+2328.6% since first listed2 events — show timeline
- 2026-05-19 Listed $850,000 SIBORMLS
- 1993-09-30 Sold (Public Records) $35,000 Public Records
Property tax history
+1.4%/yrLatest (2025): $7,026 · +2.0% YoY. Source: county tax records.
Cash-flow waterfall
monthlySold comps — $/sqft
last 12 mo · ≤1 miLoading sold comps…