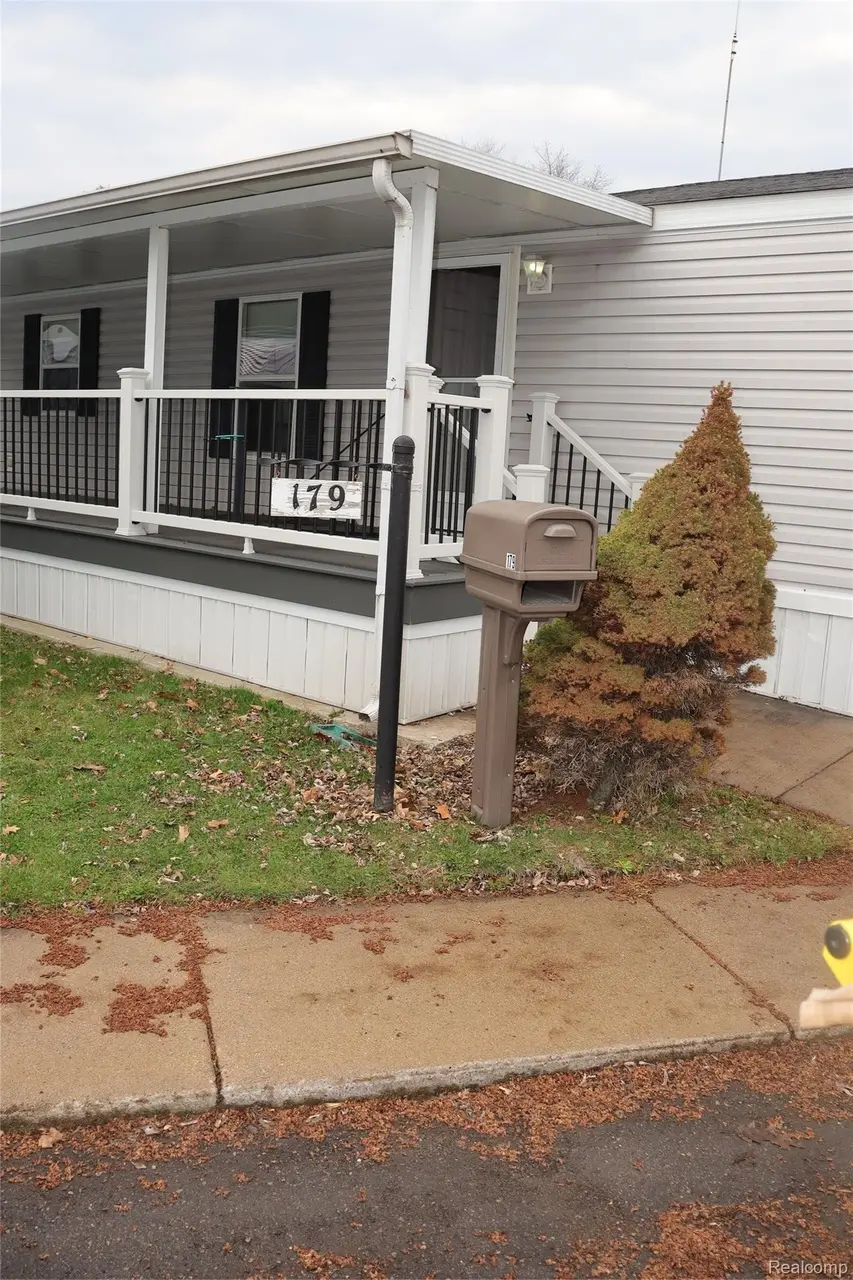
179 Terri Dr · Dearborn Heights, MI
Flood risk No data
- FEMA flood zone
- —
- Chance of flooding over 30 yrs
- —
- Est. flood insurance / yr
- —
Fire risk No data
- Est. fire insurance / yr
- —
Heat risk No data
- Hot days now (above threshold)
- —
- Hot days in 30 yrs
- —
Wind risk No data
- Chance of severe wind over 30 yrs
- —
Air-quality risk No data
- Unhealthy air days now
- —
- Unhealthy air days in 30 yrs
- —
Risk factors via First Street. Map © Google.
Why this score? — see what drove the D grade
The composite is a weighted blend of 9 inputs, each scored 0–100. Each bar is that input's sub-score; the figure is the points it added to the 100-point composite (weight × sub-score).
- Cash flow +15.0/30.0
- ARV discount +7.5/15.0
- 1% rule +5.0/10.0
- DSCR +5.0/10.0
- Livability +4.0/5.0
- Schools +3.2/10.0
- Rent growth +2.6/5.0
- Condition / age +2.2/5.0
- Appreciation +0.0/10.0
$30,000
🖨 Deal sheet 📄 Offer letter ✓ Due diligence
Key facts
- 7,200 sq ft lot
- Built 2004
- Listed 28 days
Property features AI
Finance
- Other: Directions: From Beech Daly, turn left to Figueroa St until Central St. Then turn left to Terri Dr.; Cross streets: South of W Warren St / West of Beech Daly
- HOA & community: Homeowners association with a monthly fee of $715
Exterior
- Parking: No garage
- Utilities: Public water; Public sewer
- Home design: Single-family residence; One level; Ground-level entry with steps
- Construction: Vinyl siding; Slab foundation
- Exterior features: Paved road access; Lot dimensions approximately 60 x 120
Interior
- Bathrooms: One full bathroom
- Heating & cooling: Forced air heating (natural gas); No cooling
- Interior features: Total of 4 rooms
Neighborhood map
What this means for you Summary
Snapshot
- This is a 2-bed/1.0-bath single-family listed at $30k. Condition is rated fair.
Deal economics
- At list price, monthly cash flow is $212 ($3k/yr) — positive.
- The deal already cash-flows at list — no discount required.
- Meets the 1% rule at list price ($1k rent vs $30k).
- Recommended offer: $30k (1.5% below list) — sets the bar for market timing.
- Cap rate 14.8% vs local median 5.5% in Dearborn Heights — top-decile yield for the area; either an underpriced asset or a hidden risk that comps aren't pricing in. Stress-test before assuming the spread holds.
Location & tenants
- Location reads 79/100 on livability (#82 in MI, #1,885 nationally) — a middle-class / working-renter tenant base. Strengths: commute A+, cost of living A+, housing A+; Watch: schools C-, crime D+, employment D+.
- Crestwood School District (suburban): math 32% / reading 43% proficiency, ranked #242 of 540 in MI (top 45%) — families likely to look elsewhere, expect single-tenant / working-renter base with shorter leases.
- Market conditions: Rents flat; 143 active listings in the ZIP; 21 comparable units currently listed for rent nearby; rentals at typical pace (median 17d on market — plan ~3-4 weeks tenant-placement turnaround); 2,639 units permitted in Wayne County in 2024 (1,216 in 5+ unit buildings).
Forward outlook
- Local home prices are declining (-3.0%/yr); year-one equity from $207 of loan paydown is wiped out by about $900 of value loss. Plan a longer hold.
- Wayne County population projected at -17% by 2050 — secular population decline; favor cash flow + early exit over multi-decade hold.
- At projected returns (-3.0% appreciation + 0.4% rent growth), your $8k cash investment doubles in ~6 years — after that, you're playing with house money.
Negotiation context
- It's been on market 28 days — a 2% lower offer ($30k) is reasonable based on typical stale-listing flexibility.
- 2 sale attempts; this cycle's ask has dropped $10k (25%) from the opening price — seller is motivated, your offer sets the floor, not the list.
Risks & watch-outs
- Watch-outs: HOA is 50% of rent.
Questions for the listing agent
- Have any recent inspections been done? Can we get a copy of the seller's disclosures and any deferred-maintenance estimates?
- What does the HOA fee cover, when was the last increase, and are there any pending special assessments or reserve-fund shortfalls?
- Is there a deadline driving the sale (1031 exchange, divorce, estate, relocation)? That informs how much negotiation room exists.
- Crime grade is D in this area — have there been break-ins, vandalism, or insurance claims at this property in the last 3 years? What carrier currently insures it and at what premium?
- The area grade is low — what's the realistic commute time and amenity access for the typical tenant pool here? Any planned neighborhood developments (good or bad) we should know about?
- What's the average days-on-market for RENTAL listings here right now (not sales)? A rising rental-DOM trend means longer vacancies and softer asking-rent achievability than the comps imply.
- What's the recent tenant-quality profile in this submarket — average credit score on applications, eviction rate, late-payment / NSF rate, and stable-employment percentage? A property-management company in the area should have these aggregated.
- How much new for-sale + rental construction is in the pipeline within 1–3 miles? Heavy new supply typically softens prices + rents 12–24 months out; constrained supply supports both.
Investment metrics
- 1% rule
- 4.79% ✓
- Cap rate
- 14.77%
- Cash-on-cash
- 30.28%
- DSCR
- 2.35
- GRM
- 1.7
CMA / ARV
- ARV (on-the-fly)
- $181,740
- Comps found
- 12
Show comp detail 12 sales within ~0.75 mi
| Address | Dist | Beds/Ba | Sqft | Sold | Price | $/sf | Match |
|---|---|---|---|---|---|---|---|
| 192 Jay St | 0.07mi | 2/1.0 | 1,000 (+7%) | 2mo | $22,000 | $22 | 83 |
| 56 3rd St | 0.17mi | 2/1.0 | 1,000 (+7%) | 10mo | $18,000 | $18 | 71 |
| 6669 N Beech Daly Rd | 0.33mi | 3/1.0 (+1) | 925 (-1%) | 8mo | $205,000 | $222 | 71 |
| 6453 Centralia St | 0.33mi | 2/1.0 | 880 (-6%) | 8mo | $180,000 | $205 | 69 |
| 6661 N Beech Daly Rd | 0.34mi | 3/1.0 (+1) | 925 (-1%) | 12mo | $230,000 | $249 | 68 |
| 7014 Kinmore St | 0.54mi | 3/1.0 (+1) | 960 (+3%) | 7mo | $176,000 | $183 | 59 |
| 6176 N Gulley Rd | 0.72mi | 2/1.0 | 960 (+3%) | 12mo | $130,000 | $135 | 52 |
| 7139 Centralia St | 0.29mi | 3/2.0 (+1) | 1,053 (+13%) | 7mo | $205,000 | $195 | 50 |
| 6894 N Gulley Rd | 0.60mi | 3/1.5 (+1) | 999 (+7%) | 6mo | $235,000 | $235 | 48 |
| 5846 Berwyn St | 0.70mi | 2/1.0 | 862 (-8%) | 8mo | $159,900 | $185 | 48 |
| 26312 Warrington St | 0.35mi | 3/1.5 (+1) | 1,050 (+13%) | 11mo | $275,000 | $262 | 47 |
| 6311 Whitefield St | 0.53mi | 3/1.0 (+1) | 1,020 (+9%) | 13mo | $125,000 | $123 | 44 |
Match score weights: distance 35% · size 25% · config 20% · recency 20%. Top-matched comps best support the ARV.
Projected returns pro-forma
-3.0% appreciation · 0.41% rent growth · sell at horizon
- IRR
- 17.5%
- Equity multiple
- 1.65×
- Total profit
- $5,454
- Equity at exit
- $4,473
- IRR
- 20.3%
- Equity multiple
- 2.17×
- Total profit
- $9,797
- Equity at exit
- $2,594
Cash invested: $8,400 (down + closing). Projections, not guarantees.
Landlord ↔ Tenant lean methodology
- Overall (STATE)
- 62 Landlord-Friendly
- State Michigan
- 62 Landlord-Friendly · EVEN
- County
- — inherits STATE
- City
- — inherits STATE
ZIP-level market 48127
- Rents YoY
- 0.4%
- Active inventory
- 143
- Price-to-rent
- 1.7×
Monthly cashflow live
- Estimated rent
- $1,436 high interval (Pro) →
- Mortgage (P&I)
- −$157
- Tax est. 1.5%
- −$38 /mo · $450/yr
- Insurance
- −$12
- HOA
- −$715
- Vacancy / Maint / Mgmt
- −$302
- Net cashflow
- $212
Break-even live
UW: 25.0% down · 7.5% · 30yr · 1.5% tax · 5.0% vac · 8.0% maint · 8.0% mgmt
Financing live
Cash to close
- Down payment
- $7,500
- Closing costs
- $900
- Reserves months
- —
- Total cash needed
- —
Loan-product check · same deal, 3 products live
Conventional
25% down · 7.5% · 30yr
- Down + closing
- —
- Monthly P&I
- —
- Monthly cashflow
- —
- DSCR
- —
- Eligible?
- —
Personal DTI + credit; lowest rate.
DSCR
20% down · 8.5% · 30yr
- Down + closing
- —
- Monthly P&I
- —
- Monthly cashflow
- —
- DSCR
- —
- Eligible?
- —
No personal income docs; deal must DSCR.
Hard money
10% down · 12.0% · 12mo
- Down + closing
- —
- Monthly P&I
- —
- Monthly cashflow
- —
- DSCR
- —
- Eligible?
- —
Short-term bridge; refi at stabilization.
Rent comps 21 comps
| Address | Beds | Baths | Sqft | Rent | $/sqft | DOM | Units | Dist |
|---|---|---|---|---|---|---|---|---|
| 181 Terri Dr Unit 181 Dearborn Heights, MI | 2.0 | 2.0 | 840 | $1,119 | $1.33 | 5d | 1 | 0.05mi |
| 79 3rd St Unit 79 Dearborn Heights, MI | 2.0 | 1.0 | 840 | $1,339 | $1.59 | 24d | 1 | 0.11mi |
| 7014 Kinmore St Dearborn Heights, MI | 3.0 | 1.0 | 960 | $1,900 | $1.98 | 21d | 1 | 0.53mi |
| 7080 Highview St Dearborn Heights, MI | 3.0 | 2.5 | 1105 | $2,000 | $1.81 | 18d | 1 | 0.66mi |
| 6954 Inkster Rd Dearborn Heights, MI | 1.0–2.0 | 1.0–1.5 | 837 | $1,339 | $1.60 | 2d | 9 | 0.67mi |
| 5722 Centralia St Dearborn Heights, MI | 3.0 | 1.0 | 999 | $1,750 | $1.75 | 1d | 1 | 0.76mi |
| 7048 Deering St Garden City, MI | 3.0 | 1.0 | 910 | $1,500 | $1.65 | 17d | 1 | 0.91mi |
| 5726 Inkster Rd Dearborn Heights, MI | 1.0 | 1.0 | 630 | $1,050 | $1.67 | 43d | 1 | 0.94mi |
| 7215 Lathers St Westland, MI | 1.0 | 1.0 | 836 | $1,045 | $1.25 | 24d | 1 | 1.15mi |
| 7435 Lathers St Westland, MI | 3.0 | 1.0 | 1120 | $1,900 | $1.70 | 16d | 1 | 1.18mi |
| 5839 Helen St Garden City, MI | 3.0 | 1.0 | 984 | $1,500 | $1.52 | 24d | 1 | 1.18mi |
| 27201 Canfield St W Dearborn Heights, MI | 1.0–2.0 | 1.0–2.0 | 852 | $1,499 | $1.76 | 1d | 22 | 1.21mi |
| 7457 Harrison St Westland, MI | 3.0 | 1.0 | 1120 | $1,900 | $1.70 | 1d | 1 | 1.24mi |
| 5927 Lathers St Garden City, MI | 3.0 | 1.0 | 1000 | $1,600 | $1.60 | 1d | 1 | 1.26mi |
| 7484 Affeldt St Westland, MI | 3.0 | 1.0 | 1120 | $1,500 | $1.34 | 24d | 1 | 1.27mi |
| 7420 Drexel St Dearborn Heights, MI | 2.0 | 1.0 | 1080 | $1,700 | $1.57 | 43d | 1 | 1.27mi |
| 7420 Drexel St Dearborn Heights, MI | 2.0 | 1.0 | 1080 | $1,700 | $1.57 | 17d | 1 | 1.27mi |
| 7420 Drexel St Dearborn Heights, MI | 2.0 | 1.0 | 1080 | $1,600 | $1.48 | 4d | 1 | 1.27mi |
| 8455 Robindale Ave Dearborn Heights, MI | 3.0 | 1.0 | 1100 | $1,750 | $1.59 | 4d | 1 | 1.28mi |
| 8187 Lenore St Dearborn Heights, MI | 2.0 | 1.0 | 768 | $1,550 | $2.02 | 43d | 1 | 1.42mi |
| 23700 W Warren St Dearborn Heights, MI | 1.0 | 1.0 | 900 | $1,120 | $1.24 | 43d | 2 | 1.44mi |
HOA detail
- Monthly dues
- $715 · $8,580/yr
Listing history 16 events
-
2026-06-18days on market $30,000 Active 28 DOM
-
2026-06-17days on market $30,000 Active 27 DOM
-
2026-06-16days on market $30,000 Active 26 DOM
-
2026-06-15days on market $30,000 Active 25 DOM
-
2026-06-13days on market $30,000 Active 23 DOM
-
2026-06-13days on market $30,000 Active 22 DOM
-
2026-06-09days on market $30,000 Active 19 DOM
-
2026-06-08days on market $30,000 Active 18 DOM
-
2026-06-07days on market $30,000 Active 17 DOM
-
2026-06-04pricedays on market $30,000 Active 14 DOM
-
2026-06-03days on market $40,000 Active 13 DOM
-
2026-06-02days on market $40,000 Active 12 DOM
-
2026-06-01days on market $40,000 Active 11 DOM
-
2026-05-31days on market $40,000 Active 10 DOM
-
2026-05-21$40,000 Active
-
2026-05-21$40,000 Active
ⓘ Source: listings_history table (triggers on properties + properties_extension) + one-shot
backfill from property_details.listing_events for pre-trigger history.
Nearby sold comps map
Loading sold comps map…
Walkable amenities ~0.75 mi
Loading nearby amenities…
Taxation est. · year 1
- Rental income
- $17,230
- − Mortgage interest
- −$1,680
- − Property taxes
- −$450
- − Insurance
- −$150
- − Repairs & maintenance
- −$1,378
- − Management
- −$1,378
- − HOA
- −$8,580
- − Depreciation
- −$873
- Taxable income
- $2,740
- Est. tax owed @ 24.0%
- −$658
- After-tax cash flow
- $1,886/yr
For passive investors: Depreciation is non-cash, so a rental often shows a tax loss while cash-flowing — sheltering income. Rental losses are passive: they offset passive income freely, and up to $25,000/yr can offset ordinary (W-2) income if you actively participate and your MAGI is under $100k (phasing out to $0 by $150k); unused losses carry forward. On sale, claimed depreciation is recaptured at up to 25%, and gains may owe capital-gains tax (a 1031 exchange can defer both). Figures are a year-1 estimate at your 24.0% rate — not tax advice; consult a CPA.
Condition & rehab AI · 30 photos
This home requires significant repairs and updates to improve its condition and value. The exterior and interior need fresh paint, new siding, and carpet. The kitchen and bathrooms also need updates to modernize the space. Landscaping will also enhance the curb appeal.
Repairs flagged
- Major Paint — Peeling paint on exterior and interior
- Major Siding — Weathered and peeling
- Major Flooring — Worn-out carpet in living areas
- Moderate Kitchen cabinets — Older and dated design
- Moderate Bathroom fixtures — Basic and dated design
- Major Landscaping — Overgrown lawn and lack of landscaping
Value-add opportunities
- Resale Paint exterior and interior — Fresh paint enhances curb appeal
- Resale Replace siding — New siding improves home's appearance
- Resale Replace carpet — New carpet enhances living areas
- Resale Update kitchen cabinets — Modern cabinets improve kitchen functionality and aesthetics
- Resale Update bathroom fixtures — Modern fixtures enhance bathroom functionality and aesthetics
- Resale Landscaping — Well-maintained landscaping enhances curb appeal
Renovation cost estimate screening
| Repair item | Severity | Est. cost |
|---|---|---|
| Paint · Peeling paint on exterior and interior | Major | $15,000–50,000 |
| Siding · Weathered and peeling | Major | $15,000–50,000 |
| Flooring · Worn-out carpet in living areas | Major | $15,000–50,000 |
| Kitchen cabinets · Older and dated design | Moderate | $3,000–15,000 |
| Bathroom fixtures · Basic and dated design | Moderate | $3,000–15,000 |
| Landscaping · Overgrown lawn and lack of landscaping | Major | $15,000–50,000 |
| Total estimated repair cost · 6 items | $66,000–230,000 |
Value-add ROI direction
- Resale Paint exterior and interior — Fresh paint enhances curb appeal ↑
- Resale Replace siding — New siding improves home's appearance ↑
- Resale Replace carpet — New carpet enhances living areas ↑
- Resale Update kitchen cabinets — Modern cabinets improve kitchen functionality and aesthetics ↑
- Resale Update bathroom fixtures — Modern fixtures enhance bathroom functionality and aesthetics ↑
- Resale Landscaping — Well-maintained landscaping enhances curb appeal ↑
ⓘ Cost ranges are severity-bucket heuristics (US national rule-of-thumb). Get contractor quotes + a written scope before underwriting a rehab budget.
Schools (NCES district)
- District
- Crestwood School District
- NCES district ID
- 2600016
- Math proficiency
- 32% ▼ -6.00%
- Reading proficiency
- 43% ▼ -4.00%
- Median HH income
- $47,101
- Composite
- 32.1/100
- National rank
- #5806
- State rank
- #242 of 540 in MI
Livability — Dearborn Heights
- Score
- 79/100
- State rank
- #82
- US rank
- #1885
Category grades
Schools grade is shown separately in the Schools card above.
Census & demographics
- Census place
- Dearborn Heights, MI
- County
- Wayne County · 1,562,939 people
- City population
- 61,771
- Metro
- Detroit-Warren-Dearborn, MI
- Population (ZIP)
- 39,646
- Household income
- $60,742
- Rent vs Own
- Severe rent burden
- 1196.0
Population outlook (Wayne County) Hauer SSP2
- Today (2025)
- 1,675,273 people
- By 2030
- 1,620,300 · -3.3%
- By 2040
- 1,502,341 · -10.3%
- By 2050
- 1,384,039 · -17.4%
- By 2075
- 1,124,592 · -32.9%
- By 2100
- 881,193 · -47.4%
Race, ethnicity, and origin ACS 2023
- Neighborhood character
- Predominantly White (85%)
- Race & ethnicity
- White 85% Black 8% Two or more races 3% Hispanic / Latino 3% Asian 2%
- Common ancestry
- Arab 8% Romanian 7% Lithuanian 2%
- Foreign-born
- 31% · Canada
- Languages at home
- 46% English-only · Arabic 45% Russian/Polish/Slavic 2% Other Indo-European 2%
Political lean MEDSL · Wayne
- 2024 margin
- Strong D (+29.0) · D 62.7% · R 33.7% · Other 3.6%
- 2008→2024 swing
- -20.5pp toward R · 2008: 49.5pp · 2024: 29.0pp
- All cycles
- 2024: D+29.0 2020: D+38.1 2016: D+37.3 2012: D+46.9 2008: D+49.5
Not yet ingested
- Civics
- —
Market trends
- HPI YoY
- ▼ -319.04%
- Current HPI
- 225.9407
- Rent YoY
- ▲ 0.41%
- Metro
- Detroit-Warren-Dearborn, MI
- State GDP YoY
- ▲ 1.37%
- F500 in state
- 28
Industry mix (Fortune 500 HQ in MI)
| Industry | F500 HQs | Revenue |
|---|---|---|
| Automotive Parts | 3 | $48B |
|
||
| Automotive | 2 | $372B |
|
||
| Chemicals | 1 | $45B |
|
||
| Automotive Retail | 1 | $29B |
|
||
| Healthcare / Medical Devices | 1 | $23B |
|
||
| Automotive Technology | 1 | $20B |
|
||
Price history
+0.0% since first listed2 events — show timeline
- 2026-05-21 Listed $40,000 MiRealSource-MiMLS
- 2026-05-21 Listed $40,000 REALCOMP
Cash-flow waterfall
monthlySold comps — $/sqft
last 12 mo · ≤1 miLoading sold comps…