333 Chamberlain Rd · West Stewartstown, NH
Flood risk 1/10 · Minimal
- FEMA flood zone
- X
- Chance of flooding over 30 yrs
- 0.0%
- Est. flood insurance / yr
- $473 – $860
Fire risk 1/10 · Minimal
- Est. fire insurance / yr
- $480 – $892
Heat risk 1/10 · Minimal
- Hot days now (above 87°F)
- 7 days/yr
- Hot days in 30 yrs
- 17 days/yr
Wind risk 2/10 · Minimal
- Chance of severe wind over 30 yrs
- 2.0%
Air-quality risk 2/10 · Minimal
- Unhealthy air days now
- 1 days/yr
- Unhealthy air days in 30 yrs
- 1 days/yr
Risk factors via First Street. Map © Google.
Why this score? — see what drove the D grade
The composite is a weighted blend of 9 inputs, each scored 0–100. Each bar is that input's sub-score; the figure is the points it added to the 100-point composite (weight × sub-score).
- ARV discount +15.0/15.0
- Appreciation +9.3/10.0
- Schools +5.0/10.0
- Cash flow +4.5/30.0
- Livability +3.0/5.0
- Rent growth +2.5/5.0
- Condition / age +2.5/5.0
- 1% rule +0.0/10.0
- DSCR +0.0/10.0
$225,000
🖨 Deal sheet (PDF) 📄 Offer letter ✓ Due diligence
Listing remarks MLS
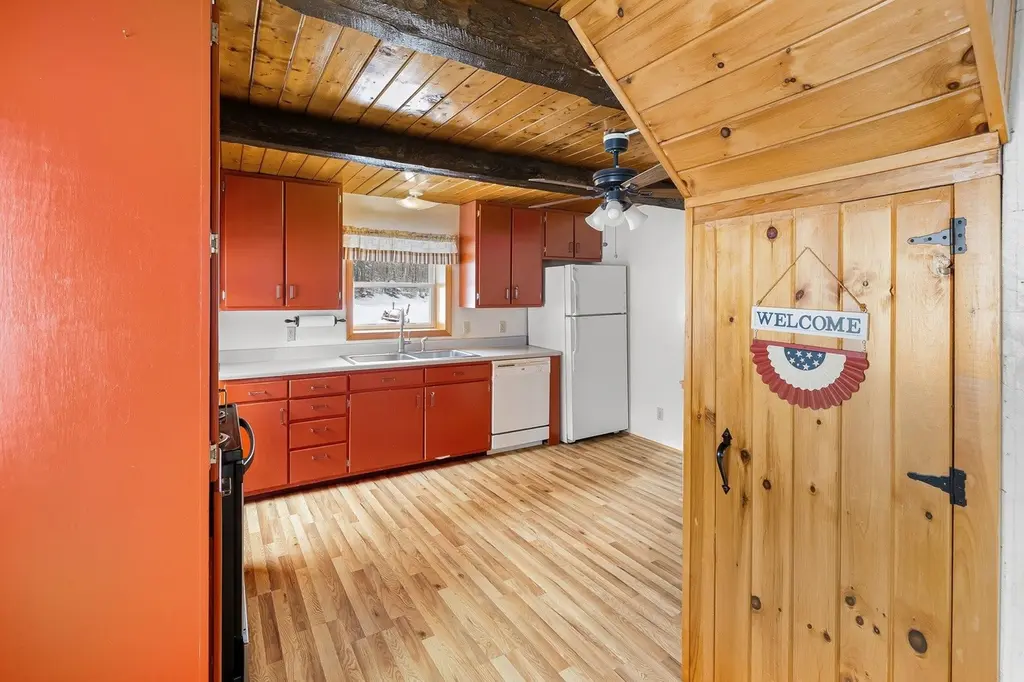
Owner financing available! Built from pine logs felled directly on the property, this 1981 log cabin offers authentic Vermont character on a quiet, dead-end dirt road. The home features a spacious addition with a master suite, providing a modern and comfortable update to the traditional floor plan. Master suite includes walk-in closet complete with laundry machines. With direct VAST trail access right from your driveway, this is a solid opportunity for outdoor enthusiasts looking for privacy and potential. Property is handicap accessible.
Key facts
- Vast trail access
- Handicap accessible
- Log cabin
Tags
Neighborhood map
What this means for you Summary
Snapshot
- This is a 2-bed/2.0-bath single-family listed at $225k.
Deal economics
- At list price, monthly cash flow is $-584 ($-7k/yr) — negative.
- To cash-flow at today's rent, offer at most $122k (45.9% below list).
- To meet the 1% rule (rent ≥ 1% of price), the offer needs to be $108k (51.9% below list).
- Recommended offer: $108k (51.9% below list) — sets the bar for 1% rule.
Location & tenants
- Location reads 60/100 on livability (#90 in NH) — a middle-class / working-renter tenant base. Strengths: cost of living A+, crime B+, housing B; Watch: amenities F, commute F, employment F.
- Market conditions: 11 units permitted in Essex County in 2024 (0 in 5+ unit buildings).
Forward outlook
- In year one you build about $21k of equity ($2k loan paydown + $20k appreciation (8.7% local appreciation)).
- Essex County population projected at -30% by 2050 — secular population decline; favor cash flow + early exit over multi-decade hold.
- By year 2, paydown + projected appreciation supports a ~$34k cash-out refi (75% LTV) — recoverable capital for the next deal without selling this one.
Negotiation context
- It's been on market 148 days — a 12% lower offer ($198k) is reasonable based on typical stale-listing flexibility.
- 2 sale attempts since 21y ago; this cycle's ask has dropped $60k (21%) from the opening price — seller is motivated, your offer sets the floor, not the list.
- Current owner paid $90k; list at $225k implies a 150% gain — meaningful room to come down on a strong offer.
Questions for the listing agent
- What do current leases actually rent for vs. the listed asking? Can we see a recent rent roll and the last 12 months of T-12 income?
- It's been on market 148 days. Have you received any prior offers? Is the seller open to a 52% concession, seller financing, or rate buy-down credit?
- Why hasn't it sold? Are there any deal-killer items the seller is aware of (foundation, flood, title, zoning, code violations)?
- Is there a deadline driving the sale (1031 exchange, divorce, estate, relocation)? That informs how much negotiation room exists.
- Schools are F-rated, which usually means shorter tenancies and higher turnover. Who's the typical renter profile here, and what's been the actual vacancy rate?
- The area grade is low — what's the realistic commute time and amenity access for the typical tenant pool here? Any planned neighborhood developments (good or bad) we should know about?
- What's the average days-on-market for RENTAL listings here right now (not sales)? A rising rental-DOM trend means longer vacancies and softer asking-rent achievability than the comps imply.
- What's the recent tenant-quality profile in this submarket — average credit score on applications, eviction rate, late-payment / NSF rate, and stable-employment percentage? A property-management company in the area should have these aggregated.
- How much new for-sale + rental construction is in the pipeline within 1–3 miles? Heavy new supply typically softens prices + rents 12–24 months out; constrained supply supports both.
Investment metrics
- 1% rule
- 0.48% ✗
- Cap rate
- 3.18%
- Cash-on-cash
- -11.13%
- DSCR
- 0.50
- GRM
- 17.3
CMA / ARV
- ARV (median comp)
- $322,208
- List price
- $225,000
- Delta
- -30.17%
- Verdict
- UNDERPRICED
- Comps
- 2 within 2.0 mi
Projected returns pro-forma
8.68% appreciation · 3.0% rent growth · sell at horizon
- IRR
- 13.4%
- Equity multiple
- 2.04×
- Total profit
- $65,270
- Equity at exit
- $181,413
- IRR
- 13.5%
- Equity multiple
- 4.46×
- Total profit
- $217,728
- Equity at exit
- $370,582
Cash invested: $63,000 (down + closing). Projections, not guarantees.
Landlord ↔ Tenant lean methodology
- Overall (STATE)
- 56 Moderately Landlord-Leaning
- State New Hampshire
- 56 Moderately Landlord-Leaning · D+1
- County
- — inherits STATE
- City
- — inherits STATE
ZIP-level market 05903
- Home prices YoY
- 5.5%
- Price-to-rent
- 17.3×
Monthly cashflow live
- Estimated rent
- $1,082 medium interval (Pro) →
- Mortgage (P&I)
- −$1,180
- Tax from tax record
- −$165 /mo · $1,983/yr
- Insurance
- −$94
- HOA
- −$0
- Vacancy / Maint / Mgmt
- −$227
- Net cashflow
- $-584
Break-even live
Sensitivity live
| Price | -10% $-457 | -5% $-521 | +0% $-584 | +5% $-648 | +10% $-712 |
|---|---|---|---|---|---|
| Rent | -10% $-670 | -5% $-627 | +0% $-584 | +5% $-541 | +10% $-499 |
| Rate | -1.0pp $-471 | -0.5pp $-527 | base $-584 | +0.5pp $-643 | +1.0pp $-702 |
UW: 25.0% down · 7.5% · 30yr · 1.5% tax · 5.0% vac · 8.0% maint · 8.0% mgmt
Financing live
Cash to close
- Down payment
- $56,250
- Closing costs
- $6,750
- Reserves months
- —
- Total cash needed
- —
Loan-product check · same deal, 3 products live
Conventional
25% down · 7.5% · 30yr
- Down + closing
- —
- Monthly P&I
- —
- Monthly cashflow
- —
- DSCR
- —
- Eligible?
- —
Personal DTI + credit; lowest rate.
DSCR
20% down · 8.5% · 30yr
- Down + closing
- —
- Monthly P&I
- —
- Monthly cashflow
- —
- DSCR
- —
- Eligible?
- —
No personal income docs; deal must DSCR.
Hard money
10% down · 12.0% · 12mo
- Down + closing
- —
- Monthly P&I
- —
- Monthly cashflow
- —
- DSCR
- —
- Eligible?
- —
Short-term bridge; refi at stabilization.
Listing history 15 events
-
2026-06-10status $225,000 Pending 148 DOM
-
2026-06-09days on market $225,000 Active 148 DOM
-
2026-06-08days on market $225,000 Active 147 DOM
-
2026-06-08days on market $225,000 Active 146 DOM
-
2026-06-05days on market $225,000 Active 144 DOM
-
2026-06-03days on market $225,000 Active 142 DOM
-
2026-06-02days on market $225,000 Active 141 DOM
-
2026-06-01days on market $225,000 Active 140 DOM
-
2026-05-31days on market $225,000 Active 139 DOM
-
2026-01-12$285,000 Active 545-char remark
Show marketing remark (545 chars)
Owner financing available! Built from pine logs felled directly on the property, this 1981 log cabin offers authentic Vermont character on a quiet, dead-end dirt road. The home features a spacious addition with a master suite, providing a modern and comfortable update to the traditional floor plan. Master suite includes walk-in closet complete with laundry machines. With direct VAST trail access right from your driveway, this is a solid opportunity for outdoor enthusiasts looking for privacy and potential. Property is handicap accessible.
-
2005-11-03soldstatus $90,000
-
2005-11-02soldstatus $90,000 130-char remark
Show marketing remark (130 chars)
PERFECT PRIVATE SPOT AT THE END OF THE TOWN MAINTAINED ROAD. LOG HOME W/ DRILLED WELL, GARAGE. GREAT FOR YR ROUND OR VACATION USE.
-
2005-10-28historical 130-char remark
Show marketing remark (130 chars)
PERFECT PRIVATE SPOT AT THE END OF THE TOWN MAINTAINED ROAD. LOG HOME W/ DRILLED WELL, GARAGE. GREAT FOR YR ROUND OR VACATION USE.
-
2005-10-24soldstatus $50,000
-
2005-05-03$91,000 130-char remark
Show marketing remark (130 chars)
PERFECT PRIVATE SPOT AT THE END OF THE TOWN MAINTAINED ROAD. LOG HOME W/ DRILLED WELL, GARAGE. GREAT FOR YR ROUND OR VACATION USE.
ⓘ Source: listings_history table (triggers on properties + properties_extension) + one-shot
backfill from property_details.listing_events for pre-trigger history.
Tax reassessment forecast NH · Partial reset (capped growth)
- Current annual tax
- $1,983 · $165/mo
- Projected year-2 tax
- $3,444 · $287/mo
- Expected delta
- +$1,461/yr (+$122/mo · 73.6%)
ⓘ Screening estimate from a state-policy table — verify with the county assessor before closing.
Climate risk First Street
- Flood 1/10 Low FEMA zone X · 0% chance over 30 yrs
- Wildfire 1/10 Low
- Heat 1/10 Low 7 d/yr ≥87°F today · 17 d/yr by 30 yrs out
- Wind 2/10 Low 2% chance of damaging wind over 30 yrs
- Air quality 2/10 Low 1 unhealthy d/yr today · 1 by 30 yrs out
Nearby sold comps map
Loading sold comps map…
Walkable amenities ~0.75 mi
Loading nearby amenities…
Taxation est. · year 1
- Rental income
- $12,984
- − Mortgage interest
- −$12,603
- − Property taxes
- −$1,983
- − Insurance
- −$1,125
- − Repairs & maintenance
- −$1,039
- − Management
- −$1,039
- − Depreciation
- −$6,545
- Taxable loss
- −$11,351
- Est. tax savings @ 24.0%
- +$2,724
- After-tax cash flow
- $-4,286/yr
For passive investors: Depreciation is non-cash, so a rental often shows a tax loss while cash-flowing — sheltering income. Rental losses are passive: they offset passive income freely, and up to $25,000/yr can offset ordinary (W-2) income if you actively participate and your MAGI is under $100k (phasing out to $0 by $150k); unused losses carry forward. On sale, claimed depreciation is recaptured at up to 25%, and gains may owe capital-gains tax (a 1031 exchange can defer both). Figures are a year-1 estimate at your 24.0% rate — not tax advice; consult a CPA.
Schools (NCES district)
No district data.
Livability — West Stewartstown
- Score
- 60/100
- State rank
- #90
- US rank
- #19434
Category grades
Schools grade is shown separately in the Schools card above.
Census & demographics
- Population (ZIP)
- 714
Population outlook (Essex County) Hauer SSP2
- Today (2025)
- 5,715 people
- By 2030
- 5,396 · -5.6%
- By 2040
- 4,680 · -18.1%
- By 2050
- 4,025 · -29.6%
- By 2075
- 3,104 · -45.7%
- By 2100
- 2,590 · -54.7%
Race, ethnicity, and origin ACS 2023
- Neighborhood character
- Predominantly White (98%)
- Race & ethnicity
- White 98%
- Common ancestry
- Lithuanian 11% Slovak 5% Russian 3%
- Foreign-born
- 6% · Canada
- Languages at home
- 78% English-only · French/Haitian/Cajun 22%
Political lean MEDSL · Essex
- 2024 margin
- R (+16.0) · D 39.4% · R 55.4% · Other 5.2%
- 2008→2024 swing
- -30.5pp toward R · 2008: 14.5pp · 2024: -16.0pp
- All cycles
- 2024: R+16.0 2020: R+11.2 2016: R+18.0 2012: D+13.4 2008: D+14.5
Not yet ingested
- Civics
- —
Market trends
- HPI YoY
- ▲ 8.68%
- Current HPI
- 166.8585
- Rent YoY
- —
- Metro
- —
- State GDP YoY
- —
- F500 in state
- 0
Price history
+213.2% since first listed6 events — show timeline
- 2026-01-12 Listed $285,000 PrimeMLS
- 2005-11-03 Sold (Public Records) $90,000 Public Records
- 2005-11-02 Sold (MLS) $90,000 PrimeMLS
- 2005-10-28 Delisted — PrimeMLS
- 2005-10-24 Sold (Public Records) $50,000 Public Records
- 2005-05-03 Listed $91,000 PrimeMLS
Property tax history
+2.8%/yrLatest (2024): $1,983 · -0.6% YoY. Source: county tax records.
Cash-flow waterfall
monthlySold comps — $/sqft
last 12 mo · ≤1 miLoading sold comps…