180 State Highway 5S · Mariaville Lake, NY
Flood risk 6/10 · Moderate
- FEMA flood zone
- X (unshaded)
- Chance of flooding over 30 yrs
- 0.66%
- Est. flood insurance / yr
- $473 – $860
Fire risk 3/10 · Minor
- Est. fire insurance / yr
- $691 – $1,283
Heat risk 3/10 · Minor
- Hot days now (above 93°F)
- 7 days/yr
- Hot days in 30 yrs
- 17 days/yr
Wind risk 3/10 · Minor
- Chance of severe wind over 30 yrs
- 4.0%
Air-quality risk 1/10 · Minimal
- Unhealthy air days now
- 0 days/yr
- Unhealthy air days in 30 yrs
- 0 days/yr
Risk factors via First Street. Map © Google.
Why this score? — see what drove the D grade
The composite is a weighted blend of 9 inputs, each scored 0–100. Each bar is that input's sub-score; the figure is the points it added to the 100-point composite (weight × sub-score).
- ARV discount +15.0/15.0
- Appreciation +10.0/10.0
- Schools +5.1/10.0
- Cash flow +5.0/30.0
- Rent growth +2.5/5.0
- Condition / age +2.5/5.0
- Livability +2.4/5.0
- 1% rule +0.0/10.0
- DSCR +0.0/10.0
$299,000
🖨 Deal sheet (PDF) 📄 Offer letter ✓ Due diligence
Listing remarks
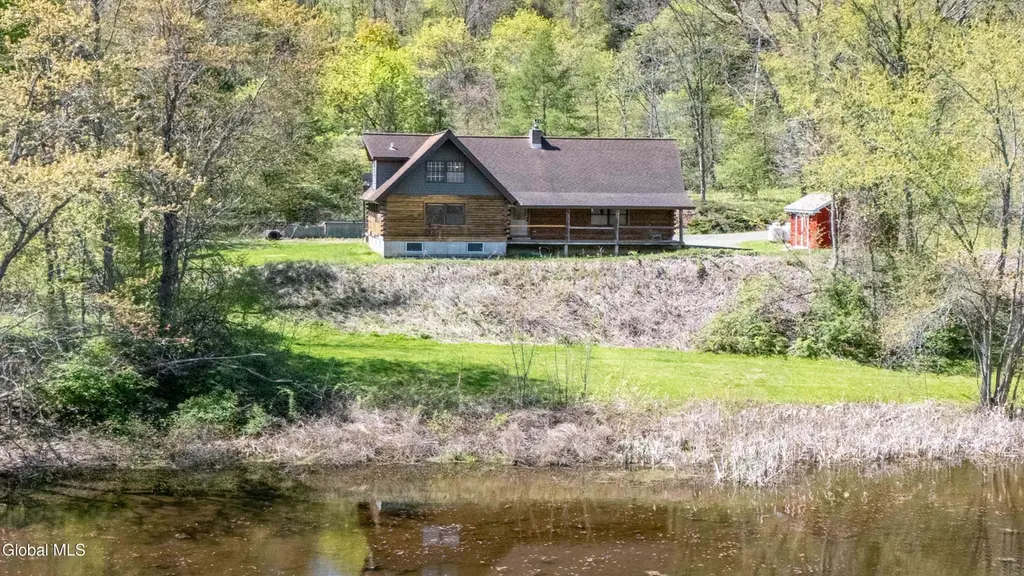
Lot 73.-1-16.21 (1.4acre) also included in sale. Opportunity meets potential in this unique log home set on a total of 4.8 acres in the Schalmont School District! Built with rot-resistant Western Red Cedar, this 4-bedroom, 2.5-bath home offers a solid foundation and incredible character, and is just waiting for the right buyer to bring it to life. The home is currently livable, with major portions complete and a partially finished upstairs, making it an ideal project for builders, investors, or buyers looking to customize their dream home. Whether you're ready to renovate, expand, or simply add your personal touch, the possibilities here are endless. Nestled in a private, picturesque settin
Key facts
- Western red cedar
- Pond
- Private setting
Tags
Property features AI
Exterior
- Parking: Driveway parking for 4 vehicles
- Security: Smoke detectors; Carbon monoxide detectors
- Utilities: Electric service with circuit breakers; Septic tank
- Home design: Single family residence; Log construction
- Construction: Log construction; Concrete perimeter foundation; Asphalt roof; Living area approximately 1,647
- Exterior features: Front porch; Rear porch; Shed(s); Pond on the property; Secluded setting with views; Level areas and steep slope
Interior
- Kitchen: Dishwasher; Oven; Range; Refrigerator
- Bedrooms: One bedroom on the first level; Three bedrooms on the second level
- Flooring: Wood and hardwood floors
- Bathrooms: Two full bathrooms (one on first level, one on second level); One half bathroom on the first level
- Heating & cooling: Baseboard heating; Hot water heating; Oil heating; Propane heating
- Interior features: 11 total rooms; Water softener; Smoke detectors; Carbon monoxide detectors
- Laundry & utility: Main level laundry room; Washer/Dryer included
Neighborhood map
What this means for you Summary
Snapshot
- This is a 4-bed/1.5-bath single-family listed at $299k.
Deal economics
- At list price, monthly cash flow is $-711 ($-9k/yr) — negative.
- To cash-flow at today's rent, offer at most $173k (42.0% below list).
- To meet the 1% rule (rent ≥ 1% of price), the offer needs to be $142k (52.7% below list).
- Recommended offer: $142k (52.7% below list) — sets the bar for 1% rule.
Location & tenants
- Location reads 48/100 on livability (#1,178 in NY) — a working-class tenant base; expect higher turnover. Strengths: housing A+, crime A; Watch: amenities F, commute F, employment F.
- Schalmont Central School District (suburban): math 51% / reading 64% proficiency, ranked #243 of 590 in NY (top 41%) — acceptable for families but not a draw, mixed tenant base, ~2y average lease; only 17% free/reduced lunch — higher-income household profile.
- Zoned schools: Jefferson Elementary School (math 53% / reading 61%, 677 students, 27% FRL); Schalmont Middle School (math 35% / reading 55%, grade D, #342 of 729 statewide, top 48%, 561 students, 28% FRL); Schalmont High School (math 92% / reading 98%, grade A+, #93 of 1,100 statewide, top 10%, 572 students, 33% FRL).
- Market conditions: 10 active listings in the ZIP; 210 units permitted in Montgomery County in 2024 (168 in 5+ unit buildings).
Forward outlook
- In year one you build about $32k of equity ($2k loan paydown + $30k appreciation (10.0% local appreciation)).
- Montgomery County population projected at -11% by 2050 — secular population decline; favor cash flow + early exit over multi-decade hold.
- By year 2, paydown + projected appreciation supports a ~$51k cash-out refi (75% LTV) — recoverable capital for the next deal without selling this one.
Negotiation context
- Only 5 days on market — expect competitive offers; lowballing is unlikely to land.
Risks & watch-outs
- Climate carrying-cost: major flood risk — expect insurance premiums to compound above CPI over the hold.
Questions for the listing agent
- What do current leases actually rent for vs. the listed asking? Can we see a recent rent roll and the last 12 months of T-12 income?
- Is there a deadline driving the sale (1031 exchange, divorce, estate, relocation)? That informs how much negotiation room exists.
- Schools are D-rated, which usually means shorter tenancies and higher turnover. Who's the typical renter profile here, and what's been the actual vacancy rate?
- The area grade is low — what's the realistic commute time and amenity access for the typical tenant pool here? Any planned neighborhood developments (good or bad) we should know about?
- What's the average days-on-market for RENTAL listings here right now (not sales)? A rising rental-DOM trend means longer vacancies and softer asking-rent achievability than the comps imply.
- What's the recent tenant-quality profile in this submarket — average credit score on applications, eviction rate, late-payment / NSF rate, and stable-employment percentage? A property-management company in the area should have these aggregated.
- How much new for-sale + rental construction is in the pipeline within 1–3 miles? Heavy new supply typically softens prices + rents 12–24 months out; constrained supply supports both.
Investment metrics
- 1% rule
- 0.47% ✗
- Cap rate
- 3.44%
- Cash-on-cash
- -10.19%
- DSCR
- 0.55
- GRM
- 17.6
CMA / ARV
- ARV (median comp)
- $390,483
- List price
- $299,000
- Delta
- -23.43%
- Verdict
- UNDERPRICED
- Comps
- 4 within 1.0 mi
Projected returns pro-forma
10.0% appreciation · 3.0% rent growth · sell at horizon
- IRR
- 17.1%
- Equity multiple
- 2.40×
- Total profit
- $117,450
- Equity at exit
- $269,363
- IRR
- 16.2%
- Equity multiple
- 5.55×
- Total profit
- $381,223
- Equity at exit
- $580,891
Cash invested: $83,720 (down + closing). Projections, not guarantees.
Landlord ↔ Tenant lean methodology
- Overall (STATE)
- 15 Strongly Tenant-Friendly
- State New York
- 15 Strongly Tenant-Friendly · D+10
- County
- — inherits STATE
- City
- — inherits STATE
ZIP-level market 12137
- Home prices YoY
- 34.2%
- Active inventory
- 10
- Price-to-rent
- 17.6×
Monthly cashflow live
- Estimated rent
- $1,415 medium interval (Pro) →
- Mortgage (P&I)
- −$1,568
- Tax from tax record
- −$136 /mo · $1,634/yr
- Insurance
- −$125
- HOA
- −$0
- Vacancy / Maint / Mgmt
- −$297
- Net cashflow
- $-711
Break-even live
Sensitivity live
| Price | -10% $-541 | -5% $-626 | +0% $-711 | +5% $-795 | +10% $-880 |
|---|---|---|---|---|---|
| Rent | -10% $-823 | -5% $-767 | +0% $-711 | +5% $-655 | +10% $-599 |
| Rate | -1.0pp $-560 | -0.5pp $-635 | base $-711 | +0.5pp $-788 | +1.0pp $-867 |
UW: 25.0% down · 7.5% · 30yr · 1.5% tax · 5.0% vac · 8.0% maint · 8.0% mgmt
Financing live
Cash to close
- Down payment
- $74,750
- Closing costs
- $8,970
- Reserves months
- —
- Total cash needed
- —
Loan-product check · same deal, 3 products live
Conventional
25% down · 7.5% · 30yr
- Down + closing
- —
- Monthly P&I
- —
- Monthly cashflow
- —
- DSCR
- —
- Eligible?
- —
Personal DTI + credit; lowest rate.
DSCR
20% down · 8.5% · 30yr
- Down + closing
- —
- Monthly P&I
- —
- Monthly cashflow
- —
- DSCR
- —
- Eligible?
- —
No personal income docs; deal must DSCR.
Hard money
10% down · 12.0% · 12mo
- Down + closing
- —
- Monthly P&I
- —
- Monthly cashflow
- —
- DSCR
- —
- Eligible?
- —
Short-term bridge; refi at stabilization.
Listing history 2 events
-
2026-05-09status Pending 1813-char remark
-
2026-05-04$299,000 Active 1813-char remark
ⓘ Source: listings_history table (triggers on properties + properties_extension) + one-shot
backfill from property_details.listing_events for pre-trigger history.
Tax reassessment forecast NY · Partial reset (capped growth)
- Current annual tax
- $1,634 · $136/mo
- Projected year-2 tax
- $3,343 · $279/mo
- Expected delta
- +$1,710/yr (+$142/mo · 104.6%)
ⓘ Screening estimate from a state-policy table — verify with the county assessor before closing.
Climate risk First Street
- Flood 6/10 Major FEMA zone X (unshaded) · 66% chance over 30 yrs
- Wildfire 3/10 Moderate
- Heat 3/10 Moderate 7 d/yr ≥93°F today · 17 d/yr by 30 yrs out
- Wind 3/10 Moderate 4% chance of damaging wind over 30 yrs
- Air quality 1/10 Low 0 unhealthy d/yr today · 0 by 30 yrs out
Nearby sold comps map
Loading sold comps map…
Walkable amenities ~0.75 mi
Loading nearby amenities…
Taxation est. · year 1
- Rental income
- $16,982
- − Mortgage interest
- −$16,749
- − Property taxes
- −$1,634
- − Insurance
- −$1,495
- − Repairs & maintenance
- −$1,359
- − Management
- −$1,359
- − Depreciation
- −$8,698
- Taxable loss
- −$14,311
- Est. tax savings @ 24.0%
- +$3,435
- After-tax cash flow
- $-5,094/yr
For passive investors: Depreciation is non-cash, so a rental often shows a tax loss while cash-flowing — sheltering income. Rental losses are passive: they offset passive income freely, and up to $25,000/yr can offset ordinary (W-2) income if you actively participate and your MAGI is under $100k (phasing out to $0 by $150k); unused losses carry forward. On sale, claimed depreciation is recaptured at up to 25%, and gains may owe capital-gains tax (a 1031 exchange can defer both). Figures are a year-1 estimate at your 24.0% rate — not tax advice; consult a CPA.
Schools (NCES district)
- District
- Schalmont Central School District
- NCES district ID
- 3625980
- Math proficiency
- 51% ▼ -7.00%
- Reading proficiency
- 64% ▲ 7.00%
- Median HH income
- $72,566
- Composite
- 51.11/100
- National rank
- #1765
- State rank
- #243 of 590 in NY
Livability — Mariaville Lake
- Score
- 48/100
- State rank
- #1178
- US rank
- #26007
Category grades
Schools grade is shown separately in the Schools card above.
Census & demographics
- Population (ZIP)
- 2,347
Population outlook (Montgomery County) Hauer SSP2
- Today (2025)
- 48,683 people
- By 2030
- 47,785 · -1.8%
- By 2040
- 45,492 · -6.6%
- By 2050
- 43,161 · -11.3%
- By 2075
- 38,134 · -21.7%
- By 2100
- 32,337 · -33.6%
Race, ethnicity, and origin ACS 2023
- Neighborhood character
- Predominantly White (92%)
- Race & ethnicity
- White 92% Black 3% Two or more races 1%
- Common ancestry
- Romanian 6% Slovene 5% Iranian 2%
- Foreign-born
- 11% · Canada
- Languages at home
- 95% English-only · Other Indo-European 4% German/W. Germanic 1%
Political lean MEDSL · Montgomery
- 2024 margin
- Strong R (+28.7) · D 35.6% · R 64.4%
- 2008→2024 swing
- -20.6pp toward R · 2008: -8.1pp · 2024: -28.7pp
- All cycles
- 2024: R+28.7 2020: R+22.6 2016: R+26.5 2012: R+4.4 2008: R+8.1
Not yet ingested
- Civics
- —
Market trends
- HPI YoY
- ▲ 81.96%
- Current HPI
- 321.3768
- Rent YoY
- —
- Metro
- —
- State GDP YoY
- ▲ 2.60%
- F500 in state
- 92
Industry mix (Fortune 500 HQ in NY)
| Industry | F500 HQs | Revenue |
|---|---|---|
| Financial Services | 10 | $950B |
|
||
| Consumer Goods | 9 | $162B |
|
||
| Insurance | 4 | $225B |
|
||
| Telecommunications | 2 | $144B |
|
||
| Pharmaceuticals | 2 | $112B |
|
||
| Media / Entertainment | 2 | $69B |
|
||
Price history
2 events — show timeline
- 2026-05-09 Pending — Global MLS
- 2026-05-04 Listed $299,000 Global MLS
Property tax history
-8.5%/yrLatest (2025): $1,634 · -7.6% YoY. Source: county tax records.
Cash-flow waterfall
monthlySold comps — $/sqft
last 12 mo · ≤1 miLoading sold comps…