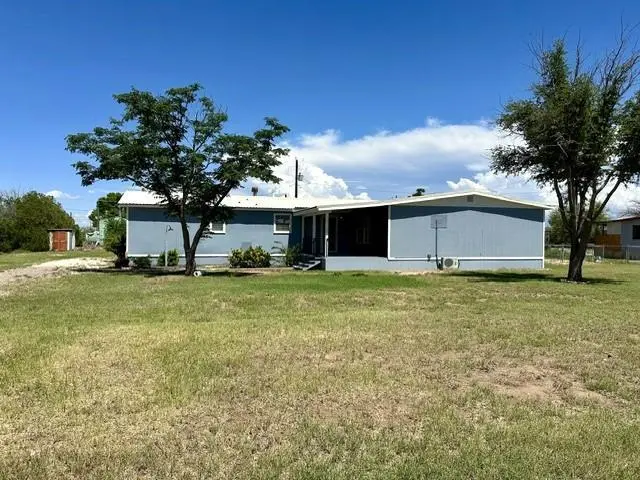
1304 N Fort · Fort Stockton, TX
Flood risk 1/10 · Minimal
- FEMA flood zone
- —
- Chance of flooding over 30 yrs
- 0.0%
- Est. flood insurance / yr
- —
Fire risk 6/10 · Moderate
- Est. fire insurance / yr
- $1,222 – $2,270
Heat risk 6/10 · Moderate
- Hot days now (above 101°F)
- 5 days/yr
- Hot days in 30 yrs
- 15 days/yr
Wind risk 1/10 · Minimal
- Chance of severe wind over 30 yrs
- 1.0%
Air-quality risk 1/10 · Minimal
- Unhealthy air days now
- 0 days/yr
- Unhealthy air days in 30 yrs
- 0 days/yr
Risk factors via First Street. Map © Google.
Why this score? — see what drove the F grade
The composite is a weighted blend of 9 inputs, each scored 0–100. Each bar is that input's sub-score; the figure is the points it added to the 100-point composite (weight × sub-score).
- Cash flow +8.2/30.0
- ARV discount +7.5/15.0
- Livability +3.4/5.0
- 1% rule +2.6/10.0
- Rent growth +2.5/5.0
- Condition / age +2.5/5.0
- DSCR +2.2/10.0
- Schools +2.2/10.0
- Appreciation +0.0/10.0
$129,000
🖨 Deal sheet (PDF) 📄 Offer letter ✓ Due diligence
Listing remarks
Welcome to this lovely 3-bedroom, 2-bathroom home offering 1,866 square feet of comfortable living space on a generous . 37-acre lot. Inside, you'll find plenty of room to spread out, along with abundant storage throughout the home. One of the standout features is the spacious sunroom—a bright and versatile space that's perfect for a thriving plant collection, a cozy reading nook, a home office, or simply enjoying your morning coffee while soaking in the natural light year-round. Whether you're looking for extra space, natural light, or a place to put down roots-look no further.
Key facts
- Generous lot
- Sunroom
- Abundant storage
Tags
Property features AI
Finance
- Other: Lot approximately 0.373 acre
Exterior
- Utilities: Public water; Public sewer
- Home design: Manufactured home (single family, residential)
- Construction: Vinyl siding; Metal roof
- Exterior features: Covered patio; Deck; Shed(s)
Interior
- Kitchen: Range; Refrigerator
- Bedrooms: 2 full bathrooms
- Flooring: Vinyl flooring
- Bathrooms: 2 full bathrooms
- Heating & cooling: Central heating; Central air conditioning; Ceiling fan(s)
- Interior features: Ceiling fans; Central air conditioning; Central heating; Range; Refrigerator; Gas water heater
- Laundry & utility: Gas water heater
Neighborhood map
What this means for you Summary
Snapshot
- This is a 3-bed/1.0-bath manufactured listed at $129k.
Deal economics
- At list price, monthly cash flow is $-122 ($-1k/yr) — negative.
- To cash-flow at today's rent, offer at most $107k (16.8% below list).
- To meet the 1% rule (rent ≥ 1% of price), the offer needs to be $98k (24.4% below list).
- Recommended offer: $98k (24.4% below list) — sets the bar for 1% rule.
Location & tenants
- Location reads 67/100 on livability (#532 in TX) — a middle-class / working-renter tenant base. Strengths: crime A+, cost of living A+, housing A+; Watch: health & safety C-, amenities F, commute F.
- Fort Stockton ISD (town): math 23% / reading 28% proficiency, ranked #709 of 826 in TX (top 86%) — low school quality limits family demand, transient renter base, plan for 1-2y turnover.
- Zoned schools: Fort Stockton Apache El (math 32% / reading 32%, grade F, #2,268 of 4,322 statewide, top 55%, 333 students, 81% FRL); Fort Stockton Middle (math 15% / reading 23%, grade F, #1,466 of 1,662 statewide, top 89%, 515 students, 59% FRL); Fort Stockton High (math 27% / reading 29%, grade F, #1,170 of 1,632 statewide, top 72%, 698 students, 71% FRL).
- Market conditions: 108 active listings in the ZIP; 1 comparable units currently listed for rent nearby; 10 units permitted in Pecos County in 2024 (5 in 5+ unit buildings).
Forward outlook
- Local home prices are declining (-3.0%/yr); year-one equity from $892 of loan paydown is wiped out by about $4k of value loss. Plan a longer hold.
- Pecos County population projected at +25% by 2050 — long-run rental-demand tailwind backs the buy-and-hold thesis.
Negotiation context
- It's been on market 15 days — a 2% lower offer ($127k) is reasonable based on typical stale-listing flexibility.
Risks & watch-outs
- Climate carrying-cost: major wildfire risk; extreme-heat days projected 5→15/yr by 2055 (HVAC capex compounding) — expect insurance premiums to compound above CPI over the hold.
Questions for the listing agent
- What do current leases actually rent for vs. the listed asking? Can we see a recent rent roll and the last 12 months of T-12 income?
- Is there a deadline driving the sale (1031 exchange, divorce, estate, relocation)? That informs how much negotiation room exists.
- Schools are F-rated, which usually means shorter tenancies and higher turnover. Who's the typical renter profile here, and what's been the actual vacancy rate?
- The area grade is low — what's the realistic commute time and amenity access for the typical tenant pool here? Any planned neighborhood developments (good or bad) we should know about?
- What's the average days-on-market for RENTAL listings here right now (not sales)? A rising rental-DOM trend means longer vacancies and softer asking-rent achievability than the comps imply.
- What's the recent tenant-quality profile in this submarket — average credit score on applications, eviction rate, late-payment / NSF rate, and stable-employment percentage? A property-management company in the area should have these aggregated.
- How much new for-sale + rental construction is in the pipeline within 1–3 miles? Heavy new supply typically softens prices + rents 12–24 months out; constrained supply supports both.
Investment metrics
- 1% rule
- 0.76% ✗
- Cap rate
- 5.15%
- Cash-on-cash
- -4.07%
- DSCR
- 0.82
- GRM
- 11.0
CMA / ARV
No comps found within radius.
Projected returns pro-forma
-3.0% appreciation · 3.0% rent growth · sell at horizon
- IRR
- -23.1%
- Equity multiple
- 0.21×
- Total profit
- $-28,683
- Equity at exit
- $19,234
- IRR
- -17.7%
- Equity multiple
- 0.03×
- Total profit
- $-34,952
- Equity at exit
- $11,154
Cash invested: $36,120 (down + closing). Projections, not guarantees.
Landlord ↔ Tenant lean methodology
- Overall (STATE)
- 87 Strongly Landlord-Friendly
- State Texas
- 87 Strongly Landlord-Friendly · R+5
- County
- — inherits STATE
- City
- — inherits STATE
ZIP-level market 79735
- Active inventory
- 108
- Price-to-rent
- 11.0×
Monthly cashflow live
- Estimated rent
- $975 medium interval (Pro) →
- Mortgage (P&I)
- −$676
- Tax from tax record
- −$162 /mo · $1,949/yr
- Insurance
- −$54
- HOA
- −$0
- Vacancy / Maint / Mgmt
- −$205
- Net cashflow
- $-122
Break-even live
Sensitivity live
| Price | -10% $-49 | -5% $-86 | +0% $-122 | +5% $-159 | +10% $-195 |
|---|---|---|---|---|---|
| Rent | -10% $-199 | -5% $-161 | +0% $-122 | +5% $-84 | +10% $-45 |
| Rate | -1.0pp $-57 | -0.5pp $-90 | base $-122 | +0.5pp $-156 | +1.0pp $-190 |
UW: 25.0% down · 7.5% · 30yr · 1.5% tax · 5.0% vac · 8.0% maint · 8.0% mgmt
Financing live
Cash to close
- Down payment
- $32,250
- Closing costs
- $3,870
- Reserves months
- —
- Total cash needed
- —
Loan-product check · same deal, 3 products live
Conventional
25% down · 7.5% · 30yr
- Down + closing
- —
- Monthly P&I
- —
- Monthly cashflow
- —
- DSCR
- —
- Eligible?
- —
Personal DTI + credit; lowest rate.
DSCR
20% down · 8.5% · 30yr
- Down + closing
- —
- Monthly P&I
- —
- Monthly cashflow
- —
- DSCR
- —
- Eligible?
- —
No personal income docs; deal must DSCR.
Hard money
10% down · 12.0% · 12mo
- Down + closing
- —
- Monthly P&I
- —
- Monthly cashflow
- —
- DSCR
- —
- Eligible?
- —
Short-term bridge; refi at stabilization.
Rent comps 1 comps
| Address | Beds | Baths | Sqft | Rent | $/sqft | DOM | Units | Dist |
|---|---|---|---|---|---|---|---|---|
| 902 N Missouri St Unit A Fort Stockton, TX | 2.0 | 1.0 | 910 | $975 | $1.07 | 45d | 1 | 1.32mi |
Listing history 12 events
-
2026-06-21days on market $129,000 Active 15 DOM
-
2026-06-21days on market $129,000 Active 14 DOM
-
2026-06-18days on market $129,000 Active 12 DOM
-
2026-06-17days on market $129,000 Active 11 DOM
-
2026-06-16days on market $129,000 Active 10 DOM
-
2026-06-15days on market $129,000 Active 9 DOM
-
2026-06-13days on market $129,000 Active 7 DOM
-
2026-06-12days on market $129,000 Active 6 DOM
-
2026-06-09days on market $129,000 Active 3 DOM
-
2026-06-08days on market $129,000 Active 2 DOM
-
2026-06-07remarks 585-char remark
-
2026-06-07$129,000 Active 1 DOM
ⓘ Source: listings_history table (triggers on properties + properties_extension) + one-shot
backfill from property_details.listing_events for pre-trigger history.
Tax reassessment forecast TX · Resets to sale price
- Current annual tax
- $1,949 · $162/mo
- Projected year-2 tax
- $2,361 · $197/mo
- Expected delta
- +$412/yr (+$34/mo · 21.1%)
ⓘ Screening estimate from a state-policy table — verify with the county assessor before closing.
Climate risk First Street
- Flood 1/10 Low 0% chance over 30 yrs
- Wildfire 6/10 Major
- Heat 6/10 Major 5 d/yr ≥101°F today · 15 d/yr by 30 yrs out
- Wind 1/10 Low 100% chance of damaging wind over 30 yrs
- Air quality 1/10 Low 0 unhealthy d/yr today · 0 by 30 yrs out
Nearby sold comps map
Loading sold comps map…
Walkable amenities ~0.75 mi
Loading nearby amenities…
Taxation est. · year 1
- Rental income
- $11,700
- − Mortgage interest
- −$7,226
- − Property taxes
- −$1,949
- − Insurance
- −$645
- − Repairs & maintenance
- −$936
- − Management
- −$936
- − Depreciation
- −$3,753
- Taxable loss
- −$3,745
- Est. tax savings @ 24.0%
- +$899
- After-tax cash flow
- $-570/yr
For passive investors: Depreciation is non-cash, so a rental often shows a tax loss while cash-flowing — sheltering income. Rental losses are passive: they offset passive income freely, and up to $25,000/yr can offset ordinary (W-2) income if you actively participate and your MAGI is under $100k (phasing out to $0 by $150k); unused losses carry forward. On sale, claimed depreciation is recaptured at up to 25%, and gains may owe capital-gains tax (a 1031 exchange can defer both). Figures are a year-1 estimate at your 24.0% rate — not tax advice; consult a CPA.
Schools (NCES district)
- District
- Fort Stockton ISD
- NCES district ID
- 4820190
- Math proficiency
- 23% ▼ -10.00%
- Reading proficiency
- 28% ▼ -5.00%
- Median HH income
- $43,194
- Composite
- 21.81/100
- National rank
- #8247
- State rank
- #709 of 826 in TX
Livability — Fort Stockton
- Score
- 67/100
- State rank
- #532
- US rank
- #10399
Category grades
Schools grade is shown separately in the Schools card above.
Census & demographics
- Census place
- Fort Stockton, TX
- Population (ZIP)
- 12,962
Population outlook (Pecos County) Hauer SSP2
- Today (2025)
- 17,291 people
- By 2030
- 17,999 · +4.1%
- By 2040
- 19,729 · +14.1%
- By 2050
- 21,655 · +25.2%
- By 2075
- 26,049 · +50.7%
- By 2100
- 27,196 · +57.3%
Race, ethnicity, and origin ACS 2023
- Neighborhood character
- Predominantly Hispanic (76%)
- Race & ethnicity
- Hispanic / Latino 76% Two or more races 23% White 17% Black 4% Asian 3%
- Hispanic origin (detail)
- Mexican 70%
- Common ancestry
- Italian 1% Slovak 1% Lithuanian 1%
- Foreign-born
- 13% · Canada
- Languages at home
- 47% English-only · Spanish 51% Other Indo-European 2%
Political lean MEDSL · Pecos
- 2024 margin
- Solid R (+44.8) · D 27.0% · R 71.9% · Other 1.1%
- 2008→2024 swing
- -19.8pp toward R · 2008: -25.0pp · 2024: -44.8pp
- All cycles
- 2024: R+44.8 2020: R+39.3 2016: R+21.9 2012: R+22.2 2008: R+25.0
Not yet ingested
- Civics
- —
Market trends
- HPI YoY
- ▼ -77.34%
- Current HPI
- 138.1106
- Rent YoY
- —
- Metro
- —
- State GDP YoY
- ▲ 3.95%
- F500 in state
- 110
Industry mix (Fortune 500 HQ in TX)
| Industry | F500 HQs | Revenue |
|---|---|---|
| Energy | 16 | $1,198B |
|
||
| Technology | 5 | $198B |
|
||
| Engineering / Construction | 4 | $72B |
|
||
| Energy Services | 3 | $60B |
|
||
| Utilities | 3 | $41B |
|
||
| Healthcare | 2 | $330B |
|
||
Price history
-27.1% since first listed6 events — show timeline
- 2026-06-06 Listed $129,000 PBBOR
- 2026-03-14 Price Changed $149,000 PBBOR
- 2025-07-26 Price Changed $157,900 PBBOR
- 2025-05-23 Price Changed $169,900 PBBOR
- 2025-02-20 Price Changed $176,900 PBBOR
- 1992-03-31 Sold (Public Records) — Public Records
Property tax history
+6.1%/yrLatest (2025): $1,949 · +10.1% YoY. Source: county tax records.
Cash-flow waterfall
monthlySold comps — $/sqft
last 12 mo · ≤1 miLoading sold comps…