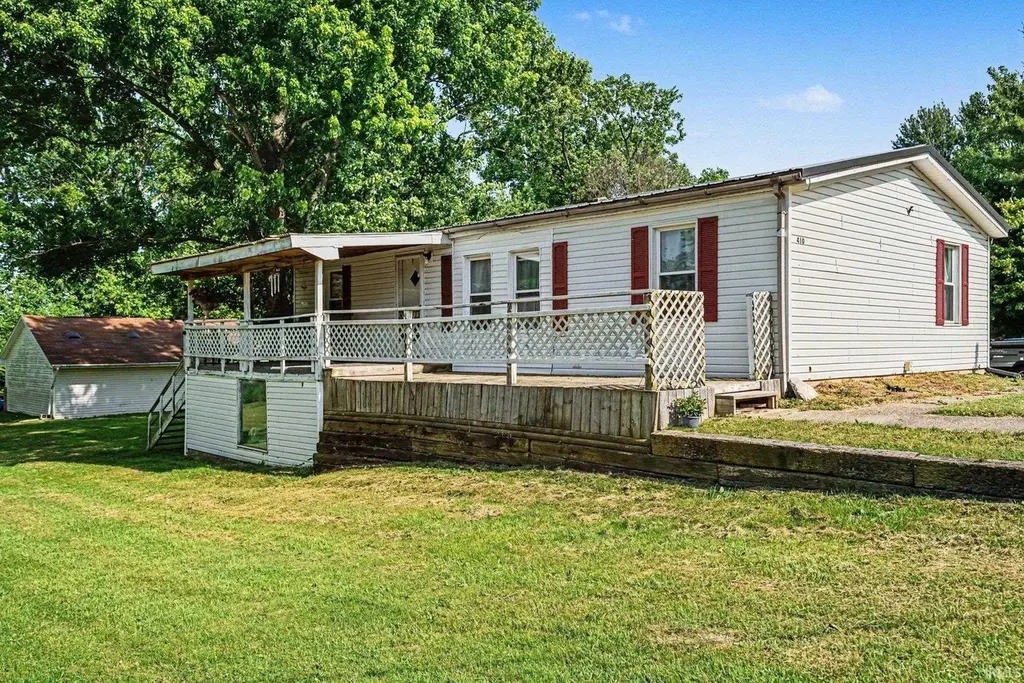
410 N 9th St · Goshen, IN
Flood risk 1/10 · Minimal
- FEMA flood zone
- X (unshaded)
- Chance of flooding over 30 yrs
- 0.0%
- Est. flood insurance / yr
- $473 – $860
Fire risk 1/10 · Minimal
- Est. fire insurance / yr
- $717 – $1,331
Heat risk 2/10 · Minimal
- Hot days now (above 100°F)
- 7 days/yr
- Hot days in 30 yrs
- 16 days/yr
Wind risk 2/10 · Minimal
- Chance of severe wind over 30 yrs
- —
Air-quality risk 2/10 · Minimal
- Unhealthy air days now
- 1 days/yr
- Unhealthy air days in 30 yrs
- 2 days/yr
Risk factors via First Street. Map © Google.
Why this score? — see what drove the F grade
The composite is a weighted blend of 9 inputs, each scored 0–100. Each bar is that input's sub-score; the figure is the points it added to the 100-point composite (weight × sub-score).
- Cash flow +14.7/30.0
- DSCR +4.5/10.0
- Livability +4.2/5.0
- 1% rule +3.5/10.0
- Schools +3.0/10.0
- Rent growth +2.5/5.0
- Condition / age +2.5/5.0
- ARV discount +0.0/15.0
- Appreciation +0.0/10.0
$171,900
🖨 Deal sheet (PDF) 📄 Offer letter ✓ Due diligence
Listing remarks
Affordable 4 bedroom, 3 bathroom home offering space, comfort, and value. Features include a full basement with a private exterior entrance, kitchen area with stove, refrigerator, and dining space, providing flexibility for a variety of living arrangements. The home also offers abundant storage, a detached 1 car garage, and an additional detached 2 car garage/shop with extra room for storage, projects, hobbies, or a workspace. The backyard is naturally shaded by mature trees, creating a great setting for relaxing or entertaining. Central air adds comfort during the warmer months. A great opportunity for first time homebuyers looking to build equity. Offered in its current condition, this we
Key facts
- Kitchen area
- Detached garage shop
- Full basement
Tags
Property features AI
Exterior
- Parking: Detached 2-car garage; Second garage (additional structure)
- Utilities: Public water; Public sewer
- Home design: Manufactured home (single-story); Residential property
- Construction: Shingle siding; Metal roof; Built-in living area above grade: 960
- Exterior features: Deck; Level lot
Interior
- Kitchen: Refrigerator; Electric range; Gas range
- Bathrooms: Three full bathrooms; Two bathrooms on the main level
- Heating & cooling: Natural gas heating; Central air conditioning
- Interior features: Full basement; 8 total rooms
- Laundry & utility: Washer; Dryer; Main-level laundry; Gas water heater
Neighborhood map
What this means for you Summary
Snapshot
- This is a 3-bed/1.0-bath manufactured listed at $172k.
Deal economics
- At list price, monthly cash flow is $44 ($533/yr) — positive.
- The deal already cash-flows at list — no discount required.
- To meet the 1% rule (rent ≥ 1% of price), the offer needs to be $146k (15.2% below list).
- Recommended offer: $146k (15.2% below list) — sets the bar for 1% rule.
- Cap rate 6.6% vs local median 3.1% in Goshen — top-decile yield for the area; either an underpriced asset or a hidden risk that comps aren't pricing in. Stress-test before assuming the spread holds.
Location & tenants
- Location reads 85/100 on livability (#4 in IN, #622 nationally) — a professional / high-income tenant draw. Strengths: commute A+, cost of living A+, housing A+; Watch: employment D+.
- Goshen Community Schools (urban): math 31% / reading 40% proficiency, ranked #190 of 301 in IN (top 63%) — families likely to look elsewhere, expect single-tenant / working-renter base with shorter leases.
- Zoned schools: Chamberlain Elementary School (math 22% / reading 17%, grade F, #814 of 994 statewide, top 83%, 261 students, 82% FRL); Goshen Junior High School (math 25% / reading 38%, grade F, #197 of 330 statewide, top 60%, 1,001 students, 70% FRL); Goshen High School (math 32% / reading 65%, grade D, #139 of 369 statewide, top 38%, 2,004 students, 64% FRL).
- Market conditions: 77 active listings in the ZIP; 4 comparable units currently listed for rent nearby; rentals at typical pace (median 23d on market — plan ~3-4 weeks tenant-placement turnaround); 484 units permitted in Elkhart County in 2024 (136 in 5+ unit buildings).
Forward outlook
- Local home prices are declining (-3.0%/yr); year-one equity from $1k of loan paydown is wiped out by about $5k of value loss. Plan a longer hold.
- Elkhart County population projected at +7% by 2050 — modest demand growth; plan on rents tracking national, not racing it.
Negotiation context
- It's been on market 15 days — a 2% lower offer ($169k) is reasonable based on typical stale-listing flexibility.
- Current owner paid $72k; list at $172k implies a 139% gain — meaningful room to come down on a strong offer.
Questions for the listing agent
- Is there a deadline driving the sale (1031 exchange, divorce, estate, relocation)? That informs how much negotiation room exists.
- Schools are D-rated, which usually means shorter tenancies and higher turnover. Who's the typical renter profile here, and what's been the actual vacancy rate?
- The area grade is low — what's the realistic commute time and amenity access for the typical tenant pool here? Any planned neighborhood developments (good or bad) we should know about?
- What's the average days-on-market for RENTAL listings here right now (not sales)? A rising rental-DOM trend means longer vacancies and softer asking-rent achievability than the comps imply.
- What's the recent tenant-quality profile in this submarket — average credit score on applications, eviction rate, late-payment / NSF rate, and stable-employment percentage? A property-management company in the area should have these aggregated.
- How much new for-sale + rental construction is in the pipeline within 1–3 miles? Heavy new supply typically softens prices + rents 12–24 months out; constrained supply supports both.
Investment metrics
- 1% rule
- 0.85% ✗
- Cap rate
- 6.60%
- Cash-on-cash
- 1.11%
- DSCR
- 1.05
- GRM
- 9.8
CMA / ARV
- ARV (on-the-fly)
- $123,840
- Comps found
- 1
Show comp detail 1 sale within ~0.75 mi
| Address | Dist | Beds/Ba | Sqft | Sold | Price | $/sf | Match |
|---|---|---|---|---|---|---|---|
| 1015 N 6th St | 0.57mi | 3/2.0 | 1,080 (+12%) | 24mo | $139,000 | $129 | 29 |
Match score weights: distance 35% · size 25% · config 20% · recency 20%. Top-matched comps best support the ARV.
Projected returns pro-forma
-3.0% appreciation · 3.0% rent growth · sell at horizon
- IRR
- -14.6%
- Equity multiple
- 0.48×
- Total profit
- $-25,053
- Equity at exit
- $25,631
- IRR
- -5.9%
- Equity multiple
- 0.62×
- Total profit
- $-18,284
- Equity at exit
- $14,863
Cash invested: $48,132 (down + closing). Projections, not guarantees.
Landlord ↔ Tenant lean methodology
- Overall (STATE)
- 90 Strongly Landlord-Friendly
- State Indiana
- 90 Strongly Landlord-Friendly · R+11
- County
- — inherits STATE
- City
- — inherits STATE
ZIP-level market 46528
- Home prices YoY
- -26.9%
- Active inventory
- 77
- Price-to-rent
- 9.8×
Monthly cashflow live
- Estimated rent
- $1,458 medium interval (Pro) →
- Mortgage (P&I)
- −$901
- Tax from tax record
- −$135 /mo · $1,615/yr
- Insurance
- −$72
- HOA
- −$0
- Vacancy / Maint / Mgmt
- −$306
- Net cashflow
- $44
Break-even live
Sensitivity live
| Price | -10% $142 | -5% $93 | +0% $44 | +5% $-4 | +10% $-53 |
|---|---|---|---|---|---|
| Rent | -10% $-71 | -5% $-13 | +0% $44 | +5% $102 | +10% $160 |
| Rate | -1.0pp $131 | -0.5pp $88 | base $44 | +0.5pp $0 | +1.0pp $-45 |
UW: 25.0% down · 7.5% · 30yr · 1.5% tax · 5.0% vac · 8.0% maint · 8.0% mgmt
Financing live
Cash to close
- Down payment
- $42,975
- Closing costs
- $5,157
- Reserves months
- —
- Total cash needed
- —
Loan-product check · same deal, 3 products live
Conventional
25% down · 7.5% · 30yr
- Down + closing
- —
- Monthly P&I
- —
- Monthly cashflow
- —
- DSCR
- —
- Eligible?
- —
Personal DTI + credit; lowest rate.
DSCR
20% down · 8.5% · 30yr
- Down + closing
- —
- Monthly P&I
- —
- Monthly cashflow
- —
- DSCR
- —
- Eligible?
- —
No personal income docs; deal must DSCR.
Hard money
10% down · 12.0% · 12mo
- Down + closing
- —
- Monthly P&I
- —
- Monthly cashflow
- —
- DSCR
- —
- Eligible?
- —
Short-term bridge; refi at stabilization.
Rent comps 4 comps
| Address | Beds | Baths | Sqft | Rent | $/sqft | DOM | Units | Dist |
|---|---|---|---|---|---|---|---|---|
| 251 Woodridge Ct Apt A Goshen, IN | 3.0 | 1.0 | 1034 | $1,195 | $1.16 | 23d | 1 | 0.82mi |
| 265 Woodridge Ct Apt B Goshen, IN | 3.0 | 1.0 | 1034 | $1,295 | $1.25 | 45d | 1 | 0.86mi |
| 275 Woodridge Ct Apt C Goshen, IN | 3.0 | 1.0 | 1034 | $1,495 | $1.45 | 23d | 1 | 0.86mi |
| 1401 Park 33 Blvd Goshen, IN | 1.0–3.0 | 1.0–2.0 | 1170 | $2,255 | $1.93 | 23d | 20 | 1.50mi |
Listing history 13 events
-
2026-06-22days on market $171,900 Active 15 DOM
-
2026-06-19days on market $171,900 Active 13 DOM
-
2026-06-18days on market $171,900 Active 12 DOM
-
2026-06-17days on market $171,900 Active 11 DOM
-
2026-06-16days on market $171,900 Active 10 DOM
-
2026-06-15days on market $171,900 Active 9 DOM
-
2026-06-14days on market $171,900 Active 7 DOM
-
2026-06-13days on market $171,900 Active 6 DOM
-
2026-06-10days on market $171,900 Active 4 DOM
-
2026-06-09days on market $171,900 Active 3 DOM
-
2026-06-08days on market $171,900 Active 2 DOM
-
2026-06-07remarks 699-char remark
-
2026-06-07$171,900 Active 1 DOM
ⓘ Source: listings_history table (triggers on properties + properties_extension) + one-shot
backfill from property_details.listing_events for pre-trigger history.
Tax reassessment forecast IN · Partial reset (capped growth)
- Current annual tax
- $1,615 · $135/mo
- Projected year-2 tax
- $1,615 · $135/mo
- Expected delta
- $0/yr ($0/mo · -0.0%)
ⓘ Screening estimate from a state-policy table — verify with the county assessor before closing.
Climate risk First Street
- Flood 1/10 Low FEMA zone X (unshaded) · 0% chance over 30 yrs
- Wildfire 1/10 Low
- Heat 2/10 Low 7 d/yr ≥100°F today · 16 d/yr by 30 yrs out
- Wind 2/10 Low
- Air quality 2/10 Low 1 unhealthy d/yr today · 2 by 30 yrs out
Nearby sold comps map
Loading sold comps map…
Walkable amenities ~0.75 mi
Loading nearby amenities…
Taxation est. · year 1
- Rental income
- $17,500
- − Mortgage interest
- −$9,629
- − Property taxes
- −$1,615
- − Insurance
- −$860
- − Repairs & maintenance
- −$1,400
- − Management
- −$1,400
- − Depreciation
- −$5,001
- Taxable loss
- −$2,404
- Est. tax savings @ 24.0%
- +$577
- After-tax cash flow
- $1,110/yr
For passive investors: Depreciation is non-cash, so a rental often shows a tax loss while cash-flowing — sheltering income. Rental losses are passive: they offset passive income freely, and up to $25,000/yr can offset ordinary (W-2) income if you actively participate and your MAGI is under $100k (phasing out to $0 by $150k); unused losses carry forward. On sale, claimed depreciation is recaptured at up to 25%, and gains may owe capital-gains tax (a 1031 exchange can defer both). Figures are a year-1 estimate at your 24.0% rate — not tax advice; consult a CPA.
Schools (NCES district)
- District
- Goshen Community Schools
- NCES district ID
- 1803930
- Math proficiency
- 31% ▼ -11.00%
- Reading proficiency
- 40% ▼ -4.00%
- Median HH income
- $44,892
- Composite
- 30.24/100
- National rank
- #6292
- State rank
- #190 of 301 in IN
Livability — Goshen
- Score
- 85/100
- State rank
- #4
- US rank
- #622
Category grades
Schools grade is shown separately in the Schools card above.
Census & demographics
- Census place
- Goshen, IN
- City population
- 33,668
- Population (ZIP)
- 26,356
Population outlook (Elkhart County) Hauer SSP2
- Today (2025)
- 213,761 people
- By 2030
- 218,103 · +2.0%
- By 2040
- 225,381 · +5.4%
- By 2050
- 229,447 · +7.3%
- By 2075
- 232,856 · +8.9%
- By 2100
- 214,088 · +0.2%
Race, ethnicity, and origin ACS 2023
- Neighborhood character
- Predominantly White (76%)
- Race & ethnicity
- White 76% Hispanic / Latino 19% Two or more races 7% Black 2% Asian 1%
- Hispanic origin (detail)
- Mexican 16%
- Common ancestry
- Italian 3% Iranian 2% Polish 2%
- Foreign-born
- 9% · Canada, South Korea, Jamaica
- Languages at home
- 73% English-only · Spanish 14% German/W. Germanic 11% Russian/Polish/Slavic 1%
Political lean MEDSL · Elkhart
- 2024 margin
- Solid R (+32.4) · D 33.1% · R 65.5% · Other 1.4%
- 2008→2024 swing
- -21.2pp toward R · 2008: -11.2pp · 2024: -32.4pp
- All cycles
- 2024: R+32.4 2020: R+28.1 2016: R+32.4 2012: R+26.5 2008: R+11.2
Not yet ingested
- Civics
- —
Market trends
- HPI YoY
- ▼ -85.40%
- Current HPI
- 231.4441
- Rent YoY
- —
- Metro
- —
- State GDP YoY
- ▲ 2.90%
- F500 in state
- 18
Industry mix (Fortune 500 HQ in IN)
| Industry | F500 HQs | Revenue |
|---|---|---|
| Industrial Machinery | 2 | $37B |
|
||
| Healthcare | 1 | $177B |
|
||
| Pharmaceuticals | 1 | $45B |
|
||
| Metals / Steel | 1 | $18B |
|
||
| Agriculture | 1 | $17B |
|
||
| Packaging | 1 | $12B |
|
||
Price history
+138.8% since first listed2 events — show timeline
- 2026-06-06 Listed $171,900 IRMLS
- 1999-10-25 Sold (Public Records) $72,000 Public Records
Property tax history
+5.6%/yrLatest (2025): $1,615 · -12.1% YoY. Source: county tax records.
Cash-flow waterfall
monthlySold comps — $/sqft
last 12 mo · ≤1 miLoading sold comps…