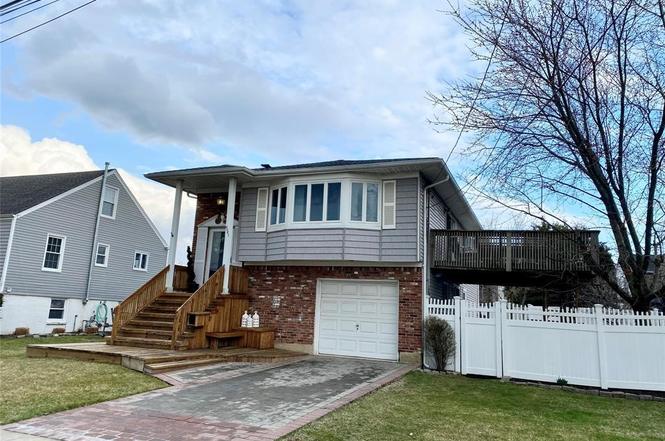
4081 Massachusetts Ave · Barnum Island, NY
Flood risk 8/10 · Major
- FEMA flood zone
- AE
- Chance of flooding over 30 yrs
- 0.99%
- Est. flood insurance / yr
- $2,026 – $9,024
Fire risk 2/10 · Minimal
- Est. fire insurance / yr
- $691 – $1,283
Heat risk 6/10 · Moderate
- Hot days now (above 95°F)
- 7 days/yr
- Hot days in 30 yrs
- 16 days/yr
Wind risk 8/10 · Major
- Chance of severe wind over 30 yrs
- 80.0%
Air-quality risk 4/10 · Minor
- Unhealthy air days now
- 4 days/yr
- Unhealthy air days in 30 yrs
- 6 days/yr
Risk factors via First Street. Map © Google.
Why this score? — see what drove the D grade
The composite is a weighted blend of 9 inputs, each scored 0–100. Each bar is that input's sub-score; the figure is the points it added to the 100-point composite (weight × sub-score).
- Cash flow +14.4/30.0
- ARV discount +7.7/15.0
- Schools +4.7/10.0
- DSCR +4.4/10.0
- Livability +3.9/5.0
- 1% rule +3.8/10.0
- Rent growth +2.5/5.0
- Condition / age +2.5/5.0
- Appreciation +0.0/10.0
$745,000
🖨 Deal sheet 📄 Offer letter ✓ Due diligence
Listing remarks
This is the one to see , there is plenty of room for everyone. Open Large Living room & Dining room offers gleaming HW floors. The dining room has sliders to the upper deck. The cook will appreciate the open work space and the kitchen island for prepping meals. Offering 4 Bedrooms, 3 baths, 1 Jetted tub plus a 1 walk-in tub for your relaxation. Lower level offers a dedicated room with its own separate entrance & can serve as a perfect home office or study area, Multi-purpose Great room has sliders to the yard, Ideal for hosting gatherings, the yard is fully enclosed and features a hot tub and a brick patio This Low tax home is on a quiet dead -end street but is conveniently l
Key facts
- Hot tub
- Large living room
- Dining room
Tags
Neighborhood map
What this means for you Summary
Snapshot
- This is a 4-bed/2.0-bath single-family listed at $745k.
Deal economics
- At list price, monthly cash flow is $-311 ($-4k/yr) — negative.
- To cash-flow at today's rent, offer at most $690k (7.4% below list).
- To meet the 1% rule (rent ≥ 1% of price), the offer needs to be $659k (11.5% below list).
- Recommended offer: $659k (11.5% below list) — sets the bar for 1% rule.
Location & tenants
- Location reads 77/100 on livability (#191 in NY, #2,830 nationally) — a middle-class / working-renter tenant base. Strengths: crime A+, commute A+, employment A+; Watch: cost of living F.
- Island Park Union Free School District (suburban): math 43% / reading 62% proficiency, ranked #300 of 590 in NY (top 51%) — acceptable for families but not a draw, mixed tenant base, ~2y average lease.
- Zoned schools: Francis X Hegarty Elementary School (math 42% / reading 72%, grade C+, #842 of 2,108 statewide, top 43%, 415 students, 34% FRL); Island Park Lincoln Orens Middle School (math 42% / reading 57%, grade C, #280 of 729 statewide, top 40%, 271 students, 44% FRL).
- Market conditions: 43 active listings in the ZIP; 6 comparable units currently listed for rent nearby; rentals leasing fast (median 1d on market — plan ~1-2 weeks tenant-placement turnaround); high-income renter base; 824 units permitted in Nassau County in 2024 (153 in 5+ unit buildings).
- At $6,590/mo this rent would consume 71% of the median local household income ($111k/yr) (locally 371% of renters already pay >50% of income on rent) — very limited rent-growth headroom before tenants either downsize or default.
Forward outlook
- Local home prices are declining (-3.0%/yr); year-one equity from $5k of loan paydown is wiped out by about $22k of value loss. Plan a longer hold.
- Nassau County population projected at +7% by 2050 — modest demand growth; plan on rents tracking national, not racing it.
Negotiation context
- It's been on market 100 days — a 9% lower offer ($678k) is reasonable based on typical stale-listing flexibility.
- 2 sale attempts with the ask held roughly flat each time — persistent listings suggest the price (not the market) is what's stuck; bring a comps-based counter.
Risks & watch-outs
- Watch-outs: flood insurance adds $460/mo.
- Climate carrying-cost: in FEMA flood zone AE (mandatory federal flood insurance); severe wind risk, 80% chance of damaging wind over 30y; extreme-heat days projected 7→16/yr by 2055 (HVAC capex compounding) — expect insurance premiums to compound above CPI over the hold.
Questions for the listing agent
- What do current leases actually rent for vs. the listed asking? Can we see a recent rent roll and the last 12 months of T-12 income?
- It's been on market 100 days. Have you received any prior offers? Is the seller open to a 12% concession, seller financing, or rate buy-down credit?
- Built in 1973 — when were the roof, HVAC, electrical panel, plumbing, and water heater last replaced?
- What's the actual annual flood-insurance premium (NFIP or private), and is the property in a SFHA with mandatory coverage?
- Why hasn't it sold? Are there any deal-killer items the seller is aware of (foundation, flood, title, zoning, code violations)?
- Is there a deadline driving the sale (1031 exchange, divorce, estate, relocation)? That informs how much negotiation room exists.
- Schools are D-rated, which usually means shorter tenancies and higher turnover. Who's the typical renter profile here, and what's been the actual vacancy rate?
- The area grade is low — what's the realistic commute time and amenity access for the typical tenant pool here? Any planned neighborhood developments (good or bad) we should know about?
- What's the average days-on-market for RENTAL listings here right now (not sales)? A rising rental-DOM trend means longer vacancies and softer asking-rent achievability than the comps imply.
- What's the recent tenant-quality profile in this submarket — average credit score on applications, eviction rate, late-payment / NSF rate, and stable-employment percentage? A property-management company in the area should have these aggregated.
- How much new for-sale + rental construction is in the pipeline within 1–3 miles? Heavy new supply typically softens prices + rents 12–24 months out; constrained supply supports both.
Investment metrics
- 1% rule
- 0.88% ✗
- Cap rate
- 6.53%
- Cash-on-cash
- 0.86%
- DSCR
- 1.04
- GRM
- 9.4
CMA / ARV
- ARV (on-the-fly)
- $747,770
- Comps found
- 10
Show comp detail 10 sales within ~0.75 mi
| Address | Dist | Beds/Ba | Sqft | Sold | Price | $/sf | Match |
|---|---|---|---|---|---|---|---|
| 121 Atlantic Pl S | 0.12mi | 4/2.0 | 2,000 (-1%) | 8mo | $1,370,000 | $685 | 86 |
| 189 Pennsylvania Ave | 0.48mi | 4/2.0 | 2,002 (-1%) | 6mo | $740,000 | $370 | 70 |
| 73 Parma Rd | 0.63mi | 4/2.0 | 1,982 (-2%) | 2mo | $825,000 | $416 | 66 |
| 41 Florida Ave | 0.23mi | 3/2.0 (-1) | 1,917 (-5%) | 23mo | $621,000 | $324 | 56 |
| 61 Parma Rd | 0.65mi | 3/2.0 (-1) | 2,070 (+2%) | 11mo | $750,000 | $362 | 52 |
| 6 Jackson Pl | 0.69mi | 3/1.5 (-1) | 2,000 (-1%) | 10mo | $740,000 | $370 | 51 |
| 4274 Broadway | 0.41mi | 5/2.0 (+1) | 2,323 (+15%) | 0mo | $750,000 | $323 | 51 |
| 66 Parma Rd | 0.66mi | 4/2.0 | 2,200 (+9%) | 8mo | $738,000 | $335 | 48 |
| 206 Hamilton Ave | 0.65mi | 3/2.0 (-1) | 2,123 (+5%) | 11mo | $815,000 | $384 | 47 |
| 333 Vanderbilt Ave | 0.68mi | 4/3.0 | 2,149 (+6%) | 8mo | $925,000 | $430 | 47 |
Match score weights: distance 35% · size 25% · config 20% · recency 20%. Top-matched comps best support the ARV.
Projected returns pro-forma
-3.0% appreciation · 3.0% rent growth · sell at horizon
- IRR
- -19.2%
- Equity multiple
- 0.33×
- Total profit
- $-140,195
- Equity at exit
- $111,082
- IRR
- -11.7%
- Equity multiple
- 0.30×
- Total profit
- $-146,249
- Equity at exit
- $64,414
Cash invested: $208,600 (down + closing). Projections, not guarantees.
Landlord ↔ Tenant lean methodology
- Overall (STATE)
- 15 Strongly Tenant-Friendly
- State New York
- 15 Strongly Tenant-Friendly · D+10
- County
- — inherits STATE
- City
- — inherits STATE
ZIP-level market 11558
- Home prices YoY
- -24.6%
- Active inventory
- 43
- Price-to-rent
- 9.4×
Monthly cashflow live
- Estimated rent
- $6,590 high interval (Pro) →
- Mortgage (P&I)
- −$3,907
- Tax from tax record
- −$840 /mo · $10,075/yr
- Insurance
- −$310
- Flood insurance flood zone
- −$460 /mo · $5,525/yr
- HOA
- −$0
- Vacancy / Maint / Mgmt
- −$1,384
- Net cashflow
- $-311
Break-even live
UW: 25.0% down · 7.5% · 30yr · 1.5% tax · 5.0% vac · 8.0% maint · 8.0% mgmt
Financing live
Cash to close
- Down payment
- $186,250
- Closing costs
- $22,350
- Reserves months
- —
- Total cash needed
- —
Loan-product check · same deal, 3 products live
Conventional
25% down · 7.5% · 30yr
- Down + closing
- —
- Monthly P&I
- —
- Monthly cashflow
- —
- DSCR
- —
- Eligible?
- —
Personal DTI + credit; lowest rate.
DSCR
20% down · 8.5% · 30yr
- Down + closing
- —
- Monthly P&I
- —
- Monthly cashflow
- —
- DSCR
- —
- Eligible?
- —
No personal income docs; deal must DSCR.
Hard money
10% down · 12.0% · 12mo
- Down + closing
- —
- Monthly P&I
- —
- Monthly cashflow
- —
- DSCR
- —
- Eligible?
- —
Short-term bridge; refi at stabilization.
Rent comps 6 comps
| Address | Beds | Baths | Sqft | Rent | $/sqft | DOM | Units | Dist |
|---|---|---|---|---|---|---|---|---|
| 65 Florida Ave Island Park, NY | 4.0 | 2.0 | 1633 | $5,900 | $3.61 | 1d | 1 | 0.22mi |
| 81 Barnes St Unit 1 Long Beach, NY | 4.0 | 2.5 | 1600 | $12,500 | $7.81 | 1d | 1 | 1.04mi |
| 26 Lancaster Rd Island Park, NY | 3.0 | 2.0 | 1600 | $3,950 | $2.47 | 1d | 1 | 1.06mi |
| 100 Harbor Ter Island Park, NY | 1.0–3.0 | 1.0–3.0 | 1342 | $5,700 | $4.25 | 1d | 1 | 1.30mi |
| 429 E Park Ave Unit 2nd Floor Long Beach, NY | 3.0 | 2.0 | 2791 | $4,350 | $1.56 | 43d | 1 | 1.43mi |
| 329 E Chester St Long Beach, NY | 3.0 | 2.0 | 1658 | $9,300 | $5.61 | 1d | 1 | 1.44mi |
Listing history 8 events
-
2026-01-12status Pending
-
2025-12-06price $745,000
-
2025-11-13price $765,000
-
2025-10-03$775,000 Active
-
2025-09-27historical
-
2025-06-20price $809,000
-
2025-05-02price $829,000
-
2025-03-25$849,000 Active
ⓘ Source: listings_history table (triggers on properties + properties_extension) + one-shot
backfill from property_details.listing_events for pre-trigger history.
Tax reassessment forecast NY · Partial reset (capped growth)
- Current annual tax
- $10,075 · $840/mo
- Projected year-2 tax
- $11,333 · $944/mo
- Expected delta
- +$1,258/yr (+$105/mo · 12.5%)
ⓘ Screening estimate from a state-policy table — verify with the county assessor before closing.
Climate risk First Street
- Flood 8/10 Severe FEMA zone AE · 99% chance over 30 yrs
- Wildfire 2/10 Low
- Heat 6/10 Major 7 d/yr ≥95°F today · 16 d/yr by 30 yrs out
- Wind 8/10 Severe 80% chance of damaging wind over 30 yrs
- Air quality 4/10 Moderate 4 unhealthy d/yr today · 6 by 30 yrs out
Nearby sold comps map
Loading sold comps map…
Walkable amenities ~0.75 mi
Loading nearby amenities…
Taxation est. · year 1
- Rental income
- $79,085
- − Mortgage interest
- −$41,732
- − Property taxes
- −$10,075
- − Insurance
- −$9,250
- − Repairs & maintenance
- −$6,327
- − Management
- −$6,327
- − Depreciation
- −$21,673
- Taxable loss
- −$16,298
- Est. tax savings @ 24.0%
- +$3,912
- After-tax cash flow
- $181/yr
For passive investors: Depreciation is non-cash, so a rental often shows a tax loss while cash-flowing — sheltering income. Rental losses are passive: they offset passive income freely, and up to $25,000/yr can offset ordinary (W-2) income if you actively participate and your MAGI is under $100k (phasing out to $0 by $150k); unused losses carry forward. On sale, claimed depreciation is recaptured at up to 25%, and gains may owe capital-gains tax (a 1031 exchange can defer both). Figures are a year-1 estimate at your 24.0% rate — not tax advice; consult a CPA.
Schools (NCES district)
- District
- Island Park Union Free School District
- NCES district ID
- 3615480
- Math proficiency
- 43% ▼ -15.00%
- Reading proficiency
- 62% ▲ 12.00%
- Median HH income
- $78,138
- Composite
- 47.47/100
- National rank
- #2279
- State rank
- #300 of 590 in NY
Livability — Barnum Island
- Score
- 77/100
- State rank
- #191
- US rank
- #2830
Category grades
Schools grade is shown separately in the Schools card above.
Census & demographics
- Census place
- Barnum Island, NY
- County
- Nassau County · 653,051 people
- City population
- 8,532
- Metro
- New York-Newark-Jersey City, NY-NJ-PA
- Population (ZIP)
- 8,454
- Household income
- $111,032
- Rent vs Own
- Severe rent burden
- 371.0
Population outlook (Nassau County) Hauer SSP2
- Today (2025)
- 1,409,302 people
- By 2030
- 1,431,482 · +1.6%
- By 2040
- 1,471,607 · +4.4%
- By 2050
- 1,502,845 · +6.6%
- By 2075
- 1,575,403 · +11.8%
- By 2100
- 1,554,356 · +10.3%
Race, ethnicity, and origin ACS 2023
- Neighborhood character
- Predominantly White (73%)
- Race & ethnicity
- White 73% Hispanic / Latino 15% Two or more races 8% Asian 5% Black 2%
- Hispanic origin (detail)
- Mexican 1% Puerto Rican 3%
- Common ancestry
- Romanian 4% American 4% Scotch-Irish 2%
- Foreign-born
- 20% · Canada, Jamaica, China
- Languages at home
- 75% English-only · Spanish 12% Russian/Polish/Slavic 6% Other Indo-European 4%
Political lean MEDSL · Nassau
- 2024 margin
- Toss-up / Even · D 47.9% · R 52.1%
- 2008→2024 swing
- -12.6pp toward R · 2008: 8.4pp · 2024: -4.2pp
- All cycles
- 2024: R+4.2 2020: D+9.5 2016: D+5.3 2012: D+6.7 2008: D+8.4
Not yet ingested
- Civics
- —
Market trends
- HPI YoY
- ▼ -106.33%
- Current HPI
- 326.289
- Rent YoY
- —
- Metro
- New York-Newark-Jersey City, NY-NJ-PA
- State GDP YoY
- ▲ 2.60%
- F500 in state
- 92
Industry mix (Fortune 500 HQ in NY)
| Industry | F500 HQs | Revenue |
|---|---|---|
| Financial Services | 10 | $950B |
|
||
| Consumer Goods | 9 | $162B |
|
||
| Insurance | 4 | $225B |
|
||
| Telecommunications | 2 | $144B |
|
||
| Pharmaceuticals | 2 | $112B |
|
||
| Media / Entertainment | 2 | $69B |
|
||
Price history
-12.2% since first listed8 events — show timeline
- 2026-01-12 Pending — OneKey® MLS as Distributed by MLS Grid
- 2025-12-06 Price Changed $745,000 OneKey® MLS as Distributed by MLS Grid
- 2025-11-13 Price Changed $765,000 OneKey® MLS as Distributed by MLS Grid
- 2025-10-03 Listed $775,000 OneKey® MLS as Distributed by MLS Grid
- 2025-09-27 Listing Removed — OneKey® MLS as Distributed by MLS Grid
- 2025-06-20 Price Changed $809,000 OneKey® MLS as Distributed by MLS Grid
- 2025-05-02 Price Changed $829,000 OneKey® MLS as Distributed by MLS Grid
- 2025-03-25 Listed $849,000 OneKey® MLS as Distributed by MLS Grid
Property tax history
+2.3%/yrLatest (2024): $10,075 · +16.1% YoY. Source: county tax records.
Cash-flow waterfall
monthlySold comps — $/sqft
last 12 mo · ≤1 miLoading sold comps…