1728 Centro West St · Tiburon, CA
Flood risk 1/10 · Minimal
- FEMA flood zone
- X (unshaded)
- Chance of flooding over 30 yrs
- 0.0%
- Est. flood insurance / yr
- $507 – $1,088
Fire risk 1/10 · Minimal
- Est. fire insurance / yr
- $659 – $1,223
Heat risk 3/10 · Minor
- Hot days now (above 79°F)
- 8 days/yr
- Hot days in 30 yrs
- 18 days/yr
Wind risk 1/10 · Minimal
- Chance of severe wind over 30 yrs
- —
Air-quality risk 8/10 · Major
- Unhealthy air days now
- 13 days/yr
- Unhealthy air days in 30 yrs
- 13 days/yr
Risk factors via First Street. Map © Google.
Why this score? — see what drove the C- grade
The composite is a weighted blend of 9 inputs, each scored 0–100. Each bar is that input's sub-score; the figure is the points it added to the 100-point composite (weight × sub-score).
- ARV discount +15.0/15.0
- Appreciation +8.2/10.0
- Cash flow +8.0/30.0
- Schools +6.5/10.0
- Rent growth +3.9/5.0
- Livability +3.5/5.0
- Condition / age +2.5/5.0
- DSCR +2.1/10.0
- 1% rule +1.2/10.0
$1,499,999
🖨 Deal sheet (PDF) 📄 Offer letter ✓ Due diligence
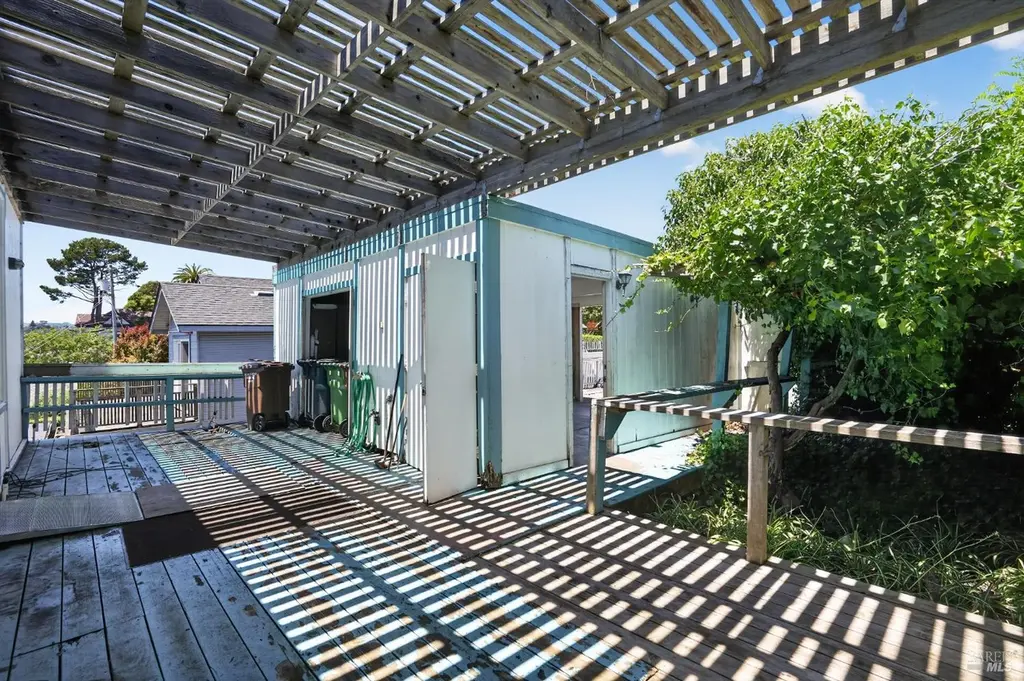
Listing remarks
Views, location, and opportunity all in one. An extraordinary chance to design and personalize your dream residence in the heart of Tiburon. Enjoy stunning views and a setting that feels above it all, while just moments from tennis courts, waterfront dining, boutique shopping, and the very best of the Tiburon lifestyle. This is your chance to have it all.
Key facts
- Waterfront dining
- Heart of tiburon
- Tennis courts
Tags
Property features AI
Finance
- Other: Located in Tiburon area
- HOA & community: No homeowners association; Not a senior community
Exterior
- Parking: Attached, covered side-by-side parking for 2 vehicles
- Utilities: Utilities: Other; Sewer: Other; No on-site power production
- Home design: Single family residence; Residential property
- Construction: No basement
- Exterior features: Lot features: Other; Does not allow horses; No private pool or spa
Interior
- Kitchen: Kitchen on main level
- Bedrooms: 3 bedrooms
- Bathrooms: 2 bathrooms (1 full, 1 partial)
- Heating & cooling: Central heating; Cooling: Other
- Interior features: One fireplace; Main level includes kitchen and living room; Two stories
- Laundry & utility: Laundry features available
Neighborhood map
What this means for you Summary
Snapshot
- This is a 3-bed/2.0-bath single-family listed at $1.50M.
Deal economics
- At list price, monthly cash flow is $-2k ($-18k/yr) — negative.
- To cash-flow at today's rent, offer at most $1.23M (17.8% below list).
- To meet the 1% rule (rent ≥ 1% of price), the offer needs to be $927k (38.2% below list).
- Recommended offer: $927k (38.2% below list) — sets the bar for 1% rule.
- Cap rate 5.1% vs local median 0.3% in Tiburon — top-decile yield for the area; either an underpriced asset or a hidden risk that comps aren't pricing in. Stress-test before assuming the spread holds.
Location & tenants
- Location reads 69/100 on livability (#247 in CA) — a middle-class / working-renter tenant base. Strengths: crime A+, commute A+, employment A+; Watch: housing C-, amenities F, cost of living F.
- Tamalpais Union High (suburban): math 62% / reading 78% proficiency, ranked #42 of 517 in CA (top 8%) — strong family-tenant draw, lease renewals of 3-5y typical.
- Zoned schools: Reed Elementary (335 students, 4% FRL); Del Mar Middle (math 77% / reading 83%, grade A+, #17 of 498 statewide, top 3%, 385 students, 6% FRL); Redwood High (math 67% / reading 81%, grade B+, #85 of 1,170 statewide, top 8%, 1,862 students, 8% FRL).
- Market conditions: Rents rising fast (+5.5%/yr); 79 active listings in the ZIP; 4 comparable units currently listed for rent nearby; rentals leasing fast (median 0d on market — plan ~1-2 weeks tenant-placement turnaround); high-income renter base; 149 units permitted in Marin County in 2024 (5 in 5+ unit buildings).
- At $9,271/mo this rent would consume 45% of the median local household income ($246k/yr) (locally 461% of renters already pay >50% of income on rent) — very limited rent-growth headroom before tenants either downsize or default.
Forward outlook
- In year one you build about $105k of equity ($10k loan paydown + $95k appreciation (6.3% local appreciation)).
- Marin County population projected at +9% by 2050 — modest demand growth; plan on rents tracking national, not racing it.
- By year 2, paydown + projected appreciation supports a ~$169k cash-out refi (75% LTV) — recoverable capital for the next deal without selling this one.
Negotiation context
- Only 9 days on market — expect competitive offers; lowballing is unlikely to land.
Questions for the listing agent
- What do current leases actually rent for vs. the listed asking? Can we see a recent rent roll and the last 12 months of T-12 income?
- Built in 1964 — when were the roof, HVAC, electrical panel, plumbing, and water heater last replaced?
- Is there a deadline driving the sale (1031 exchange, divorce, estate, relocation)? That informs how much negotiation room exists.
- Schools are A-rated — typically a magnet for longer-tenancy family renters. What's the average tenant stay here, and is there a school-zone premium baked into asking?
- What's the average days-on-market for RENTAL listings here right now (not sales)? A rising rental-DOM trend means longer vacancies and softer asking-rent achievability than the comps imply.
- What's the recent tenant-quality profile in this submarket — average credit score on applications, eviction rate, late-payment / NSF rate, and stable-employment percentage? A property-management company in the area should have these aggregated.
- How much new for-sale + rental construction is in the pipeline within 1–3 miles? Heavy new supply typically softens prices + rents 12–24 months out; constrained supply supports both.
Investment metrics
- 1% rule
- 0.62% ✗
- Cap rate
- 5.08%
- Cash-on-cash
- -4.32%
- DSCR
- 0.81
- GRM
- 13.5
CMA / ARV
- ARV (on-the-fly)
- $2,619,500
- Comps found
- 4
Show comp detail 4 sales within ~0.75 mi
| Address | Dist | Beds/Ba | Sqft | Sold | Price | $/sf | Match |
|---|---|---|---|---|---|---|---|
| 101 Round Hill Rd | 0.72mi | 3/1.5 | 1,640 (+2%) | 3mo | $1,499,000 | $914 | 59 |
| 2220 Vistazo St E | 0.36mi | 3/2.0 | 1,545 (-4%) | 23mo | $2,200,000 | $1,424 | 57 |
| 42 Peninsula Rd | 0.47mi | 3/2.0 | 1,740 (+8%) | 23mo | $3,612,000 | $2,076 | 46 |
| 311 San Rafael Ave | 0.73mi | 3/2.0 | 1,709 (+6%) | 21mo | $2,777,000 | $1,625 | 38 |
Match score weights: distance 35% · size 25% · config 20% · recency 20%. Top-matched comps best support the ARV.
Projected returns pro-forma
6.34% appreciation · 5.54% rent growth · sell at horizon
- IRR
- 13.5%
- Equity multiple
- 1.93×
- Total profit
- $390,610
- Equity at exit
- $975,206
- IRR
- 14.5%
- Equity multiple
- 4.02×
- Total profit
- $1,270,044
- Equity at exit
- $1,797,010
Cash invested: $420,000 (down + closing). Projections, not guarantees.
Landlord ↔ Tenant lean methodology
- Overall (STATE)
- 18 Strongly Tenant-Friendly
- State California
- 18 Strongly Tenant-Friendly · D+13
- County
- — inherits STATE
- City
- — inherits STATE
ZIP-level market 94920
- Home prices YoY
- 2.4%
- Rents YoY
- 5.5%
- Active inventory
- 79
- Price-to-rent
- 13.5×
Monthly cashflow live
- Estimated rent
- $9,271 medium interval (Pro) →
- Mortgage (P&I)
- −$7,866
- Tax from tax record
- −$345 /mo · $4,139/yr
- Insurance
- −$625
- HOA
- −$0
- Vacancy / Maint / Mgmt
- −$1,947
- Net cashflow
- $-1,512
Break-even live
Sensitivity live
| Price | -10% $-663 | -5% $-1,087 | +0% $-1,512 | +5% $-1,936 | +10% $-2,361 |
|---|---|---|---|---|---|
| Rent | -10% $-2,244 | -5% $-1,878 | +0% $-1,512 | +5% $-1,145 | +10% $-779 |
| Rate | -1.0pp $-756 | -0.5pp $-1,130 | base $-1,512 | +0.5pp $-1,900 | +1.0pp $-2,296 |
UW: 25.0% down · 7.5% · 30yr · 1.5% tax · 5.0% vac · 8.0% maint · 8.0% mgmt
Financing live
Cash to close
- Down payment
- $375,000
- Closing costs
- $45,000
- Reserves months
- —
- Total cash needed
- —
Loan-product check · same deal, 3 products live
Conventional
25% down · 7.5% · 30yr
- Down + closing
- —
- Monthly P&I
- —
- Monthly cashflow
- —
- DSCR
- —
- Eligible?
- —
Personal DTI + credit; lowest rate.
DSCR
20% down · 8.5% · 30yr
- Down + closing
- —
- Monthly P&I
- —
- Monthly cashflow
- —
- DSCR
- —
- Eligible?
- —
No personal income docs; deal must DSCR.
Hard money
10% down · 12.0% · 12mo
- Down + closing
- —
- Monthly P&I
- —
- Monthly cashflow
- —
- DSCR
- —
- Eligible?
- —
Short-term bridge; refi at stabilization.
Rent comps 4 comps
| Address | Beds | Baths | Sqft | Rent | $/sqft | DOM | Units | Dist |
|---|---|---|---|---|---|---|---|---|
| 21 Marinero Cir Belvedere Tiburon, CA | 2.0 | 1.5–2.0 | 1100 | $6,650 | $6.05 | 0d | 1 | 0.50mi |
| 31 Acacia Ave Belvedere Tiburon, CA | 3.0 | 2.5 | 1900 | $9,400 | $4.95 | 15d | 1 | 0.57mi |
| 172 Bella Vista Ave Unit C Belvedere Tiburon, CA | 2.0 | 2.0 | 1087 | $6,500 | $5.98 | 0d | 1 | 0.68mi |
| 218 San Rafael Ave Belvedere Tiburon, CA | 3.0 | 2.0 | 1943 | $20,000 | $10.29 | 0d | 1 | 0.78mi |
Listing history 1 events
-
2026-05-20$1,499,999 Active
ⓘ Source: listings_history table (triggers on properties + properties_extension) + one-shot
backfill from property_details.listing_events for pre-trigger history.
Tax reassessment forecast CA · Resets to sale price
- Current annual tax
- $4,139 · $345/mo
- Projected year-2 tax
- $11,400 · $950/mo
- Expected delta
- +$7,261/yr (+$605/mo · 175.4%)
ⓘ Screening estimate from a state-policy table — verify with the county assessor before closing.
Climate risk First Street
- Flood 1/10 Low FEMA zone X (unshaded) · 0% chance over 30 yrs
- Wildfire 1/10 Low
- Heat 3/10 Moderate 8 d/yr ≥79°F today · 18 d/yr by 30 yrs out
- Wind 1/10 Low
- Air quality 8/10 Severe 13 unhealthy d/yr today · 13 by 30 yrs out
Nearby sold comps map
Loading sold comps map…
Walkable amenities ~0.75 mi
Loading nearby amenities…
Taxation est. · year 1
- Rental income
- $111,258
- − Mortgage interest
- −$84,023
- − Property taxes
- −$4,139
- − Insurance
- −$7,500
- − Repairs & maintenance
- −$8,901
- − Management
- −$8,901
- − Depreciation
- −$43,636
- Taxable loss
- −$45,843
- Est. tax savings @ 24.0%
- +$11,002
- After-tax cash flow
- $-7,138/yr
For passive investors: Depreciation is non-cash, so a rental often shows a tax loss while cash-flowing — sheltering income. Rental losses are passive: they offset passive income freely, and up to $25,000/yr can offset ordinary (W-2) income if you actively participate and your MAGI is under $100k (phasing out to $0 by $150k); unused losses carry forward. On sale, claimed depreciation is recaptured at up to 25%, and gains may owe capital-gains tax (a 1031 exchange can defer both). Figures are a year-1 estimate at your 24.0% rate — not tax advice; consult a CPA.
Schools (NCES district)
- District
- Tamalpais Union High
- NCES district ID
- 0638790
- Math proficiency
- 62% ▲ 4.00%
- Reading proficiency
- 78% ▲ 6.00%
- Median HH income
- $106,037
- Composite
- 64.66/100
- National rank
- #527
- State rank
- #42 of 517 in CA
Livability — Tiburon
- Score
- 69/100
- State rank
- #247
- US rank
- #8251
Category grades
Schools grade is shown separately in the Schools card above.
Census & demographics
- Census place
- Tiburon, CA
- County
- Marin County · 243,328 people
- City population
- 12,609
- Metro
- San Francisco-Oakland-Berkeley, CA
- Population (ZIP)
- 12,609
- Household income
- $246,045
- Rent vs Own
- Severe rent burden
- 461.0
Population outlook (Marin County) Hauer SSP2
- Today (2025)
- 276,379 people
- By 2030
- 282,942 · +2.4%
- By 2040
- 292,937 · +6.0%
- By 2050
- 300,449 · +8.7%
- By 2075
- 316,946 · +14.7%
- By 2100
- 303,948 · +10.0%
Race, ethnicity, and origin ACS 2023
- Neighborhood character
- Predominantly White (81%)
- Race & ethnicity
- White 81% Asian 8% Two or more races 7% Hispanic / Latino 5%
- Hispanic origin (detail)
- Mexican 2%
- Common ancestry
- Italian 4% Slovak 4% Scotch-Irish 4%
- Foreign-born
- 22% · Canada, South Korea, China
- Languages at home
- 80% English-only · Other Indo-European 6% Spanish 3% Russian/Polish/Slavic 3%
Political lean MEDSL · Marin
- 2024 margin
- Solid D (+63.9) · D 80.6% · R 16.7% · Other 2.7%
- 2008→2024 swing
- +6.2pp toward D · 2008: 57.7pp · 2024: 63.9pp
- All cycles
- 2024: D+63.9 2020: D+66.5 2016: D+62.9 2012: D+50.5 2008: D+57.7
Not yet ingested
- Civics
- —
Market trends
- HPI YoY
- ▲ 6.34%
- Current HPI
- 265.9709
- Rent YoY
- ▲ 5.54%
- Metro
- San Francisco-Oakland-Berkeley, CA
- State GDP YoY
- ▲ 3.21%
- F500 in state
- 116
Industry mix (Fortune 500 HQ in CA)
| Industry | F500 HQs | Revenue |
|---|---|---|
| Technology | 27 | $1,492B |
|
||
| Financial Services | 3 | $174B |
|
||
| Retail | 3 | $44B |
|
||
| Insurance | 3 | $26B |
|
||
| Media / Entertainment | 2 | $115B |
|
||
| Pharmaceuticals / Biotech | 2 | $62B |
|
||
Price history
1 event — show timeline
- 2026-05-20 Listed $1,499,999 BAREIS
Property tax history
+2.5%/yrLatest (2025): $4,139 · +6.9% YoY. Source: county tax records.
Cash-flow waterfall
monthlySold comps — $/sqft
last 12 mo · ≤1 miLoading sold comps…