1128 3rd Ave · Huntington, WV
Flood risk 7/10 · Major
- FEMA flood zone
- X (shaded)
- Chance of flooding over 30 yrs
- 0.77%
- Est. flood insurance / yr
- $507 – $1,088
Fire risk 3/10 · Minor
- Est. fire insurance / yr
- $713 – $1,323
Heat risk 5/10 · Moderate
- Hot days now (above 103°F)
- 7 days/yr
- Hot days in 30 yrs
- 18 days/yr
Wind risk 2/10 · Minimal
- Chance of severe wind over 30 yrs
- 1.0%
Air-quality risk 1/10 · Minimal
- Unhealthy air days now
- 0 days/yr
- Unhealthy air days in 30 yrs
- 0 days/yr
Risk factors via First Street. Map © Google.
Why this score? — see what drove the C+ grade
The composite is a weighted blend of 9 inputs, each scored 0–100. Each bar is that input's sub-score; the figure is the points it added to the 100-point composite (weight × sub-score).
- Cash flow +22.9/30.0
- ARV discount +12.9/15.0
- DSCR +7.4/10.0
- 1% rule +6.0/10.0
- Schools +4.1/10.0
- Livability +4.0/5.0
- Rent growth +2.5/5.0
- Condition / age +2.2/5.0
- Appreciation +0.0/10.0
$148,400
🖨 Deal sheet 📄 Offer letter ✓ Due diligence
Listing remarks MLS
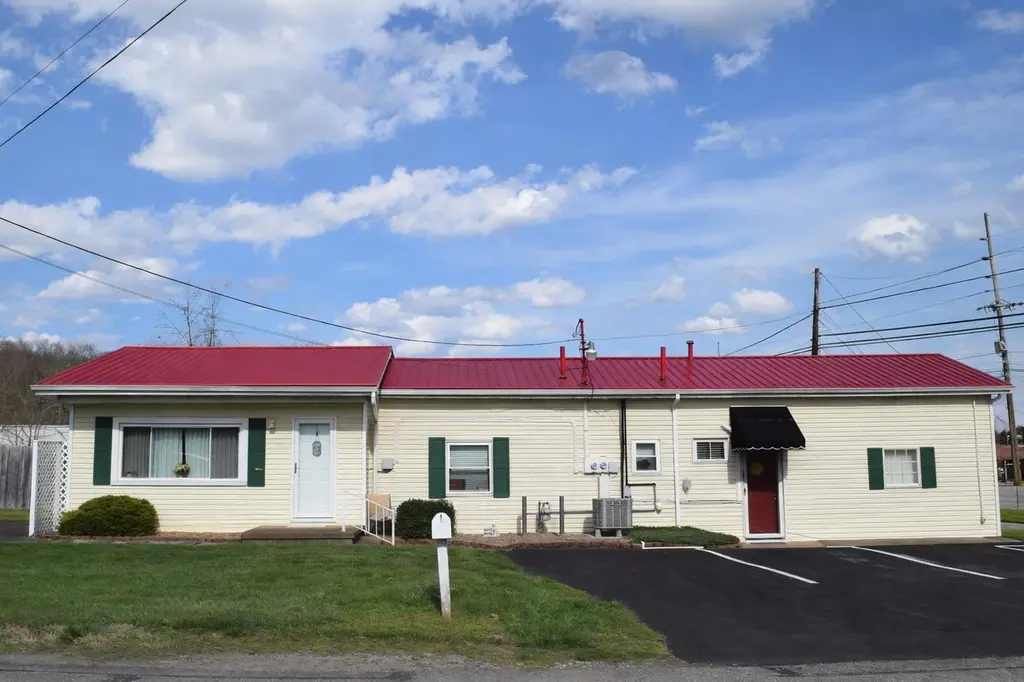
Located on a corner lot, this unique property offers options for a 2-3 bedroom single family home, or a business with a 2 bedroom home or rental. Currently set up as an office plus a 2 Bedroom rental, the office/"Bonus Room" could function as a large primary suite with ensuite 1/2 bath and room for seating for a private living room. The kitchen features solid oak cabinets. With a spacious living room, 2 bedrooms and full bath, this property has a lot of options to consider.
Key facts
- Solid oak cabinets
- Ensuite 1/2 bath
- Large primary suite
Tags
Neighborhood map
What this means for you Summary
Snapshot
- This is a 2-bed/1.5-bath single-family listed at $148k. Condition is rated fair.
Deal economics
- At list price, monthly cash flow is $195 ($2k/yr) — positive.
- The deal already cash-flows at list — no discount required.
- Meets the 1% rule at list price ($2k rent vs $148k).
- Recommended offer: $139k (6.0% below list) — sets the bar for market timing.
- Cap rate 8.4% vs local median 6.5% in Huntington — meaningfully above typical; check what's discounted (condition, days-on-market, listing class) to confirm the premium yield is real.
Location & tenants
- Location reads 79/100 on livability (#16 in WV, #2,045 nationally) — a middle-class / working-renter tenant base. Strengths: amenities A+, commute A+, cost of living A+; Watch: schools C-, crime F, employment F.
- Chesapeake Union Exempted Village (suburban): math 40% / reading 57% proficiency, ranked #461 of 656 in OH (top 70%) — families likely to look elsewhere, expect single-tenant / working-renter base with shorter leases.
- Market conditions: 18 units permitted in Lawrence County in 2024 (0 in 5+ unit buildings).
- This rent runs 34% of the median local income ($58k/yr) — at the standard rent-burdened threshold; future hikes will face affordability resistance.
Forward outlook
- Local home prices are declining (-3.0%/yr); year-one equity from $1k of loan paydown is wiped out by about $4k of value loss. Plan a longer hold.
- Lawrence County population projected at -22% by 2050 — secular population decline; favor cash flow + early exit over multi-decade hold.
Negotiation context
- It's been on market 79 days — a 6% lower offer ($139k) is reasonable based on typical stale-listing flexibility.
Risks & watch-outs
- Watch-outs: flood insurance adds $66/mo; built in 1945 — expect roof / HVAC / electrical / plumbing capex.
- Climate carrying-cost: major flood risk; extreme-heat days projected 7→18/yr by 2055 (HVAC capex compounding) — expect insurance premiums to compound above CPI over the hold.
Questions for the listing agent
- It's been on market 79 days. Have you received any prior offers? Is the seller open to a 6% concession, seller financing, or rate buy-down credit?
- Have any recent inspections been done? Can we get a copy of the seller's disclosures and any deferred-maintenance estimates?
- Built in 1945 — when were the roof, HVAC, electrical panel, plumbing, and water heater last replaced?
- What's the actual annual flood-insurance premium (NFIP or private), and is the property in a SFHA with mandatory coverage?
- Why hasn't it sold? Are there any deal-killer items the seller is aware of (foundation, flood, title, zoning, code violations)?
- Is there a deadline driving the sale (1031 exchange, divorce, estate, relocation)? That informs how much negotiation room exists.
- Crime grade is F in this area — have there been break-ins, vandalism, or insurance claims at this property in the last 3 years? What carrier currently insures it and at what premium?
- What's the average days-on-market for RENTAL listings here right now (not sales)? A rising rental-DOM trend means longer vacancies and softer asking-rent achievability than the comps imply.
- What's the recent tenant-quality profile in this submarket — average credit score on applications, eviction rate, late-payment / NSF rate, and stable-employment percentage? A property-management company in the area should have these aggregated.
- How much new for-sale + rental construction is in the pipeline within 1–3 miles? Heavy new supply typically softens prices + rents 12–24 months out; constrained supply supports both.
Investment metrics
- 1% rule
- 1.10% ✓
- Cap rate
- 8.41%
- Cash-on-cash
- 7.56%
- DSCR
- 1.34
- GRM
- 7.6
CMA / ARV
- ARV (median comp)
- $168,627
- List price
- $148,400
- Delta
- -12.00%
- Verdict
- UNDERPRICED
- Comps
- 20 within 1.0 mi
Show comp detail 5 sales within ~0.75 mi
| Address | Dist | Beds/Ba | Sqft | Sold | Price | $/sf | Match |
|---|---|---|---|---|---|---|---|
| 15 Township Road 1213 | 0.60mi | 3/1.0 (+1) | 1,464 (+1%) | 17mo | $132,000 | $90 | 49 |
| 63 Township Road 1197 | 0.59mi | 3/1.5 (+1) | 1,314 (-9%) | 6mo | $125,840 | $96 | 47 |
| 11 Platinum Dr | 0.62mi | 3/2.0 (+1) | 1,554 (+7%) | 6mo | $193,500 | $125 | 47 |
| 181 Township Road 1043 | 0.25mi | 3/2.0 (+1) | 1,304 (-10%) | 22mo | $85,000 | $65 | 46 |
| 39 Township Road 1197 | 0.62mi | 3/1.5 (+1) | 1,298 (-10%) | 18mo | $162,655 | $125 | 34 |
Match score weights: distance 35% · size 25% · config 20% · recency 20%. Top-matched comps best support the ARV.
Projected returns pro-forma
-3.0% appreciation · 3.0% rent growth · sell at horizon
- IRR
- -7.5%
- Equity multiple
- 0.72×
- Total profit
- $-11,545
- Equity at exit
- $22,127
- IRR
- 2.1%
- Equity multiple
- 1.15×
- Total profit
- $6,226
- Equity at exit
- $12,831
Cash invested: $41,552 (down + closing). Projections, not guarantees.
Landlord ↔ Tenant lean methodology
- Overall (STATE)
- 83 Strongly Landlord-Friendly
- State West Virginia
- 83 Strongly Landlord-Friendly · R+22
- County
- — inherits STATE
- City
- — inherits STATE
ZIP-level market 45619
- Home prices YoY
- -10.6%
- Price-to-rent
- 7.6×
Monthly cashflow live
- Estimated rent
- $1,629 medium interval (Pro) →
- Mortgage (P&I)
- −$778
- Tax est. 1.5%
- −$186 /mo · $2,226/yr
- Insurance
- −$62
- Flood insurance flood zone
- −$66 /mo · $798/yr
- HOA
- −$0
- Vacancy / Maint / Mgmt
- −$342
- Net cashflow
- $195
Break-even live
UW: 25.0% down · 7.5% · 30yr · 1.5% tax · 5.0% vac · 8.0% maint · 8.0% mgmt
Financing live
Cash to close
- Down payment
- $37,100
- Closing costs
- $4,452
- Reserves months
- —
- Total cash needed
- —
Loan-product check · same deal, 3 products live
Conventional
25% down · 7.5% · 30yr
- Down + closing
- —
- Monthly P&I
- —
- Monthly cashflow
- —
- DSCR
- —
- Eligible?
- —
Personal DTI + credit; lowest rate.
DSCR
20% down · 8.5% · 30yr
- Down + closing
- —
- Monthly P&I
- —
- Monthly cashflow
- —
- DSCR
- —
- Eligible?
- —
No personal income docs; deal must DSCR.
Hard money
10% down · 12.0% · 12mo
- Down + closing
- —
- Monthly P&I
- —
- Monthly cashflow
- —
- DSCR
- —
- Eligible?
- —
Short-term bridge; refi at stabilization.
Listing history 16 events
-
2026-06-19days on market $148,400 Active 79 DOM
-
2026-06-18days on market $148,400 Active 78 DOM
-
2026-06-17days on market $148,400 Active 77 DOM
-
2026-06-16days on market $148,400 Active 76 DOM
-
2026-06-15days on market $148,400 Active 75 DOM
-
2026-06-14days on market $148,400 Active 73 DOM
-
2026-06-12days on market $148,400 Active 72 DOM
-
2026-06-09days on market $148,400 Active 69 DOM
-
2026-06-08days on market $148,400 Active 68 DOM
-
2026-06-07pricedays on market $148,400 Active 67 DOM
-
2026-06-05days on market $149,900 Active 64 DOM
-
2026-06-02days on market $149,900 Active 62 DOM
-
2026-06-01days on market $149,900 Active 61 DOM
-
2026-05-31days on market $149,900 Active 60 DOM
-
2026-05-30days on market $149,900 Active 59 DOM
-
2026-03-31$149,900 Active 488-char remark
Show marketing remark (488 chars)
Located on a corner lot, this unique property offers options for a 2-3 bedroom single family home, or a business with a 2 bedroom home or rental. Currently set up as an office plus a 2 Bedroom rental, the office/"Bonus Room" could function as a large primary suite with ensuite 1/2 bath and room for seating for a private living room. The kitchen features solid oak cabinets. With a spacious living room, 2 bedrooms and full bath, this property has a lot of options to consider.
ⓘ Source: listings_history table (triggers on properties + properties_extension) + one-shot
backfill from property_details.listing_events for pre-trigger history.
Climate risk First Street
- Flood 7/10 Severe FEMA zone X (shaded) · 77% chance over 30 yrs
- Wildfire 3/10 Moderate
- Heat 5/10 Major 7 d/yr ≥103°F today · 18 d/yr by 30 yrs out
- Wind 2/10 Low 100% chance of damaging wind over 30 yrs
- Air quality 1/10 Low 0 unhealthy d/yr today · 0 by 30 yrs out
Nearby sold comps map
Loading sold comps map…
Walkable amenities ~0.75 mi
Loading nearby amenities…
Taxation est. · year 1
- Rental income
- $19,554
- − Mortgage interest
- −$8,313
- − Property taxes
- −$2,226
- − Insurance
- −$1,540
- − Repairs & maintenance
- −$1,564
- − Management
- −$1,564
- − Depreciation
- −$4,317
- Taxable income
- $30
- Est. tax owed @ 24.0%
- −$7
- After-tax cash flow
- $2,336/yr
For passive investors: Depreciation is non-cash, so a rental often shows a tax loss while cash-flowing — sheltering income. Rental losses are passive: they offset passive income freely, and up to $25,000/yr can offset ordinary (W-2) income if you actively participate and your MAGI is under $100k (phasing out to $0 by $150k); unused losses carry forward. On sale, claimed depreciation is recaptured at up to 25%, and gains may owe capital-gains tax (a 1031 exchange can defer both). Figures are a year-1 estimate at your 24.0% rate — not tax advice; consult a CPA.
Condition & rehab AI · 1 photo
The property requires significant exterior repairs and maintenance to improve its curb appeal and overall condition, with a moderate level of renovation needed.
Repairs flagged
- Major Driveway — Significant cracking and unevenness
- Major Fencing — Old and weathered
- Major Landscaping — Sparse and unkempt
- Major Siding — Aged and may need repainting
Value-add opportunities
- Both Driveway repair — Improves curb appeal and functionality
- Both Fencing replacement — Enhances property value and security
- Both Landscaping maintenance — Boosts curb appeal and property value
- Both Siding repainting — Enhances curb appeal and property value
Renovation cost estimate screening
| Repair item | Severity | Est. cost |
|---|---|---|
| Driveway · Significant cracking and unevenness | Major | $15,000–50,000 |
| Fencing · Old and weathered | Major | $15,000–50,000 |
| Landscaping · Sparse and unkempt | Major | $15,000–50,000 |
| Siding · Aged and may need repainting | Major | $15,000–50,000 |
| Total estimated repair cost · 4 items | $60,000–200,000 |
Value-add ROI direction
- Both Driveway repair — Improves curb appeal and functionality ↑
- Both Fencing replacement — Enhances property value and security ↑
- Both Landscaping maintenance — Boosts curb appeal and property value ↑
- Both Siding repainting — Enhances curb appeal and property value ↑
ⓘ Cost ranges are severity-bucket heuristics (US national rule-of-thumb). Get contractor quotes + a written scope before underwriting a rehab budget.
Schools (NCES district)
- District
- Chesapeake Union Exempted Village
- NCES district ID
- 3904529
- Math proficiency
- 40% ▼ -22.00%
- Reading proficiency
- 57% ▼ -12.00%
- Median HH income
- $46,731
- Composite
- 41.16/100
- National rank
- #3553
- State rank
- #461 of 656 in OH
Livability — Huntington
- Score
- 79/100
- State rank
- #16
- US rank
- #2045
Category grades
Schools grade is shown separately in the Schools card above.
Census & demographics
- County
- Lawrence
- City population
- 25,795
- Metro
- Huntington-Ashland, WV-KY-OH
- Population (ZIP)
- 7,273
- Household income
- $57,525
- Rent vs Own
- Severe rent burden
- 17.4
Population outlook (Lawrence County) Hauer SSP2
- Today (2025)
- 57,915 people
- By 2030
- 55,650 · -3.9%
- By 2040
- 50,523 · -12.8%
- By 2050
- 45,103 · -22.1%
- By 2075
- 32,441 · -44.0%
- By 2100
- 21,754 · -62.4%
Race, ethnicity, and origin ACS 2023
- Neighborhood character
- Predominantly White (95%)
- Race & ethnicity
- White 95% Two or more races 3% Black 2%
- Common ancestry
- Slovak 3% Serbian 2% Italian 2%
- Foreign-born
- 1%
- Languages at home
- 98% English-only · French/Haitian/Cajun 1%
Political lean MEDSL · Lawrence
- 2024 margin
- Solid R (+50.5) · D 24.4% · R 74.9%
- 2008→2024 swing
- -35.2pp toward R · 2008: -15.3pp · 2024: -50.5pp
- All cycles
- 2024: R+50.5 2020: R+45.6 2016: R+43.9 2012: R+15.5 2008: R+15.3
Not yet ingested
- Civics
- —
Market trends
- HPI YoY
- ▼ -20.15%
- Current HPI
- 170.5086
- Rent YoY
- —
- Metro
- —
- State GDP YoY
- —
- F500 in state
- 0
Price history
1 event — show timeline
- 2026-03-31 Listed $149,900 HBRMLS
Cash-flow waterfall
monthlySold comps — $/sqft
last 12 mo · ≤1 miLoading sold comps…