 Triplex
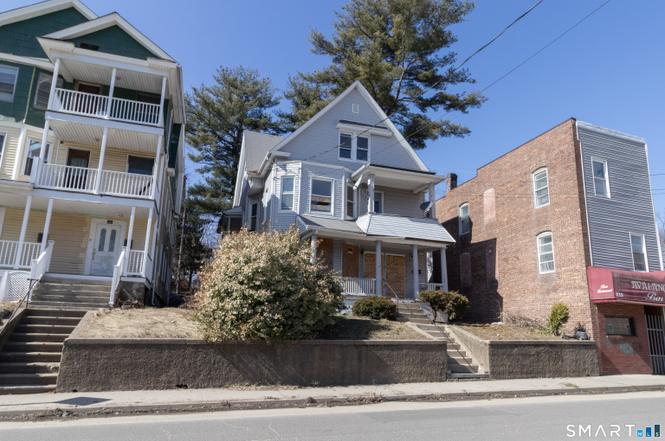
None · Waterbury, CT
Flood risk 1/10 · Minimal
- FEMA flood zone
- X (unshaded)
- Chance of flooding over 30 yrs
- 0.0%
- Est. flood insurance / yr
- $473 – $860
Fire risk 1/10 · Minimal
- Est. fire insurance / yr
- $829 – $1,539
Heat risk 5/10 · Moderate
- Hot days now (above 96°F)
- 7 days/yr
- Hot days in 30 yrs
- 15 days/yr
Wind risk 6/10 · Moderate
- Chance of severe wind over 30 yrs
- 27.0%
Air-quality risk 3/10 · Minor
- Unhealthy air days now
- 2 days/yr
- Unhealthy air days in 30 yrs
- 3 days/yr
Risk factors via First Street. Map © Google.
Why this score? — see what drove the B+ grade
The composite is a weighted blend of 9 inputs, each scored 0–100. Each bar is that input's sub-score; the figure is the points it added to the 100-point composite (weight × sub-score).
- Cash flow +30.0/30.0
- ARV discount +15.0/15.0
- 1% rule +10.0/10.0
- DSCR +10.0/10.0
- Rent growth +4.5/5.0
- Livability +4.0/5.0
- Condition / age +2.5/5.0
- Appreciation +1.5/10.0
- Schools +1.5/10.0
$275,000
🖨 Deal sheet (PDF) 📄 Offer letter ✓ Due diligence
Multi-family units
County records classify this as Multi-Family (2-4 Unit). Listing-text estimate: 3 units. confirmed
Listing remarks MLS
Spacious 3 Family Home. 1st and 2nd Floors Offer 3 Bedrooms, 1 Full Bath and Washer Hookups. 3rd Floor is a 2 Bedroom, One Bath. All units a have Separate Gas Furnaces, Electrical Panels. 1st and 3rd Floor have Gas Hot Water Heaters. 2nd Floor has an Electric Hot Water Heater. 1st Floor Furnace is A Year Old! Great Opportunity For Owner Occupant Or Investor!
Key facts
- 5,662 sq ft lot
- Built 1896
- Listed 47 days
Neighborhood map
What this means for you Summary
Snapshot
- This is a 3 × 2-bed/1.0-bath units multifamily listed at $275k.
Deal economics
- At list price, monthly cash flow is $2k ($19k/yr) — positive. Per door: $530/mo.
- The deal already cash-flows at list — no discount required.
- Meets the 1% rule at list price ($5k rent vs $275k).
- Recommended offer: $267k (3.0% below list) — sets the bar for market timing.
- Cap rate 13.2% vs local median 3.5% in Waterbury — top-decile yield for the area; either an underpriced asset or a hidden risk that comps aren't pricing in. Stress-test before assuming the spread holds.
Location & tenants
- Location reads 79/100 on livability (#32 in CT, #2,205 nationally) — a middle-class / working-renter tenant base. Strengths: commute A+, cost of living A+, housing A+; Watch: crime D, employment D.
- Waterbury School District (suburban): math 12% / reading 23% proficiency, ranked #148 of 153 in CT (top 97%) — low school quality limits family demand, transient renter base, plan for 1-2y turnover; 73% free/reduced lunch — lower-income household profile, screen leases tightly.
- Zoned schools: Walsh School (math 8% / reading 12%, grade F, #512 of 553 statewide, top 94%, 360 students, 83% FRL); Michael F. Wallace Middle School (math 13% / reading 28%, grade F, #160 of 175 statewide, top 91%, 1,062 students, 86% FRL); Crosby High School (math 2% / reading 17%, grade F, #187 of 194 statewide, top 96%, 1,400 students, 84% FRL).
- Market conditions: Rents rising fast (+8.0%/yr); 102 active listings in the ZIP; 2 comparable units currently listed for rent nearby; 502 units permitted in Naugatuck Valley Planning Region in 2024 (171 in 5+ unit buildings).
- At $4,600/mo this rent would consume 113% of the median local household income ($49k/yr) (locally 1981% of renters already pay >50% of income on rent) — very limited rent-growth headroom before tenants either downsize or default.
Forward outlook
- Local home prices are declining (-3.0%/yr); year-one equity from $2k of loan paydown is wiped out by about $8k of value loss. Plan a longer hold.
- At projected returns (-3.0% appreciation + 8.0% rent growth), your $77k cash investment doubles in ~5 years — after that, you're playing with house money.
Negotiation context
- It's been on market 47 days — a 3% lower offer ($267k) is reasonable based on typical stale-listing flexibility.
- 6 sale attempts since 14y ago with the ask held roughly flat each time — persistent listings suggest the price (not the market) is what's stuck; bring a comps-based counter.
- Current owner paid $120k; list at $275k implies a 129% gain — meaningful room to come down on a strong offer.
Risks & watch-outs
- Watch-outs: built in 1896 — expect roof / HVAC / electrical / plumbing capex.
- Climate carrying-cost: major wind risk, 27% chance of damaging wind over 30y; extreme-heat days projected 7→15/yr by 2055 (HVAC capex compounding) — expect insurance premiums to compound above CPI over the hold.
Questions for the listing agent
- It's been on market 47 days. Have you received any prior offers? Is the seller open to a 3% concession, seller financing, or rate buy-down credit?
- Can we see the unit-by-unit rent roll, current vacancy, and any below-market leases? What's the average tenancy length?
- What capital expenditures (roof, boiler, parking lot, exteriors) have been made in the last 5 years, and what's planned in the next 2?
- Built in 1896 — when were the roof, HVAC, electrical panel, plumbing, and water heater last replaced?
- Is there a deadline driving the sale (1031 exchange, divorce, estate, relocation)? That informs how much negotiation room exists.
- Schools are D-rated, which usually means shorter tenancies and higher turnover. Who's the typical renter profile here, and what's been the actual vacancy rate?
- Crime grade is D in this area — have there been break-ins, vandalism, or insurance claims at this property in the last 3 years? What carrier currently insures it and at what premium?
- What's the average days-on-market for RENTAL listings here right now (not sales)? A rising rental-DOM trend means longer vacancies and softer asking-rent achievability than the comps imply.
- What's the recent tenant-quality profile in this submarket — average credit score on applications, eviction rate, late-payment / NSF rate, and stable-employment percentage? A property-management company in the area should have these aggregated.
- How much new apartment / multifamily construction is in the pipeline within 1–3 miles? Heavy new supply (>2% of stock underway) typically softens rents 12–24 months out; light construction supports rent growth.
Investment metrics
- 1% rule
- 1.67% ✓
- Cap rate
- 13.23%
- Cash-on-cash
- 24.79%
- DSCR
- 2.10
- GRM
- 5.0
CMA / ARV
- ARV (on-the-fly)
- $359,370
- Comps found
- 10
Show comp detail 10 sales within ~0.75 mi
| Address | Dist | Beds/Ba | Sqft | Sold | Price | $/sf | Match |
|---|---|---|---|---|---|---|---|
| 245 Walnut St | 0.00mi | 7/3.0 (+1) | 2,970 (0%) | 0mo | $210,000 | $71 | 95 |
| 21 Violet St | 0.23mi | 6/3.0 | 2,941 (-1%) | 4mo | $270,000 | $92 | 84 |
| 290 Orange St | 0.20mi | 7/3.0 (+1) | 3,050 (+3%) | 7mo | $435,000 | $143 | 75 |
| 11 Putnam St | 0.10mi | 6/3.0 | 3,188 (+7%) | 11mo | $387,000 | $121 | 74 |
| 32 Young St | 0.16mi | 6/3.0 | 3,024 (+2%) | 21mo | $330,000 | $109 | 72 |
| 64 Wood St | 0.12mi | 7/3.0 (+1) | 3,393 (+14%) | 1mo | $495,000 | $146 | 65 |
| 65 Brewster St | 0.52mi | 6/3.0 | 3,024 (+2%) | 18mo | $325,000 | $107 | 58 |
| 28 Wall St | 0.34mi | 6/3.0 | 3,280 (+10%) | 16mo | $292,500 | $89 | 54 |
| 42 Platt St | 0.51mi | 6/2.0 | 2,798 (-6%) | 23mo | $340,000 | $122 | 44 |
| 51 River St | 0.73mi | 6/3.0 | 2,669 (-10%) | 14mo | $457,500 | $171 | 37 |
Match score weights: distance 35% · size 25% · config 20% · recency 20%. Top-matched comps best support the ARV.
Projected returns pro-forma
-3.0% appreciation · 8.0% rent growth · sell at horizon
- IRR
- 24.0%
- Equity multiple
- 2.05×
- Total profit
- $81,223
- Equity at exit
- $41,003
- IRR
- 35.0%
- Equity multiple
- 5.06×
- Total profit
- $312,474
- Equity at exit
- $23,777
Cash invested: $77,000 (down + closing). Projections, not guarantees.
Landlord ↔ Tenant lean methodology
- Overall (STATE)
- 27 Tenant-Leaning
- State Connecticut
- 27 Tenant-Leaning · D+7
- County
- — inherits STATE
- City
- — inherits STATE
ZIP-level market 06704
- Home prices YoY
- -2.0%
- Rents YoY
- 8.0%
- Active inventory
- 102
- Price-to-rent
- 14.9×
Monthly cashflow live
- Estimated rent
- $4,600 high interval (Pro) →
- Mortgage (P&I)
- −$1,442
- Tax from tax record
- −$486 /mo · $5,838/yr
- Insurance
- −$115
- HOA
- −$0
- Vacancy / Maint / Mgmt
- −$966
- Net cashflow
- $1,591
Break-even live
Sensitivity live
| Price | -10% $1,746 | -5% $1,669 | +0% $1,591 | +5% $1,513 | +10% $1,435 |
|---|---|---|---|---|---|
| Rent | -10% $1,227 | -5% $1,409 | +0% $1,591 | +5% $1,772 | +10% $1,954 |
| Rate | -1.0pp $1,729 | -0.5pp $1,661 | base $1,591 | +0.5pp $1,520 | +1.0pp $1,447 |
3-unit breakdown (identical units grouped — click to expand)
| Units | Beds | Baths | Est. rent |
|---|---|---|---|
| 3× units | 2 | 1 | $4,599 |
| #1 | 2 | 1 | $1,533 |
| #2 | 2 | 1 | $1,533 |
| #3 | 2 | 1 | $1,533 |
| Total (3 units) | $4,600 | ||
UW: 25.0% down · 7.5% · 30yr · 1.5% tax · 5.0% vac · 8.0% maint · 8.0% mgmt
Financing live
Cash to close
- Down payment
- $68,750
- Closing costs
- $8,250
- Reserves months
- —
- Total cash needed
- —
Loan-product check · same deal, 3 products live
Conventional
25% down · 7.5% · 30yr
- Down + closing
- —
- Monthly P&I
- —
- Monthly cashflow
- —
- DSCR
- —
- Eligible?
- —
Personal DTI + credit; lowest rate.
DSCR
20% down · 8.5% · 30yr
- Down + closing
- —
- Monthly P&I
- —
- Monthly cashflow
- —
- DSCR
- —
- Eligible?
- —
No personal income docs; deal must DSCR.
Hard money
10% down · 12.0% · 12mo
- Down + closing
- —
- Monthly P&I
- —
- Monthly cashflow
- —
- DSCR
- —
- Eligible?
- —
Short-term bridge; refi at stabilization.
Rent comps 2 comps
| Address | Beds | Baths | Sqft | Rent | $/sqft | DOM | Units | Dist |
|---|---|---|---|---|---|---|---|---|
| 14 Niagara St Waterbury, CT | 6.0 | 3.0 | 3156 | $1,700 | $0.54 | 5d | 1 | 0.83mi |
| 37 Johnson St Waterbury, CT | 6.0 | 1.5 | 2002 | $3,200 | $1.60 | 5d | 1 | 1.05mi |
Listing history 22 events
-
2026-04-29status Under Contract
-
2026-03-13$275,000 Active
-
2020-08-21soldstatus $120,000
-
2020-08-20soldstatus $120,000 Closed 360-char remark
Show marketing remark (360 chars)
Spacious 3 Family Home. 1st and 2nd Floors Offer 3 Bedrooms, 1 Full Bath and Washer Hookups. 3rd Floor is a 2 Bedroom, One Bath. All units a have Separate Gas Furnaces, Electrical Panels. 1st and 3rd Floor have Gas Hot Water Heaters. 2nd Floor has an Electric Hot Water Heater. 1st Floor Furnace is A Year Old! Great Opportunity For Owner Occupant Or Investor!
-
2020-07-02historical Under Contract - Continue to Show 360-char remark
Show marketing remark (360 chars)
Spacious 3 Family Home. 1st and 2nd Floors Offer 3 Bedrooms, 1 Full Bath and Washer Hookups. 3rd Floor is a 2 Bedroom, One Bath. All units a have Separate Gas Furnaces, Electrical Panels. 1st and 3rd Floor have Gas Hot Water Heaters. 2nd Floor has an Electric Hot Water Heater. 1st Floor Furnace is A Year Old! Great Opportunity For Owner Occupant Or Investor!
-
2020-03-15$149,900 Active 360-char remark
Show marketing remark (360 chars)
Spacious 3 Family Home. 1st and 2nd Floors Offer 3 Bedrooms, 1 Full Bath and Washer Hookups. 3rd Floor is a 2 Bedroom, One Bath. All units a have Separate Gas Furnaces, Electrical Panels. 1st and 3rd Floor have Gas Hot Water Heaters. 2nd Floor has an Electric Hot Water Heater. 1st Floor Furnace is A Year Old! Great Opportunity For Owner Occupant Or Investor!
-
2018-02-15soldstatus $70,000
-
2018-02-13status Under Contract 186-char remark
Show marketing remark (186 chars)
All 3 floors are rented month to month. New hot water heater on first floor. New flooring on second floor. new wiring knob and tube was removed. new venting system on second floor boiler
-
2018-02-13historical Under Contract - Continue to Show 186-char remark
Show marketing remark (186 chars)
All 3 floors are rented month to month. New hot water heater on first floor. New flooring on second floor. new wiring knob and tube was removed. new venting system on second floor boiler
-
2018-02-13soldstatus $70,000 Closed 186-char remark
Show marketing remark (186 chars)
All 3 floors are rented month to month. New hot water heater on first floor. New flooring on second floor. new wiring knob and tube was removed. new venting system on second floor boiler
-
2018-01-31status Under Contract 186-char remark
Show marketing remark (186 chars)
All 3 floors are rented month to month. New hot water heater on first floor. New flooring on second floor. new wiring knob and tube was removed. new venting system on second floor boiler
-
2017-12-22historical Under Contract - Continue to Show 186-char remark
Show marketing remark (186 chars)
All 3 floors are rented month to month. New hot water heater on first floor. New flooring on second floor. new wiring knob and tube was removed. new venting system on second floor boiler
-
2017-12-08$74,900 Active 186-char remark
Show marketing remark (186 chars)
All 3 floors are rented month to month. New hot water heater on first floor. New flooring on second floor. new wiring knob and tube was removed. new venting system on second floor boiler
-
2016-05-20soldstatus $66,000
-
2016-05-17soldstatus $66,000
-
2016-02-24historical
-
2016-01-08$69,900
-
2014-09-11historical
-
2014-05-06$79,900
-
2012-12-10soldstatus $40,000
-
2012-12-07soldstatus $40,000
-
2012-09-07$50,000
ⓘ Source: listings_history table (triggers on properties + properties_extension) + one-shot
backfill from property_details.listing_events for pre-trigger history.
Tax reassessment forecast CT · Partial reset (capped growth)
- Current annual tax
- $5,838 · $486/mo
- Projected year-2 tax
- $5,862 · $488/mo
- Expected delta
- +$24/yr (+$2/mo · 0.4%)
ⓘ Screening estimate from a state-policy table — verify with the county assessor before closing.
Climate risk First Street
- Flood 1/10 Low FEMA zone X (unshaded) · 0% chance over 30 yrs
- Wildfire 1/10 Low
- Heat 5/10 Major 7 d/yr ≥96°F today · 15 d/yr by 30 yrs out
- Wind 6/10 Major 27% chance of damaging wind over 30 yrs
- Air quality 3/10 Moderate 2 unhealthy d/yr today · 3 by 30 yrs out
Nearby sold comps map
Loading sold comps map…
Walkable amenities ~0.75 mi
Loading nearby amenities…
Taxation est. · year 1
- Rental income
- $55,200
- − Mortgage interest
- −$15,404
- − Property taxes
- −$5,838
- − Insurance
- −$1,375
- − Repairs & maintenance
- −$4,416
- − Management
- −$4,416
- − Depreciation
- −$8,000
- Taxable income
- $15,751
- Est. tax owed @ 24.0%
- −$3,780
- After-tax cash flow
- $15,309/yr
For passive investors: Depreciation is non-cash, so a rental often shows a tax loss while cash-flowing — sheltering income. Rental losses are passive: they offset passive income freely, and up to $25,000/yr can offset ordinary (W-2) income if you actively participate and your MAGI is under $100k (phasing out to $0 by $150k); unused losses carry forward. On sale, claimed depreciation is recaptured at up to 25%, and gains may owe capital-gains tax (a 1031 exchange can defer both). Figures are a year-1 estimate at your 24.0% rate — not tax advice; consult a CPA.
Schools (NCES district)
- District
- Waterbury School District
- NCES district ID
- 0904830
- Math proficiency
- 12% ▼ -7.00%
- Reading proficiency
- 23% ▼ -8.00%
- Median HH income
- $40,040
- Composite
- 14.85/100
- National rank
- #9380
- State rank
- #148 of 153 in CT
Livability — Waterbury
- Score
- 79/100
- State rank
- #32
- US rank
- #2205
Category grades
Schools grade is shown separately in the Schools card above.
Census & demographics
- Census place
- Waterbury, CT
- County
- New Haven County · 688,236 people
- City population
- 115,012
- Metro
- New Haven-Milford, CT
- Population (ZIP)
- 31,713
- Household income
- $48,718
- Rent vs Own
- Severe rent burden
- 1981.0
Population outlook (Naugatuck Valley County) Hauer SSP2
- By 2040
- 496,846
Race, ethnicity, and origin ACS 2023
- Neighborhood character
- Diverse neighborhood (Simpson 0.66)
- Race & ethnicity
- Hispanic / Latino 48% Black 28% Two or more races 20% White 18% Asian 2%
- Hispanic origin (detail)
- Mexican 2% Puerto Rican 30% Dominican 8%
- Common ancestry
- Romanian 2% Lithuanian 1% Russian 1%
- Foreign-born
- 16% · Canada, South Korea
- Languages at home
- 56% English-only · Spanish 38% Other Indo-European 3% French/Haitian/Cajun 1%
Political lean MEDSL · Naugatuck Valley
- 2024 margin
- Lean R (+7.4) · D 45.6% · R 53.0% · Other 1.4%
- All cycles
- 2024: R+7.4
Not yet ingested
- Civics
- —
Market trends
- HPI YoY
- ▼ -7.05%
- Current HPI
- 340.0917
- Rent YoY
- ▲ 8.02%
- Metro
- New Haven-Milford, CT
- State GDP YoY
- ▲ 1.06%
- F500 in state
- 38
Industry mix (Fortune 500 HQ in CT)
| Industry | F500 HQs | Revenue |
|---|---|---|
| Industrial Machinery | 4 | $38B |
|
||
| Insurance | 3 | $71B |
|
||
| Financial Services | 2 | $25B |
|
||
| Transportation / Logistics | 2 | $18B |
|
||
| Healthcare | 1 | $247B |
|
||
| Telecommunications | 1 | $55B |
|
||
Price history
+450.0% since first listed22 events — show timeline
- 2026-04-29 Pending — Smart MLS
- 2026-03-13 Listed $275,000 Smart MLS
- 2020-08-21 Sold (Public Records) $120,000 Public Records
- 2020-08-20 Sold (MLS) $120,000 Smart MLS
- 2020-07-02 Contingent — Smart MLS
- 2020-03-15 Listed $149,900 Smart MLS
- 2018-02-15 Sold (Public Records) $70,000 Public Records
- 2018-02-13 Pending — Smart MLS
- 2018-02-13 Contingent — Smart MLS
- 2018-02-13 Sold (MLS) $70,000 Smart MLS
- 2018-01-31 Pending — Smart MLS
- 2017-12-22 Contingent — Smart MLS
- 2017-12-08 Listed $74,900 Smart MLS
- 2016-05-20 Sold (Public Records) $66,000 Public Records
- 2016-05-17 Sold (MLS) $66,000 Smart MLS
- 2016-02-24 Listing Removed — Smart MLS
- 2016-01-08 Listed $69,900 Smart MLS
- 2014-09-11 Listing Removed — Smart MLS
- 2014-05-06 Listed $79,900 Smart MLS
- 2012-12-10 Sold (Public Records) $40,000 Public Records
- 2012-12-07 Sold (MLS) $40,000 Smart MLS
- 2012-09-07 Listed $50,000 Smart MLS
Property tax history
+8.5%/yrLatest (2023): $5,838 · +75.9% YoY. Source: county tax records.
Cash-flow waterfall
monthlySold comps — $/sqft
last 12 mo · ≤1 miLoading sold comps…